Numeracy and Data Analytics Report: Wind Speed Analysis & Forecasting

Verified

Added on  2023/06/10

|11
|1435
|478
Report
AI Summary
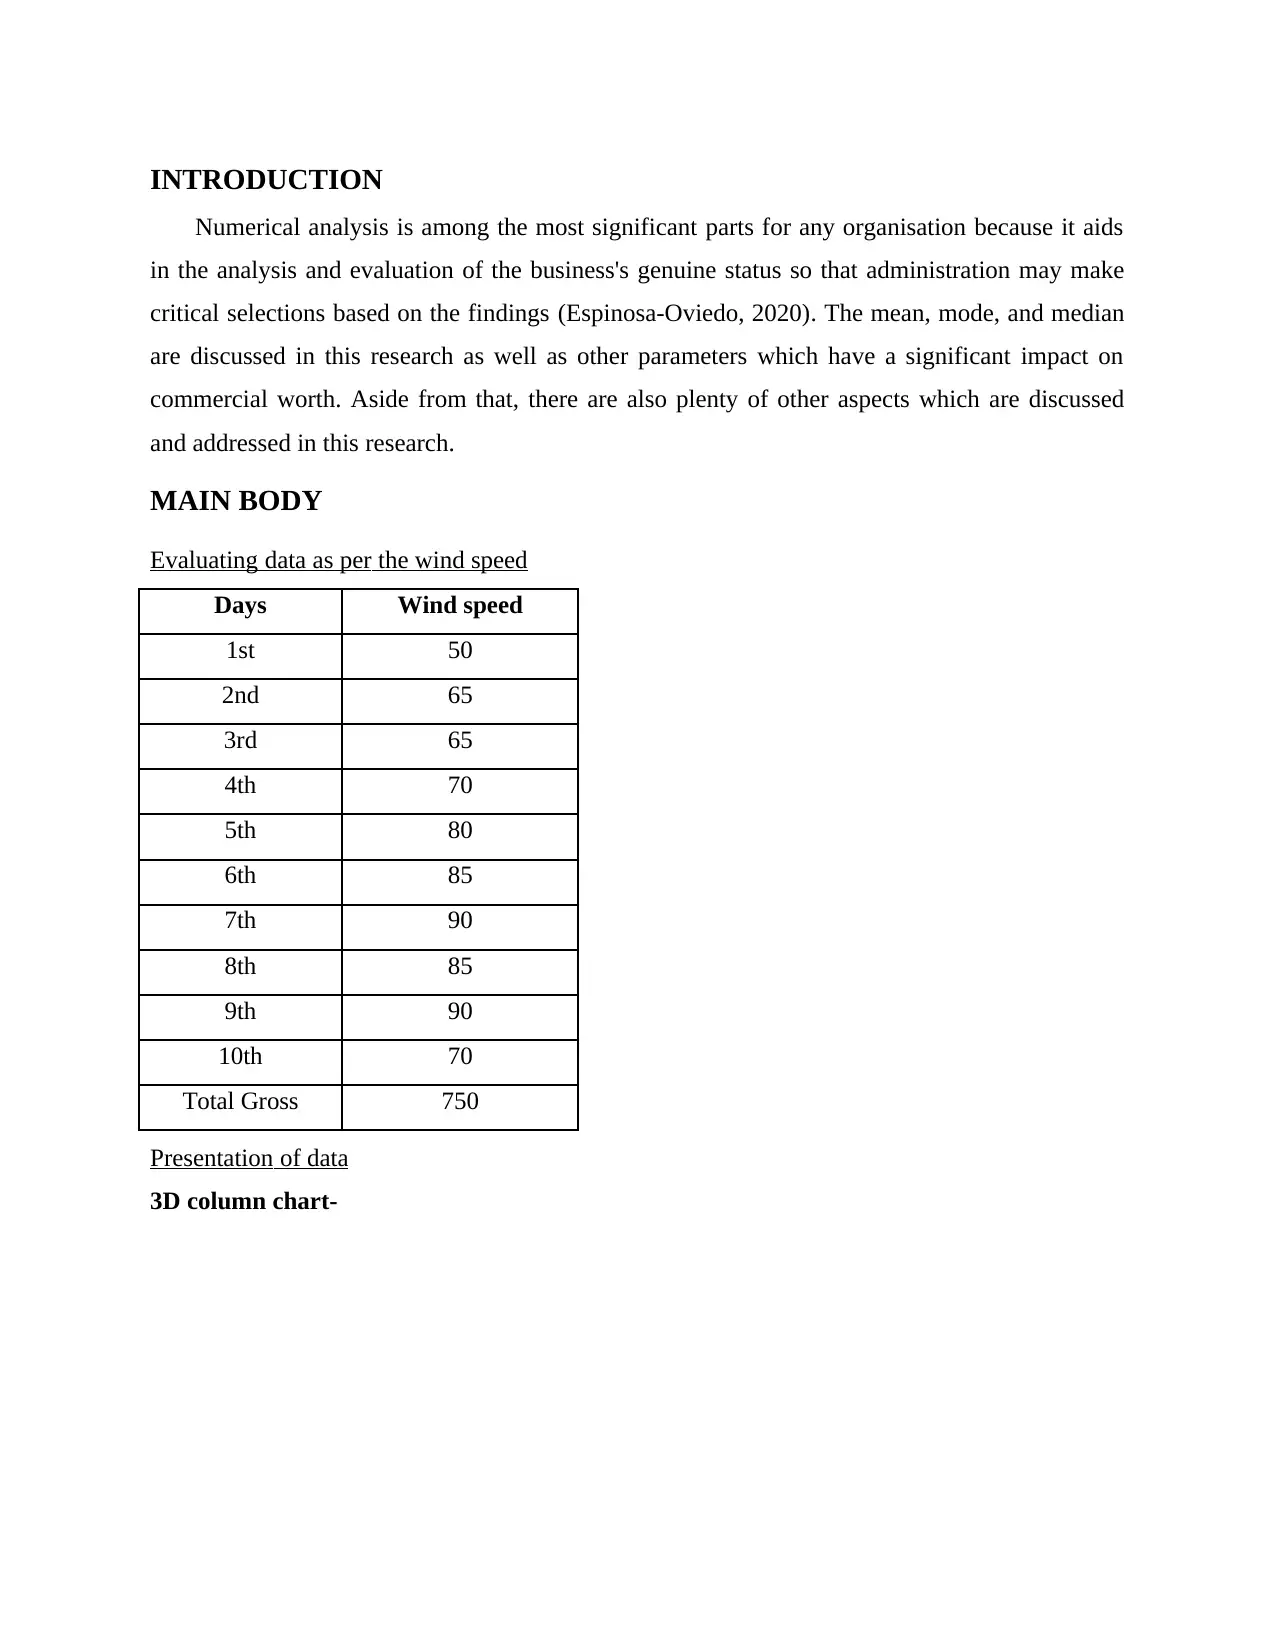
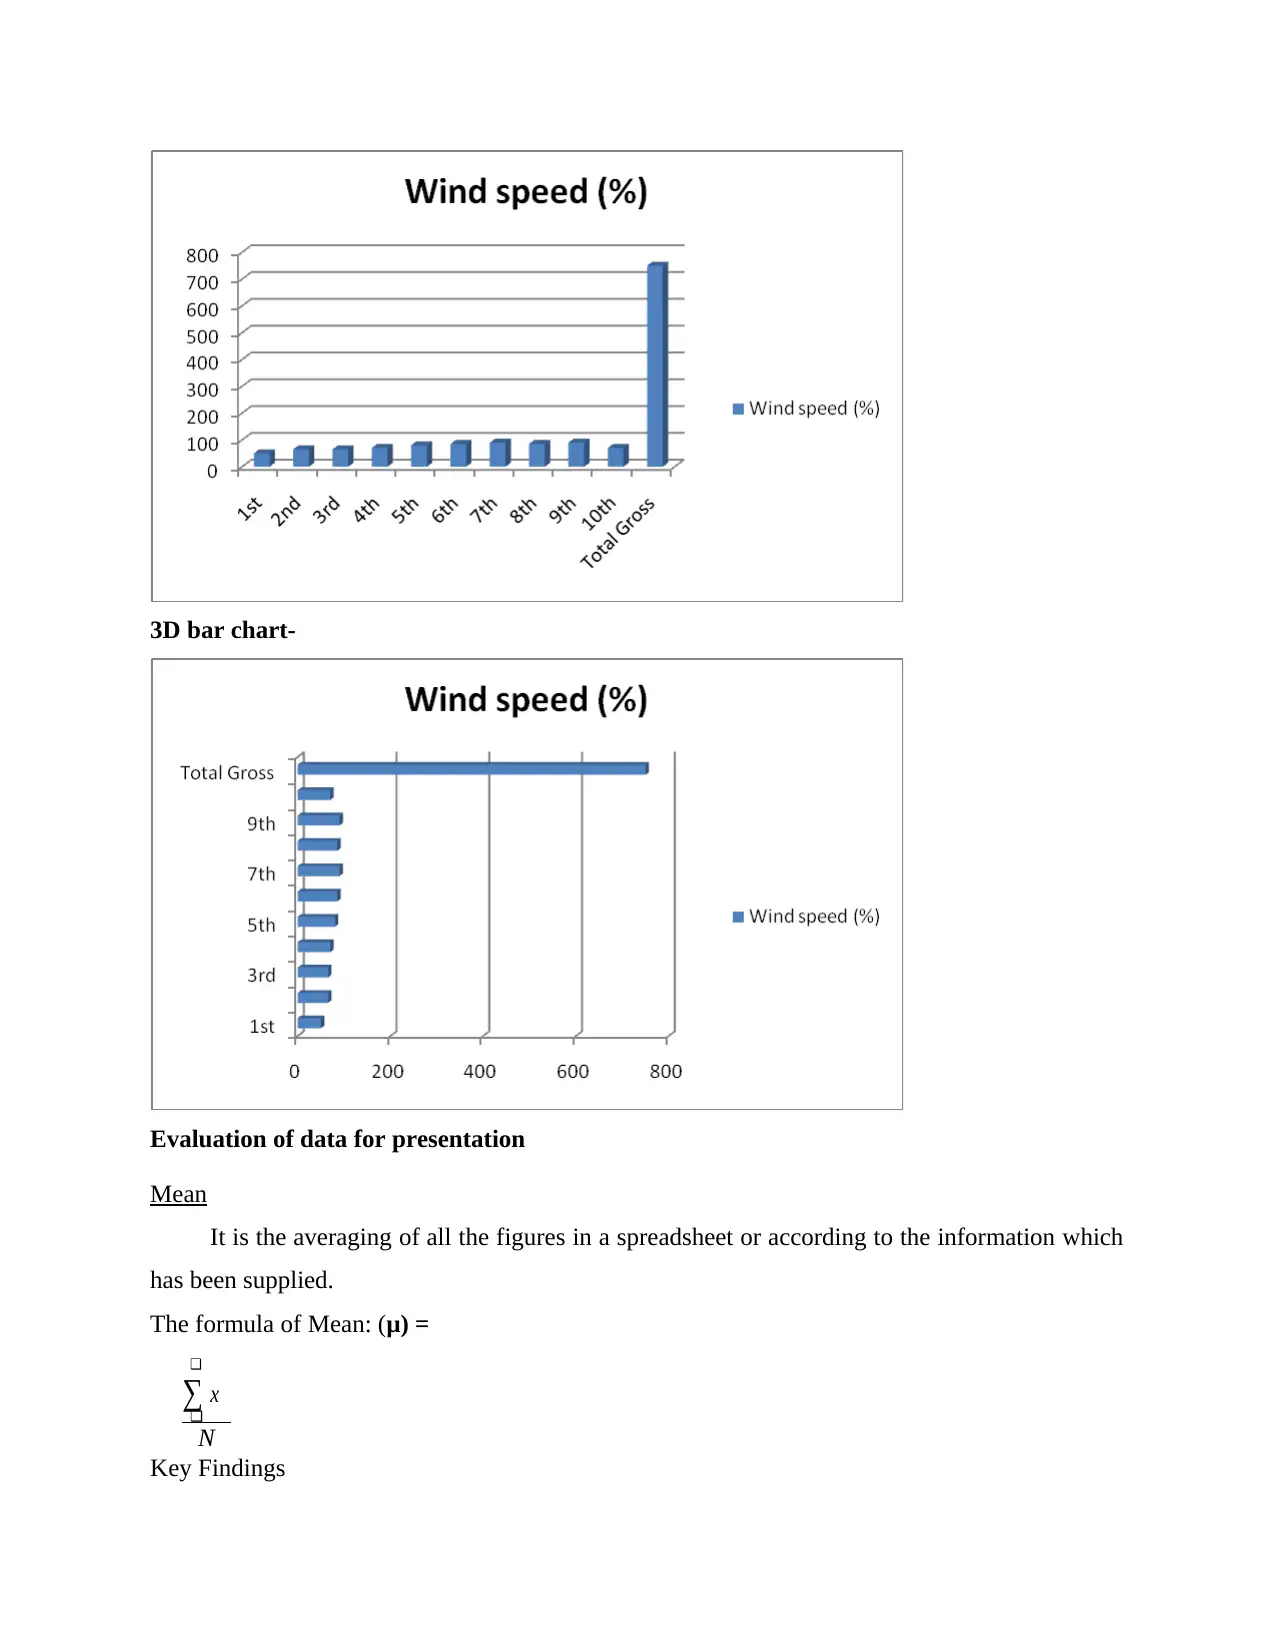
This report provides a comprehensive analysis of wind speed data using various statistical methods. It includes data presentation in chart format, calculation of mean, mode, median, range, and standard deviation. Linear forecasting is applied to predict future wind speeds, and the report concludes with insights on the importance of these analytical methods for organizational benefit. The study utilizes statistical formulas to derive key findings, offering a detailed evaluation of wind speed trends and potential future values.
tabler-icon-diamond-filled.svg

Contribute Materials

Your contribution can guide someone’s learning journey. Share your documents today.
Document Page
Numeracy and data
analytics
tabler-icon-diamond-filled.svg

Secure Best Marks with AI Grader

Need help grading? Try our AI Grader for instant feedback on your assignments.
Document Page
Contents
Contents...........................................................................................................................................2
INTRODUCTION...........................................................................................................................1
MAIN BODY..................................................................................................................................1
Evaluating data as per the wind speed.........................................................................................1
Presentation of data......................................................................................................................1
Mean............................................................................................................................................2
Mode............................................................................................................................................3
Median.........................................................................................................................................3
Range...........................................................................................................................................4
Standard Deviation......................................................................................................................4
Linear Forecasting.......................................................................................................................5
CONCLUSION................................................................................................................................7
REFERENCES................................................................................................................................8
Document Page
Document Page
INTRODUCTION
Numerical analysis is among the most significant parts for any organisation because it aids
in the analysis and evaluation of the business's genuine status so that administration may make
critical selections based on the findings (Espinosa-Oviedo, 2020). The mean, mode, and median
are discussed in this research as well as other parameters which have a significant impact on
commercial worth. Aside from that, there are also plenty of other aspects which are discussed
and addressed in this research.
MAIN BODY
Evaluating data as per the wind speed
Days Wind speed
1st 50
2nd 65
3rd 65
4th 70
5th 80
6th 85
7th 90
8th 85
9th 90
10th 70
Total Gross 750
Presentation of data
3D column chart-
tabler-icon-diamond-filled.svg

Secure Best Marks with AI Grader

Need help grading? Try our AI Grader for instant feedback on your assignments.
Document Page
3D bar chart-
Evaluation of data for presentation
Mean
It is the averaging of all the figures in a spreadsheet or according to the information which
has been supplied.
The formula of Mean: (μ) =

x

N
Key Findings
Document Page
Number of days: 10
Observing the wind speed: 750
Mean (μ): 750: 10 = 75 %
As it could be observed from the preceding computations, the mean of the supplied
information is 75, because the sum was 750 and the digits were 10, therefore we divided that to
get 75.
Mode
It is among the most fundamental aspects of analytics since it is the integer which occurs
frequently in the information and is therefore considered as the integer with the maximum
recurrence in the provided sequence (FitzSimons and Boistrup, 2017). It is so referred to as the
mode.
Key Findings
Number of days =10
Wind speed = 50, 65, 65, 70, 80, 85, 90, 85, 90, 70
Mode = 65%, 70%, 85% and 90%.
As there could be greater than 1 mode or perhaps no mode under some instances, there are
four modes in the feature dataset: 60, 70, 85, and 90, according to the computations previously.
Median
It is the midpoint of any collection which is determined after properly structuring the
statistical model, and its computations are presented beneath in a clear and understandable way.
Formula for median = number of terms +1 divided by 2
Key Findings
Days Wind speed (%)
1st 50
2nd 65
3rd 65
4th 70
10th 70
5th 80
6th 85
Document Page
8th 85
7th 90
9th 90
The number of days = 10
Median value of days = (10+ 1): 2 = 11/ 2= 5.5 %
Average median = (upper value + lower value): 2 = [70+80]: 2 = 75 %
After structuring the variables in a way which is proper according to statistical norms, the
median of the provided information group is 75, as it could be observed from the preceding
computations (Naimipour, Guzdial and Shreiner, 2020).
Range
It is the gap among the greatest and smallest value in a particular observed values, and it is
therefore quite straightforward to compute, although it is extremely valuable and advantageous
to the organisation in the longer run. The computation of range is shown beneath, and it has been
performed in accordance with business standards.
Formulae for range = (Largest value smallest value)
Key Findings
Largest value of wind speed = 90 %
Smallest value of wind speed = 50%
Range = [90 50] = 40%
Standard Deviation
It is the variation from the given database which is examined, and as a result, it is
incredibly beneficial and has a wide range of advantages in the present financial condition, and
its computation is illustrated beneath (Vargas-Solar, Zechinelli-Martini and Espinosa-Oviedo,
2020).
Standard deviation (σ) =
x

(¿−μ)
2

N

¿
Key Findings
tabler-icon-diamond-filled.svg

Paraphrase This Document

Need a fresh take? Get an instant paraphrase of this document with our AI Paraphraser
Document Page
Days Wind speed (%) Mean (μ) (x-μ) (x-μ)^2
1st 50 75 (50-75)=-25 625
2nd 65 75 (65-75)=-10 100
3rd 65 75 (65-75)-10 100
4th 70 75 (70-75)=-5 25
10th 70 75 (70-75)=-5 25
5th 80 75 (80-75)=5 25
6th 85 75 (85-75)=10 100
8th 85 75 (85-75)=10 100
7th 90 75 (90-75)=15 225
9th 90 75 (90-75)=15 225
Total Gross 750 0 1550
= √ [1550:10]
= 12.44 %
Linear Forecasting
Days Wind speed (%)
1st 50
2nd 65
3rd 65
4th 70
10th 70
5th 80
6th 85
8th 85
7th 90
9th 90
Linear forecasting formula= (y = mx + c)
Value for m
Number of days= 10
Formulae of m =
Document Page
x ¿ 2
N x2−¿ N xy∑x y
¿
Days (x) Wind speed (y) x^2 x*y
1 50 1 50
2 65 4 130
3 65 9 195
4 70 16 280
5 80 25 400
6 85 36 480
7 90 49 630
8 85 64 680
9 90 81 810
10 70 100 700
55 750 385 4355
m = (10 x 4355 -55 x 750): (10 x 385 -55 x 55)
= 2300: 825
= 2.78
Linear forecasting is 2.78
Inculcating the value of c
The number of days = 10
The formula of c =
y − m∑ x
N
Key Findings
c = [750 – 2.78x 55]: 10 = 747.22: 10 = 74.72.
Value of c is computed and it stands at 74.72.
Forecasting wind speed of 11th and 13th days
Computing the values of m and c as per the linear forecasting
Linear forecasting formula = (y = 2.78 x + 74.72)
On the 11th day, the value of x is 11
Document Page
Forecasting of wind speed of 11th day=
y = 2.78 x 11+ 74.72
y = 105.3 %
13th day, the value of x is 13
Forecasting of wind speed of 13th day=
y = 2.78 x 13+ 74.72
y = 110.86 %
CONCLUSION
It could be deduced from the aforementioned study that there are several variables which
have a series of long-term worth for the corporation, and therefore all facets such as mean, mode,
and median, as well as their relevant determinants, must be estimated in a really exact layout in
order to add benefit to the organisation in the industry.
tabler-icon-diamond-filled.svg

Secure Best Marks with AI Grader

Need help grading? Try our AI Grader for instant feedback on your assignments.
Document Page
REFERENCES
Books and journals
Espinosa-Oviedo, J.A., 2020. Enacting Data Science Pipelines for Exploring Graphs: From
Libraries to Studios. In ADBIS, TPDL and EDA 2020 Common Workshops and
Doctoral Consortium: International Workshops: DOING, MADEISD, SKG, BBIGAP,
SIMPDA, AIMinScience 2020 and Doctoral Consortium, Lyon, France, August 25-27,
2020, Proceedings (Vol. 1260, p. 271). Springer Nature.
FitzSimons, G. E. and Boistrup, L. B., 2017. In the workplace mathematics does not announce
itself: Towards overcoming the hiatus between mathematics education and work.
Educational Studies in Mathematics. 95(3). pp.329-349.
Naimipour, B., Guzdial, M. and Shreiner, T., 2020, October. Engaging Pre-Service Teachers in
Front-End Design: Developing Technology for a Social Studies Classroom. In 2020
IEEE Frontiers in Education Conference (FIE) (pp. 1-9). IEEE.
Vargas-Solar, G., Zechinelli-Martini, J.L. and Espinosa-Oviedo, J.A., 2020, August. Enacting
data science pipelines for exploring graphs: from libraries to studios. In ADBIS, TPDL
and EDA 2020 Common Workshops and Doctoral Consortium (pp. 271-280). Springer,
Cham.
chevron_up_icon
1 out of 11
circle_padding
hide_on_mobile
zoom_out_icon
logo.png

Your All-in-One AI-Powered Toolkit for Academic Success.

Available 24*7 on WhatsApp / Email

[object Object]