Numeracy & Data Analysis: Wind Speed Forecasting Report CCCU

Verified

Added on  2023/06/11

|9
|1722
|192
Report
AI Summary
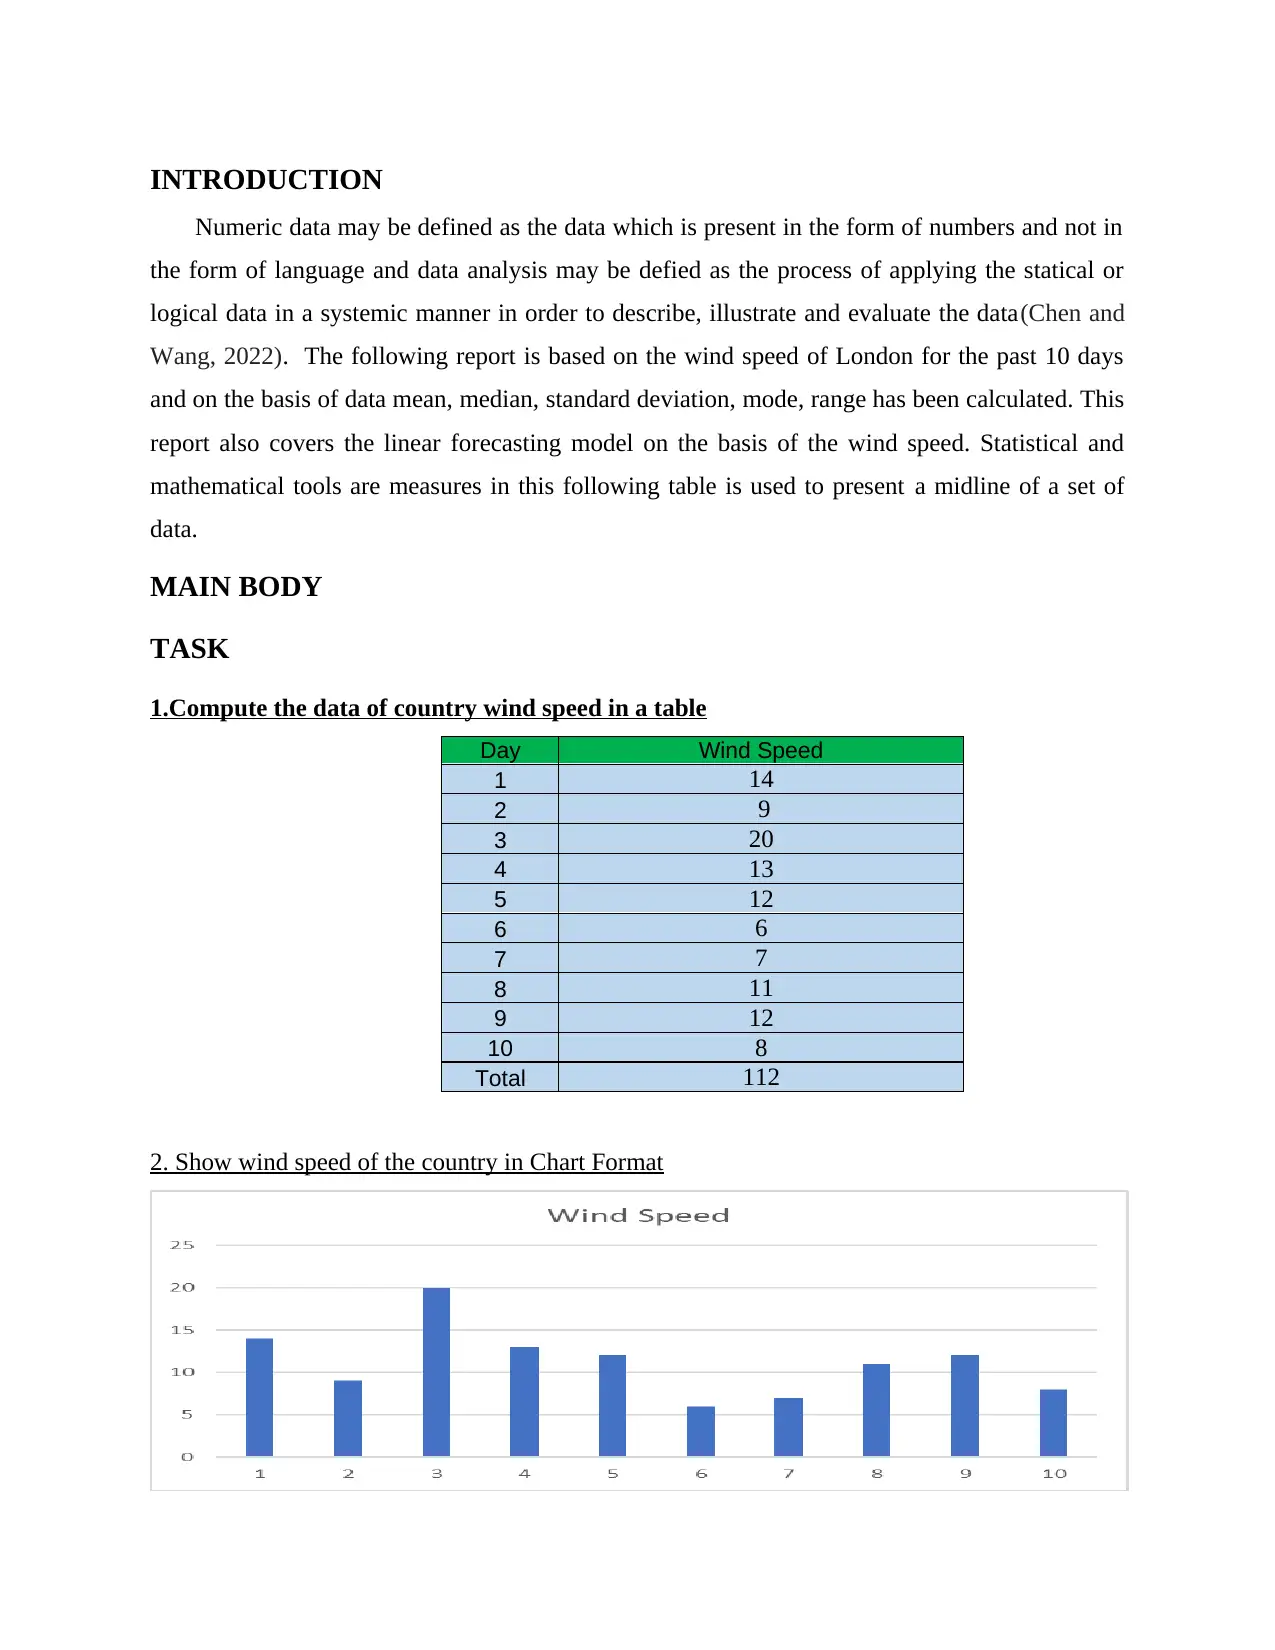
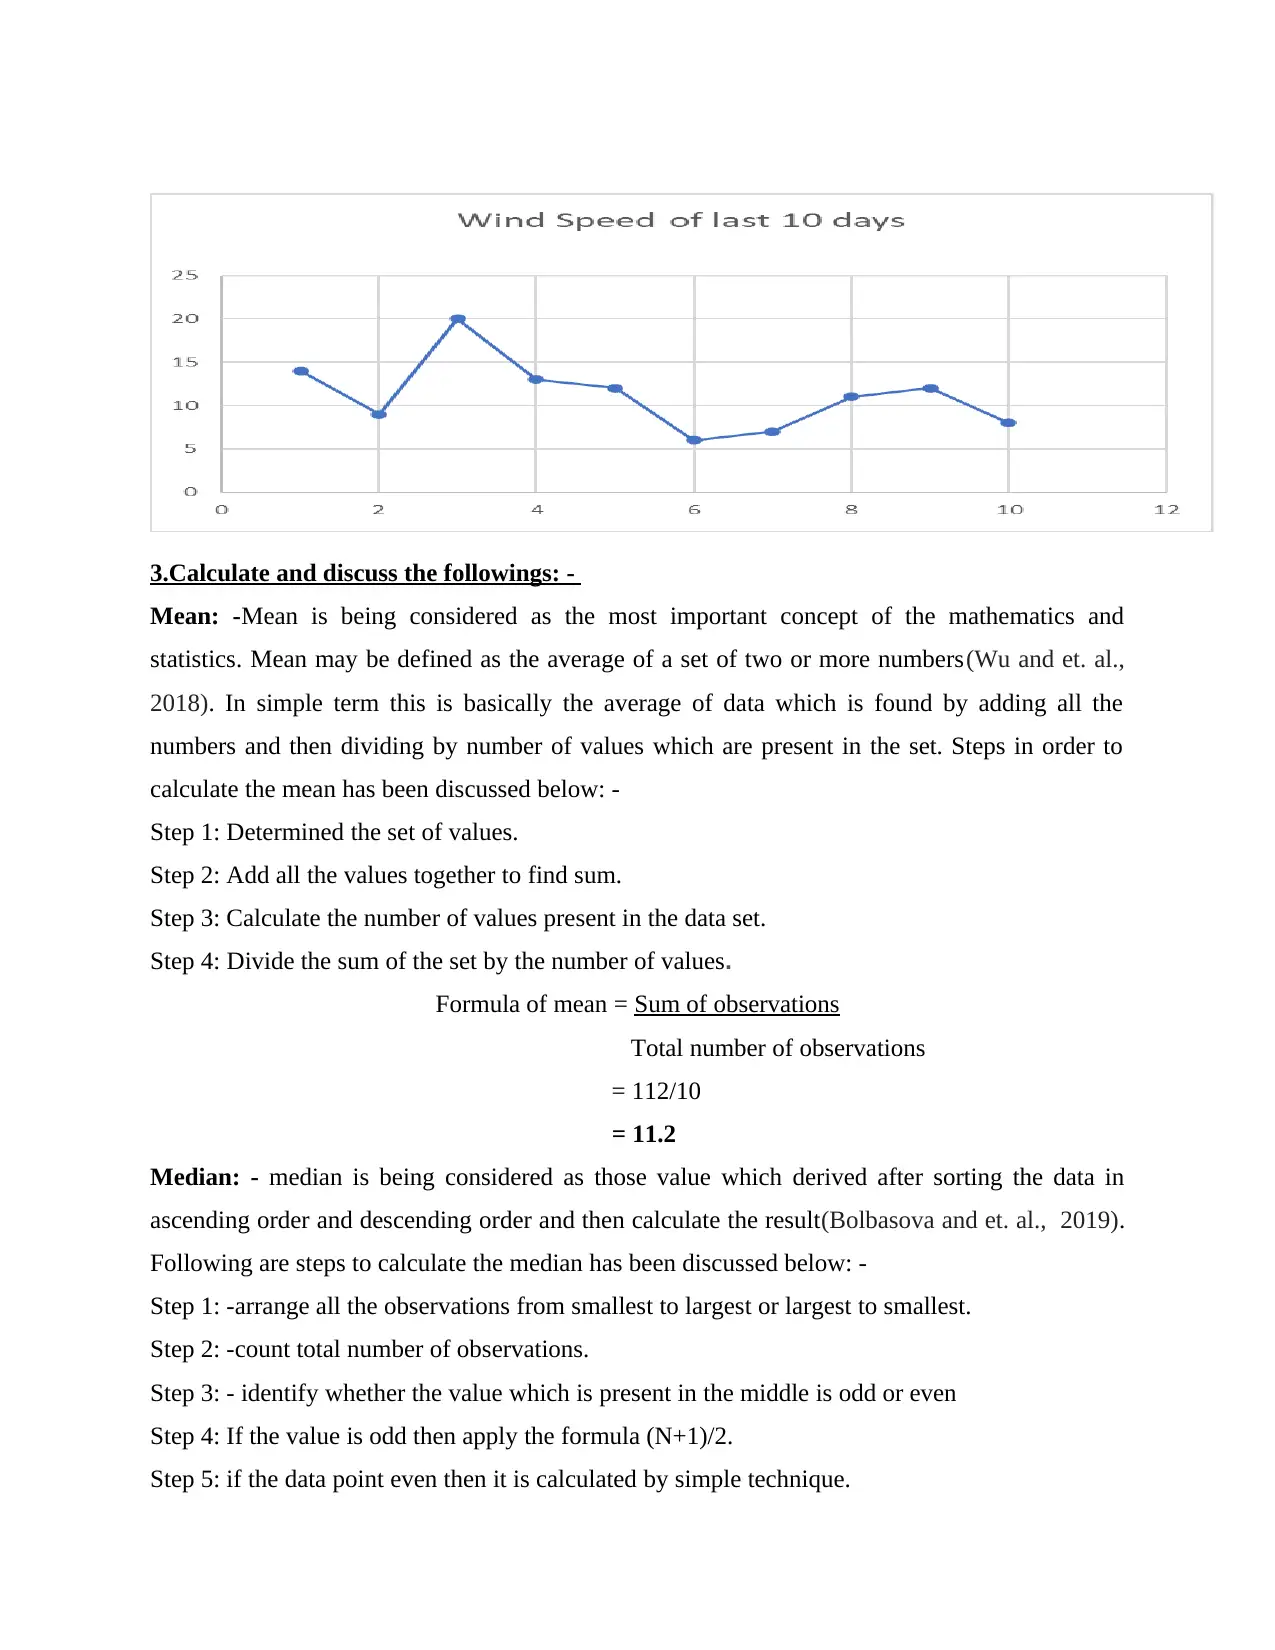
This report focuses on the numerical and data analysis of wind speed in London over a 10-day period. It computes the wind speed data in a tabular format and visualizes it using a chart. The report calculates and discusses key statistical measures such as mean, median, mode, range, and standard deviation. Furthermore, it employs linear predicting theory to conduct regression analysis and determine the values of 'c' and 'm' in the linear equation. The analysis includes steps for calculating each statistical measure and applying the linear forecasting model to predict wind speeds on days 11 and 13. The report concludes by highlighting the usefulness of these methods in measuring and predicting wind speeds, referencing relevant books and journals.
Document Page
Numeracy and Data
Analysis
tabler-icon-diamond-filled.svg

Paraphrase This Document

Need a fresh take? Get an instant paraphrase of this document with our AI Paraphraser
Document Page
Table of Contents
INTRODUCTION .........................................................................................................................3
MAIN BODY ..................................................................................................................................3
TASK ..............................................................................................................................................3
1.Compute the data of country wind speed in a table.................................................................3
2. Show wind speed of the country in Chart Format...................................................................3
3.Calculate and discuss the followings: - ...................................................................................4
4. Exploitation Linear Predicting theory do regression investigates and find the value of c and
m..................................................................................................................................................6
CONCLUSION ...............................................................................................................................8
REFERENCES................................................................................................................................9
Document Page
INTRODUCTION
Numeric data may be defined as the data which is present in the form of numbers and not in
the form of language and data analysis may be defied as the process of applying the statical or
logical data in a systemic manner in order to describe, illustrate and evaluate the data(Chen and
Wang, 2022). The following report is based on the wind speed of London for the past 10 days
and on the basis of data mean, median, standard deviation, mode, range has been calculated. This
report also covers the linear forecasting model on the basis of the wind speed. Statistical and
mathematical tools are measures in this following table is used to present a midline of a set of
data.
MAIN BODY
TASK
1.Compute the data of country wind speed in a table
Day Wind Speed
1 14
2 9
3 20
4 13
5 12
6 6
7 7
8 11
9 12
10 8
Total 112
2. Show wind speed of the country in Chart Format
Document Page
3.Calculate and discuss the followings: -
Mean: -Mean is being considered as the most important concept of the mathematics and
statistics. Mean may be defined as the average of a set of two or more numbers(Wu and et. al.,
2018). In simple term this is basically the average of data which is found by adding all the
numbers and then dividing by number of values which are present in the set. Steps in order to
calculate the mean has been discussed below: -
Step 1: Determined the set of values.
Step 2: Add all the values together to find sum.
Step 3: Calculate the number of values present in the data set.
Step 4: Divide the sum of the set by the number of values.
Formula of mean = Sum of observations
Total number of observations
= 112/10
= 11.2
Median: - median is being considered as those value which derived after sorting the data in
ascending order and descending order and then calculate the result(Bolbasova and et. al., 2019).
Following are steps to calculate the median has been discussed below: -
Step 1: -arrange all the observations from smallest to largest or largest to smallest.
Step 2: -count total number of observations.
Step 3: - identify whether the value which is present in the middle is odd or even
Step 4: If the value is odd then apply the formula (N+1)/2.
Step 5: if the data point even then it is calculated by simple technique.
tabler-icon-diamond-filled.svg

Paraphrase This Document

Need a fresh take? Get an instant paraphrase of this document with our AI Paraphraser
Document Page
Formula
If Median value is even= n/ 2
If Median value is odd= (n+1) / 2
Calculation of wind speed median: -
Data: - 14, 9, 20, 13, 12, 6, 7, 11, 12, 8
Ascending order: - 6, 7, 8, 9, 11 ,12, 12, 13, 14, 20
Median= Number of data/2
=10/2
=5 TH position
Median= (11+12)/2
= 23/2
= 11.5
Mode: - Mode may be defined as that observation which appears most frequently in the set of
data(Hu, Wang and Tao, 2021). Following are steps for calculating the mode: -
Step1: -Examine all the observation in the set.
Step2: -Sort the given data in ascending or descending order.
Step3: -Count the number of values present in the data set.
Step4: -Select the number which repeat most frequently.
Calculation of Mode: -
Data: - 14, 9, 20, 13, 12, 6, 7, 11, 12, 8
Ascending order: - 6, 7, 8, 9, 11 ,12, 12, 13, 14, 20
Mode = 12
Range: -the range may be defined as the difference between the largest observation and the
smallest observation form the given data. Range is calculated by subtracting the highest value for
the lowest value. Following are the steps in order to calculate the range has been discussed
below: -
Step1: -Examine as well as arrange the data in a very proper manner.
Step2: -Identify the highest and lowest observation.
Step3: -Subtract the lowest data form the highest data.
Step4: the result is the value of range.
Document Page
Data: - 14, 9, 20, 13, 12, 6, 7, 11, 12, 8
Ascending order: - 6, 7, 8, 9, 11 ,12, 12, 13, 14, 20
Value of range = highest value – lowest value
= 20 - 6
Range =14
Standard deviation: - this Indicates the spread of the data in relative to the mean value(Zhao
and et. al., 2020). Following are the steps in order to calculate the standard deviation has been
mentioned below: -
Step 1: Observe the average first.
Step 2: Next, calculate the deviation of each observation from the mean.
Step 3: next step is to find out the square of each observation.
Step 4: Divide further by the total number of records.
Step 5: Finally, find out the square root and then calculate the SD.
Standard Deviation= √∑ (xi – μ) 2 / N
= 149.6/10
S. D=3.16
4. Exploitation Linear Predicting theory do regression investigates and find the value of c and m.
Lineal Forecasting Theory: It is useful for future predicting and it is ready on the basis of
historical occurrence(Yang and Wang, 2018). Here are some formula to measure the Lineal
forecasting theory.
There are various points to measure lineal Forecasting Theory:
Step1: Analyse the issue developing.
Step2: Collecting the details
Step3: Accomplish a happening analysis
Step4: select the theory for predicting task.
Step5: Then identifg the information
Step6: Examine the results of theory.
Document Page
y = mx + C
where, 'y' is stands for Dependent Factor,
'mx' is stands for Independent factor and
'c' stands for constant Factor
Some are the directions to measure the value of 'm':
Multiply the worth of both the circumstance.
Add the total worth calculated
Each circumstance should be added isolated.
Multiply the worth of both the variables.
Than measure the worth.
m = (10*565 – 55*112) / (10*385 – 3025)
m = (5650 – 6160) / (3850 – 3025)
m= -510 / 825
m = -0.618
Points for measuring value of 'c'
Point1: Firstly, measure the value of 'y' factors.
Point2: Measure the worth of 'y' variable.
Point3: divide the quantity with worth 'N'.
Point4: Afterwards the above measure the value of 'c' is calculated.
c = (112 - (-0.618*55)) / 10
c = (112 + 33.99) / 10
c = 145.99 / 10
tabler-icon-diamond-filled.svg

Paraphrase This Document

Need a fresh take? Get an instant paraphrase of this document with our AI Paraphraser
Document Page
c = 14.60
Wind speed on Day 11: -
m = -0.618, c = 14.60, x = 11
y = mx + c
y = -0.618 * 11 + 14.60
y = -6.80 + 14.60
y = 7.8
Wind Speed on Day 13: -
m = -0.618, c = 14.60, x = 13
y = mx + c
y = -0.618 * 13 + 14.60
y = -8.034 + 14.60
y = 6.57
CONCLUSION
In the above case it shows the wind speed data of the nation and also useful for the future
predicting. They useful in measuring wind speed of the nation with the assist of mean, median,
mode,range, standard deviation and linear forecasting concept. Linear forecasting theory is
useful in identifying the day 11 and day 13 wind speed of the nation.
Document Page
REFERENCES
Books and Journals
Chen, M. and Wang, H., 2022. Principal Component Analysis of Numeric Distributional Data.
In Analysis of Distributional Data (pp. 247-272). Chapman and Hall/CRC.
Wu, J and et. al., 2018. Changes in terrestrial near-surface wind speed and their possible causes:
an overview. Climate dynamics, 51(5), pp.2039-2078.
Bolbasova, L.A. and et. al., 2019. Daytime optical turbulence and wind speed distributions at the
Baikal Astrophysical Observatory. Monthly Notices of the Royal Astronomical
Society, 482(2), pp.2619-2626.
Hu, H., Wang, L. and Tao, R., 2021. Wind speed forecasting based on variational mode
decomposition and improved echo state network. Renewable Energy, 164, pp.729-751.
Zhao, X. and et. al., 2020. Short-term average wind speed and turbulent standard deviation
forecasts based on one-dimensional convolutional neural network and the integrate
method for probabilistic framework. Energy Conversion and Management, 203,
p.112239.
Yang, Z. and Wang, J., 2018. A combination forecasting approach applied in multistep wind
speed forecasting based on a data processing strategy and an optimized artificial
intelligence algorithm. Applied energy, 230, pp.1108-1125.
chevron_up_icon
1 out of 9
circle_padding
hide_on_mobile
zoom_out_icon
[object Object]