Wind Speed Data Analysis: Mean, Mode, Median, Range, and Forecasting

Verified

Added on  2023/06/10

|11
|1423
|263
Project
AI Summary
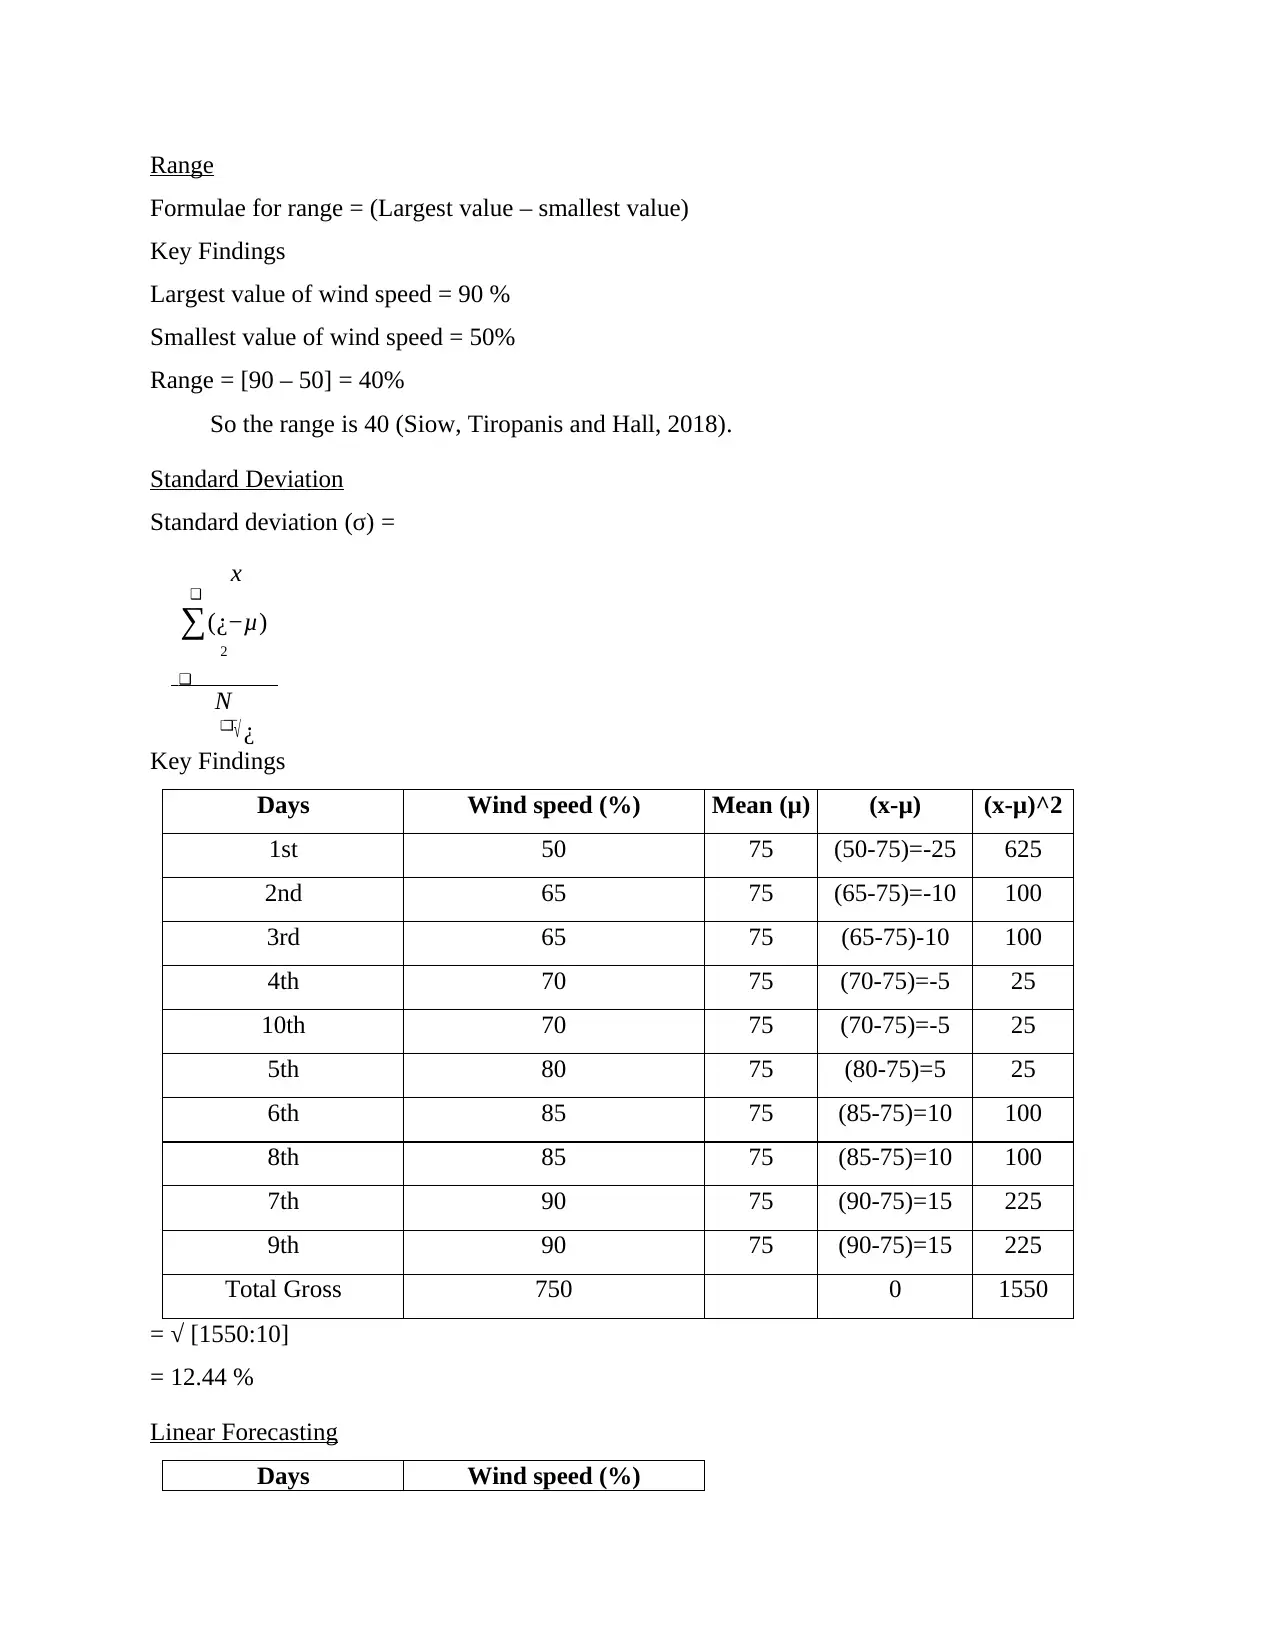
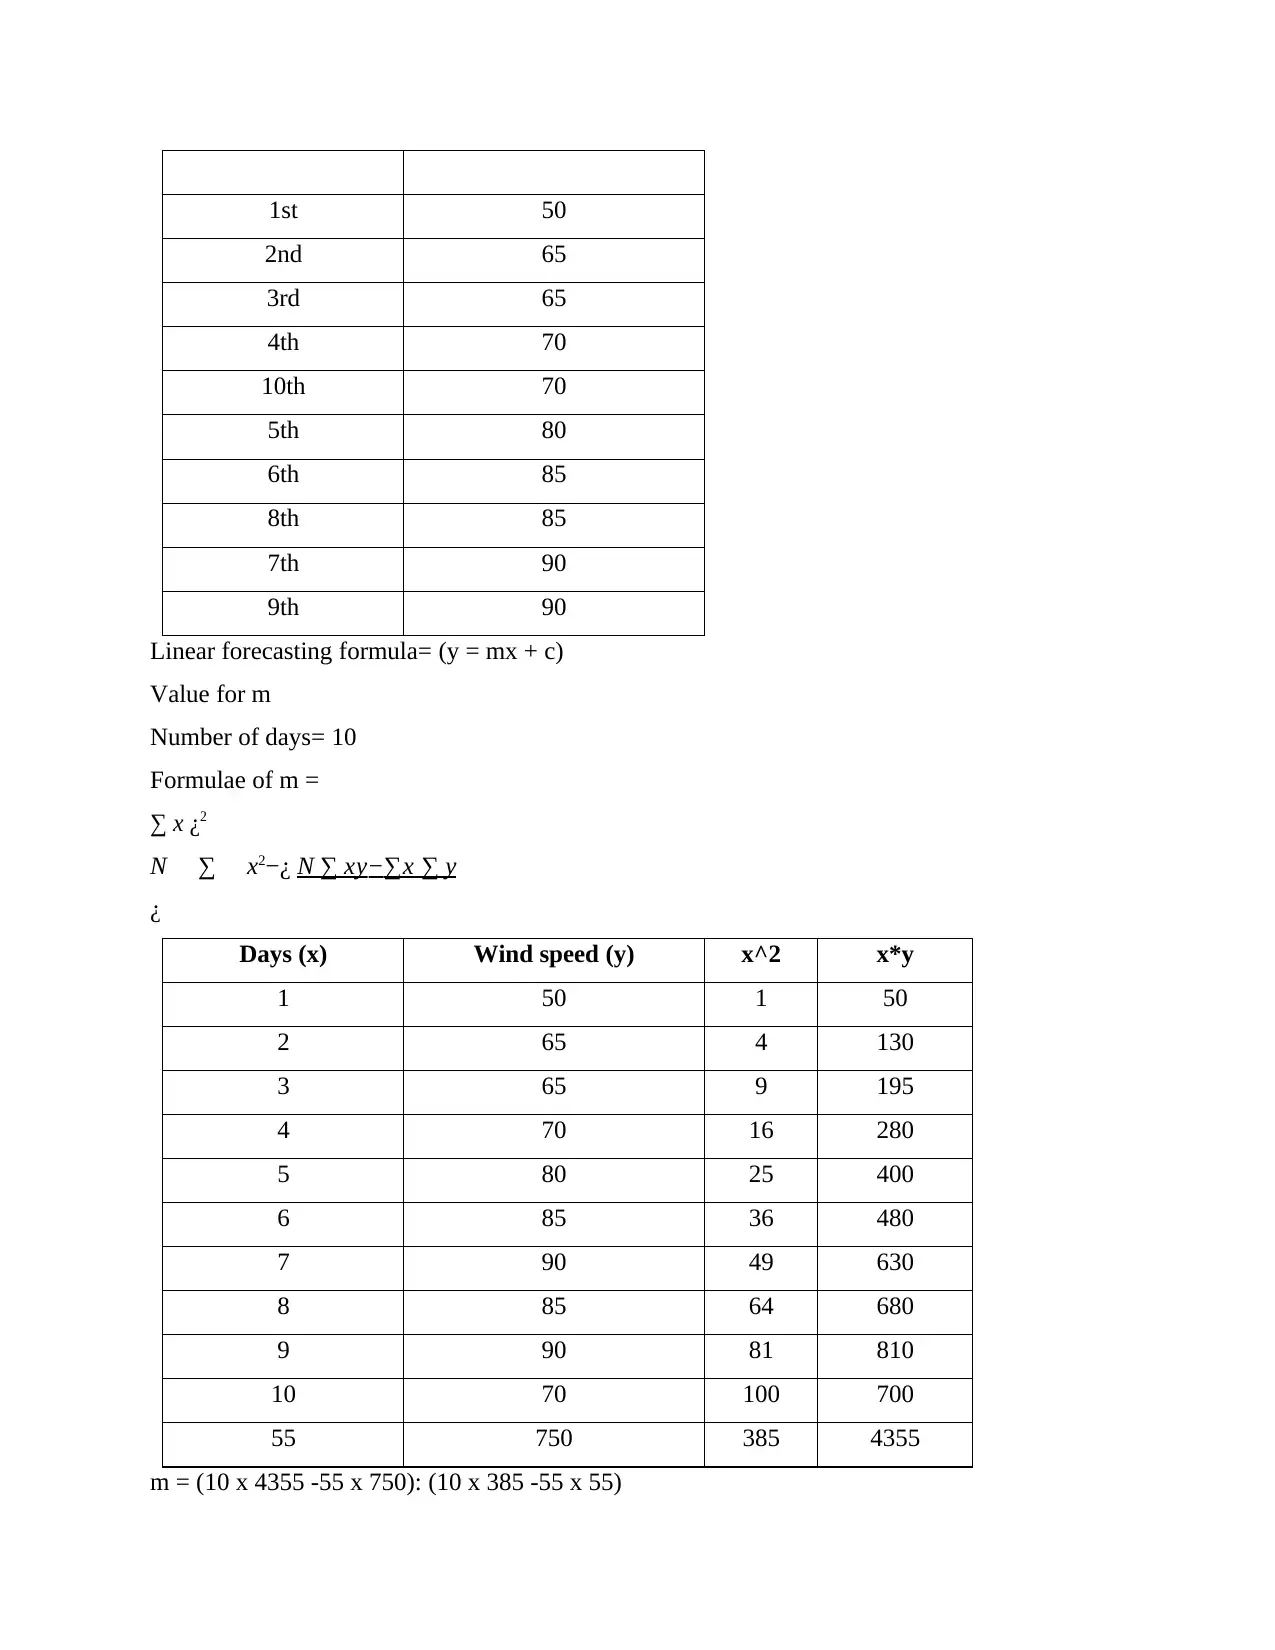
This project provides a comprehensive analysis of wind speed data, employing various statistical methods to extract meaningful insights. The project begins with an introduction emphasizing the importance of data analysis and its application in forecasting, especially in the context of wind speed. The main body of the project involves evaluating wind speed data over a period of days, presenting the data visually through charts, and calculating key statistical measures such as mean, mode, median, range, and standard deviation. The project also incorporates linear forecasting to predict future wind speeds. The calculations are detailed, and the results are interpreted to understand wind patterns. The conclusion highlights the practical applications of the analysis, emphasizing how the insights gained can be used for business decision-making and strategic planning. The project references several academic sources to support the methodologies and findings.
tabler-icon-diamond-filled.svg

Contribute Materials

Your contribution can guide someone’s learning journey. Share your documents today.
Document Page
Project
tabler-icon-diamond-filled.svg

Secure Best Marks with AI Grader

Need help grading? Try our AI Grader for instant feedback on your assignments.
Document Page
Contents
Contents...........................................................................................................................................2
INTRODUCTION...........................................................................................................................1
MAIN BODY..................................................................................................................................1
Evaluating data as per the wind speed.........................................................................................1
Presentation of data......................................................................................................................2
Mean............................................................................................................................................2
Mode............................................................................................................................................3
Median.........................................................................................................................................3
Range...........................................................................................................................................4
Standard Deviation......................................................................................................................4
Linear Forecasting.......................................................................................................................5
CONCLUSION................................................................................................................................6
REFERENCES................................................................................................................................8
Document Page
Document Page
INTRODUCTION
Statistics and intelligence are greatly appreciated in today's world, and so this statement
stresses the significance of statistics and database analysis (Bello-Orgaz, Jung and Camacho,
2016). In contrast, collected information must be managed in such a manner that it would be
comprehensible, approachable, and relevant to many other responding variables. Every company
in the network is combining technology resources in order to offer unique perspectives on
prospective cooperation. This data is essential for forecasting sector and geographic patterns.
This data is necessary for every industry to create budgetary commitments. A firm's process of
incorporating projections could help show how to increase earnings whilst preventing disasters.
A diversity of figures would be utilised to describe the information, and even a method for
assessing wind speed that also include various factors like mean, median, mode, standard
deviation, and range. By properly evaluating this, a business could indeed survive all its
competitors in the big scheme of things, and almost always in a quite short time, and could
additionally obtain a dominant position in the business market whereby it operates and manages
to broaden in the comparable area as well as in the similar region (Dubey, Gunasekaran and
Childe, 2019).
MAIN BODY
Evaluating data as per the wind speed
Days Wind speed
1st 50
2nd 65
3rd 65
4th 70
5th 80
6th 85
7th 90
8th 85
9th 90
10th 70
tabler-icon-diamond-filled.svg

Secure Best Marks with AI Grader

Need help grading? Try our AI Grader for instant feedback on your assignments.
Document Page
Total Gross 750
Presentation of data
3D column chart-
3D bar chart-
Evaluation of data for presentation
Mean
The formula of Mean: (μ) =

x
Document Page
N
Key Findings
Number of days: 10
Observing the wind speed: 750
Mean (μ): 750: 10 = 75 %
So the mean is 75 (Geiger, 2016).
Mode
Key Findings
Number of days =10
Wind speed = 50, 65, 65, 70, 80, 85, 90, 85, 90, 70
Mode = 65%, 70%, 85% and 90%.
So the mode is the above calculated 4 terms (Hoeren and Kolany-Raiser, 2017).
Median
Formula for median = number of terms +1 divided by 2
Key Findings
Days Wind speed (%)
1st 50
2nd 65
3rd 65
4th 70
10th 70
5th 80
6th 85
8th 85
7th 90
9th 90
The number of days = 10
Median value of days = (10+ 1): 2 = 11/ 2= 5.5 %
Average median = (upper value + lower value): 2 = [70+80]: 2 = 75 %
So the median is 75 (Mehta, 2016).
Document Page
Range
Formulae for range = (Largest value smallest value)
Key Findings
Largest value of wind speed = 90 %
Smallest value of wind speed = 50%
Range = [90 50] = 40%
So the range is 40 (Siow, Tiropanis and Hall, 2018).
Standard Deviation
Standard deviation (σ) =
x

(¿−μ)
2

N
¿
Key Findings
Days Wind speed (%) Mean (μ) (x-μ) (x-μ)^2
1st 50 75 (50-75)=-25 625
2nd 65 75 (65-75)=-10 100
3rd 65 75 (65-75)-10 100
4th 70 75 (70-75)=-5 25
10th 70 75 (70-75)=-5 25
5th 80 75 (80-75)=5 25
6th 85 75 (85-75)=10 100
8th 85 75 (85-75)=10 100
7th 90 75 (90-75)=15 225
9th 90 75 (90-75)=15 225
Total Gross 750 0 1550
= √ [1550:10]
= 12.44 %
Linear Forecasting
Days Wind speed (%)
tabler-icon-diamond-filled.svg

Paraphrase This Document

Need a fresh take? Get an instant paraphrase of this document with our AI Paraphraser
Document Page
1st 50
2nd 65
3rd 65
4th 70
10th 70
5th 80
6th 85
8th 85
7th 90
9th 90
Linear forecasting formula= (y = mx + c)
Value for m
Number of days= 10
Formulae of m =
x ¿ 2
N x2−¿ N xy∑x y
¿
Days (x) Wind speed (y) x^2 x*y
1 50 1 50
2 65 4 130
3 65 9 195
4 70 16 280
5 80 25 400
6 85 36 480
7 90 49 630
8 85 64 680
9 90 81 810
10 70 100 700
55 750 385 4355
m = (10 x 4355 -55 x 750): (10 x 385 -55 x 55)
Document Page
= 2300: 825
= 2.78
Linear forecasting is 2.78
Inculcating the value of c
The number of days = 10
The formula of c =
y − m∑ x
N
Key Findings
c = [750 – 2.78x 55]: 10 = 747.22: 10 = 74.72.
Value of c is computed and it stands at 74.72.
Forecasting wind speed of 11th and 13th days
Computing the values of m and c as per the linear forecasting
Linear forecasting formula = (y = 2.78 x + 74.72)
On the 11th day, the value of x is 11
Forecasting of wind speed of 11th day=
y = 2.78 x 11+ 74.72
y = 105.3 %
13th day, the value of x is 13
Forecasting of wind speed of 13th day=
y = 2.78 x 13+ 74.72
y = 110.86 %
CONCLUSION
Employing increasingly optimistic techniques, this study demonstrates how to determine
the mean, median, and mode, and also forecast information. Wind speed is widely exploited in
cities to create exactly an element that has a tremendous of commercial importance as it can help
to prepare in advance about what is coming in the near future. Such strategies could benefit both
corporations and non-profit organisations by assisting businesses in forecasting revenues,
computing and gathering critical information, and so on, allowing both to function
increasingly, consistently and economically. When it pertains to achieving company goals in
today's world, understanding is a beneficial tool for reviewing and adapting to past, present, and
Document Page
statistical standpoint. The schedules of investigators are jam-packed with activities, involving
information analysis. It's pointless if customers have to search over multiple tabs every day to
find the data they're looking for. Nevertheless, in subsequent years, the amount of items available
has substantially expanded. It's great for investigators to have much more material, which may
supposedly lead to superior assessments, but it's also a concern since it can lead to substantial
personnel exhaustion over period. It's vital for investigators to achieve the correct balance
between work and personal interests.
tabler-icon-diamond-filled.svg

Secure Best Marks with AI Grader

Need help grading? Try our AI Grader for instant feedback on your assignments.
Document Page
REFERENCES
Books and journals
Bello-Orgaz, G., Jung, J. J. and Camacho, D., 2016. Social big data: Recent achievements and
new challenges. Information Fusion. 28. pp.45-59.
Dubey, R., Gunasekaran, A. and Childe, S. J., 2019. Big data analytics capability in supply chain
agility. Management Decision.
Geiger, N., 2016. “Psychological” elements in business cycle theories: old approaches and new
insights. The European Journal of the History of Economic Thought. 23(3). pp.478-507.
Hoeren, T. and Kolany-Raiser, B., 2017. Big Data in context: Legal, social and technological
insights. Springer Nature.
Mehta, A., 2016. Tapping the value from big data analytics. Journal of Petroleum Technology.
68(12). pp.40-41.
Siow, E., Tiropanis, T. and Hall, W., 2018. Analytics for the internet of things: A survey. ACM
computing surveys (CSUR). 51(4). pp.1-36.
chevron_up_icon
1 out of 11
circle_padding
hide_on_mobile
zoom_out_icon
logo.png

Your All-in-One AI-Powered Toolkit for Academic Success.

Available 24*7 on WhatsApp / Email

[object Object]