Wind Speed Analysis: A Report on Numeracy, Data & Forecasting

Verified

Added on  2023/06/11

|10
|1369
|288
Report
AI Summary
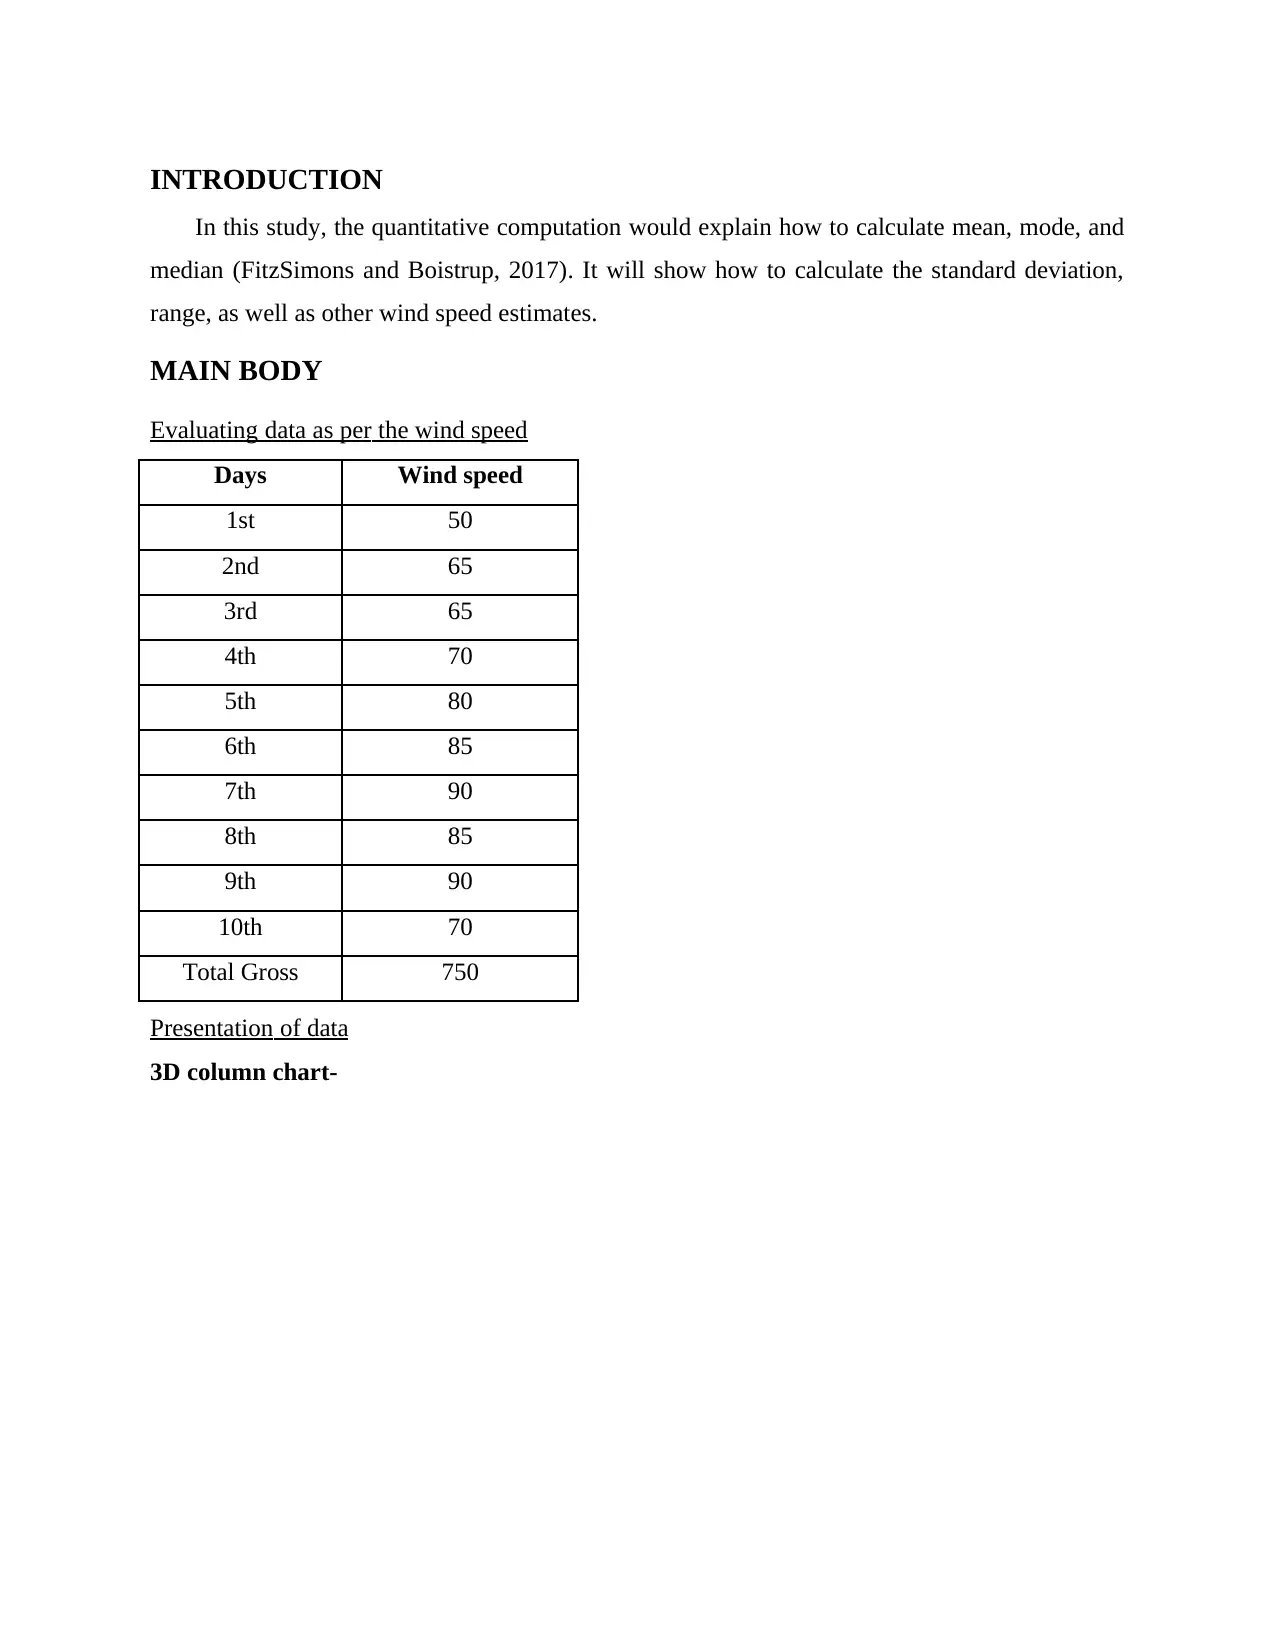
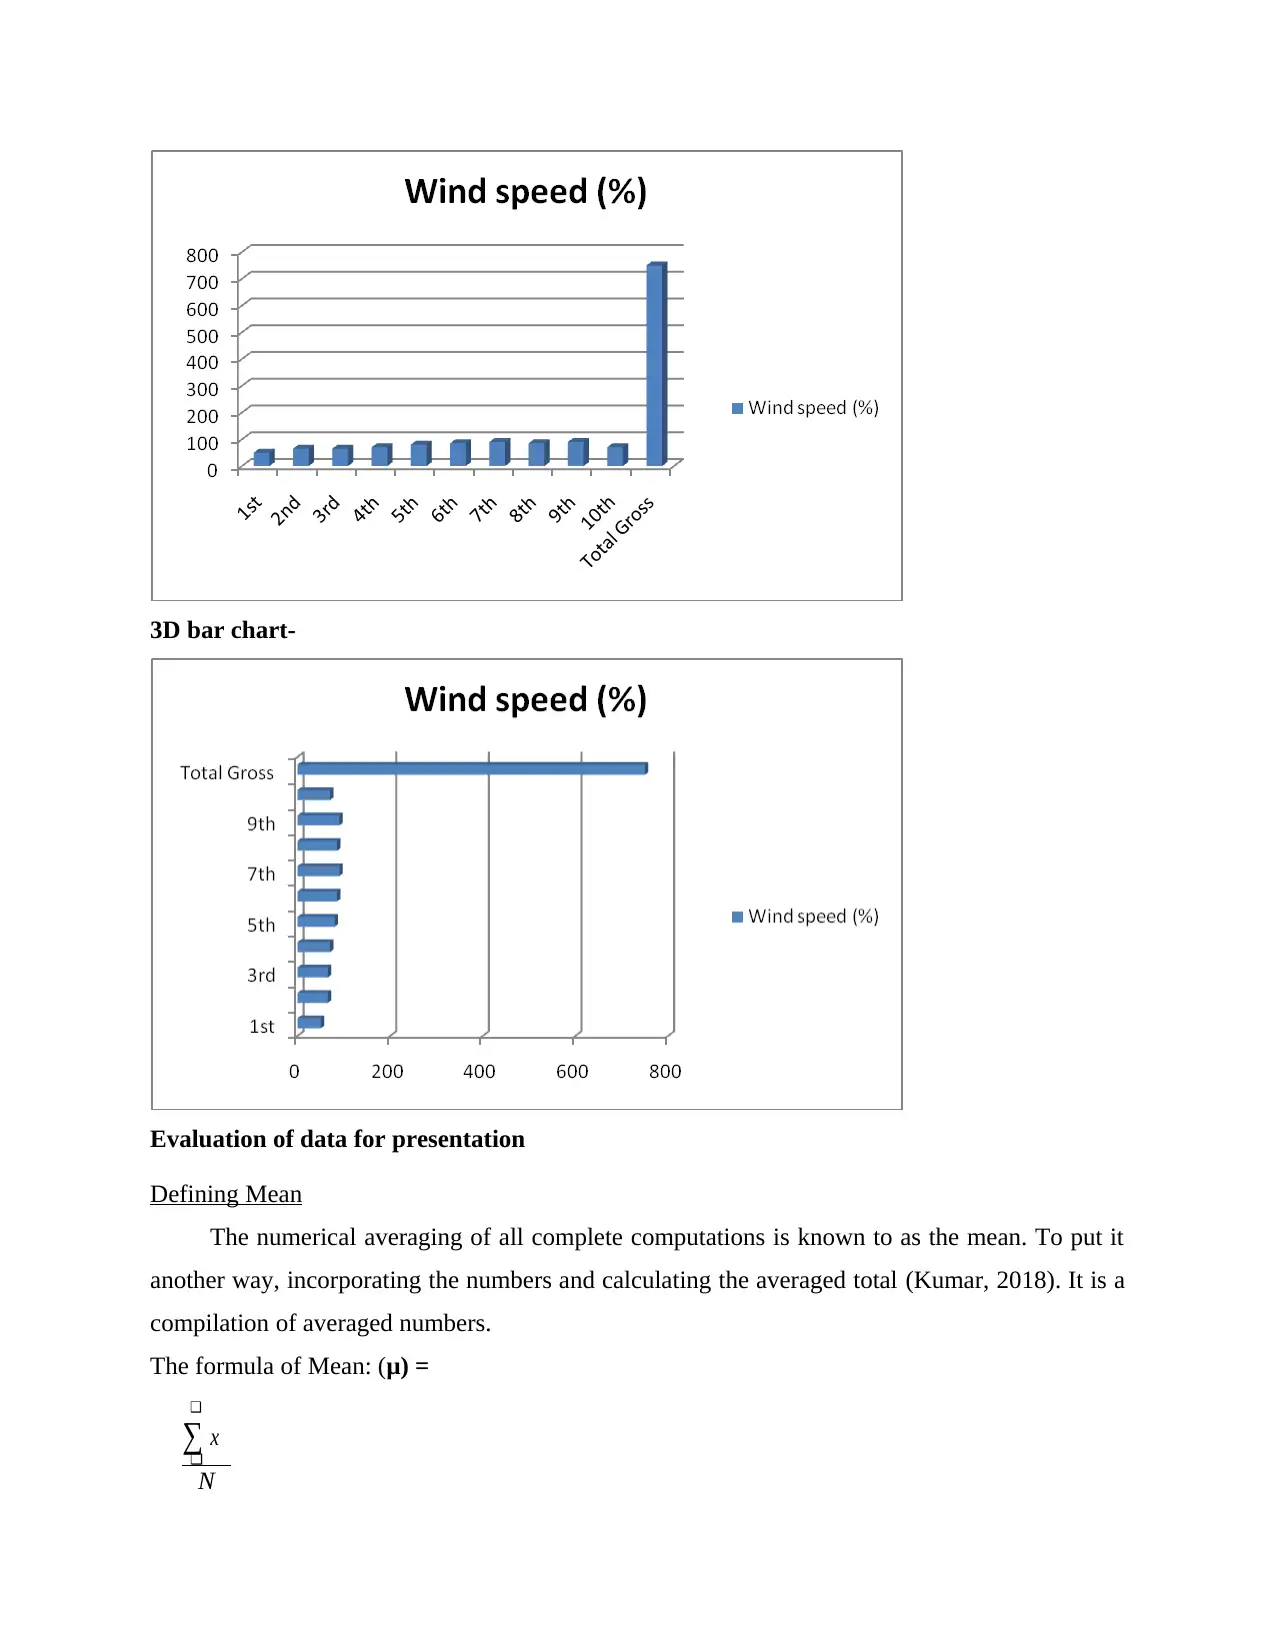
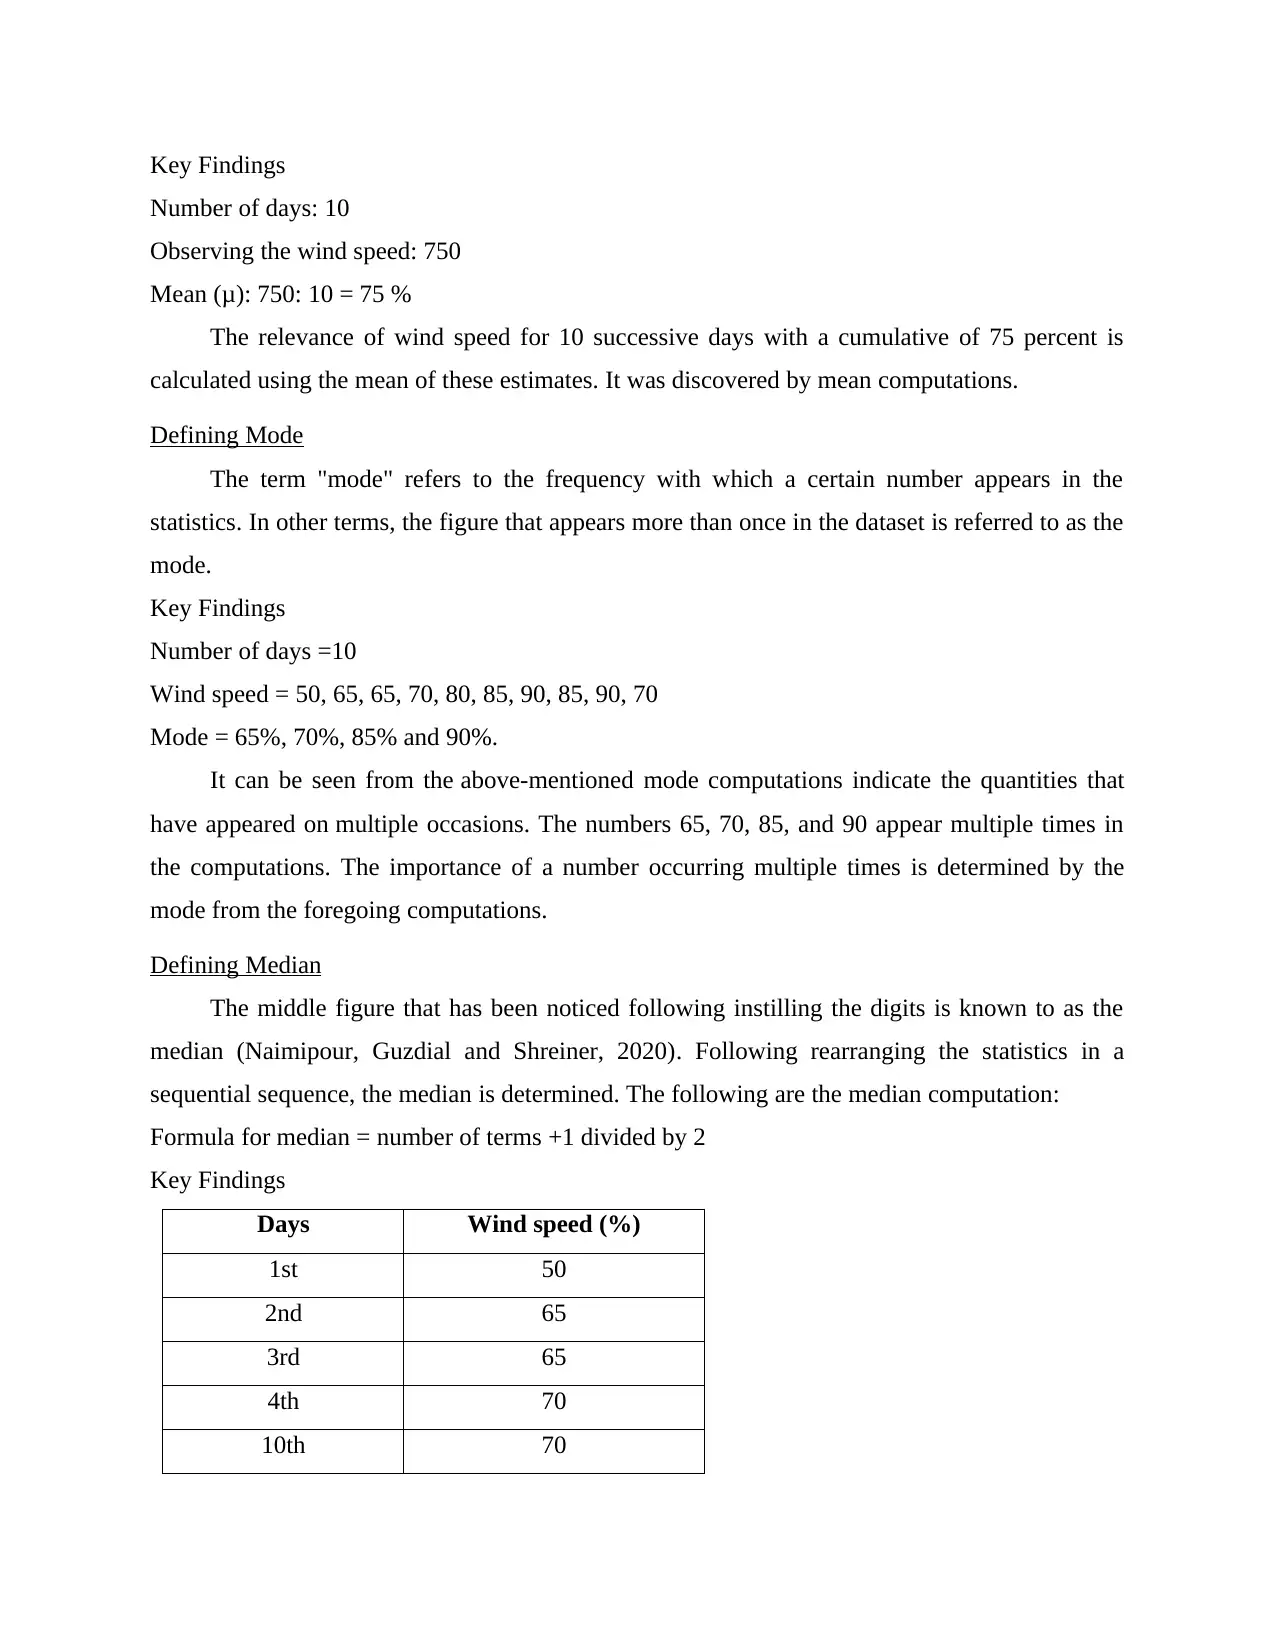
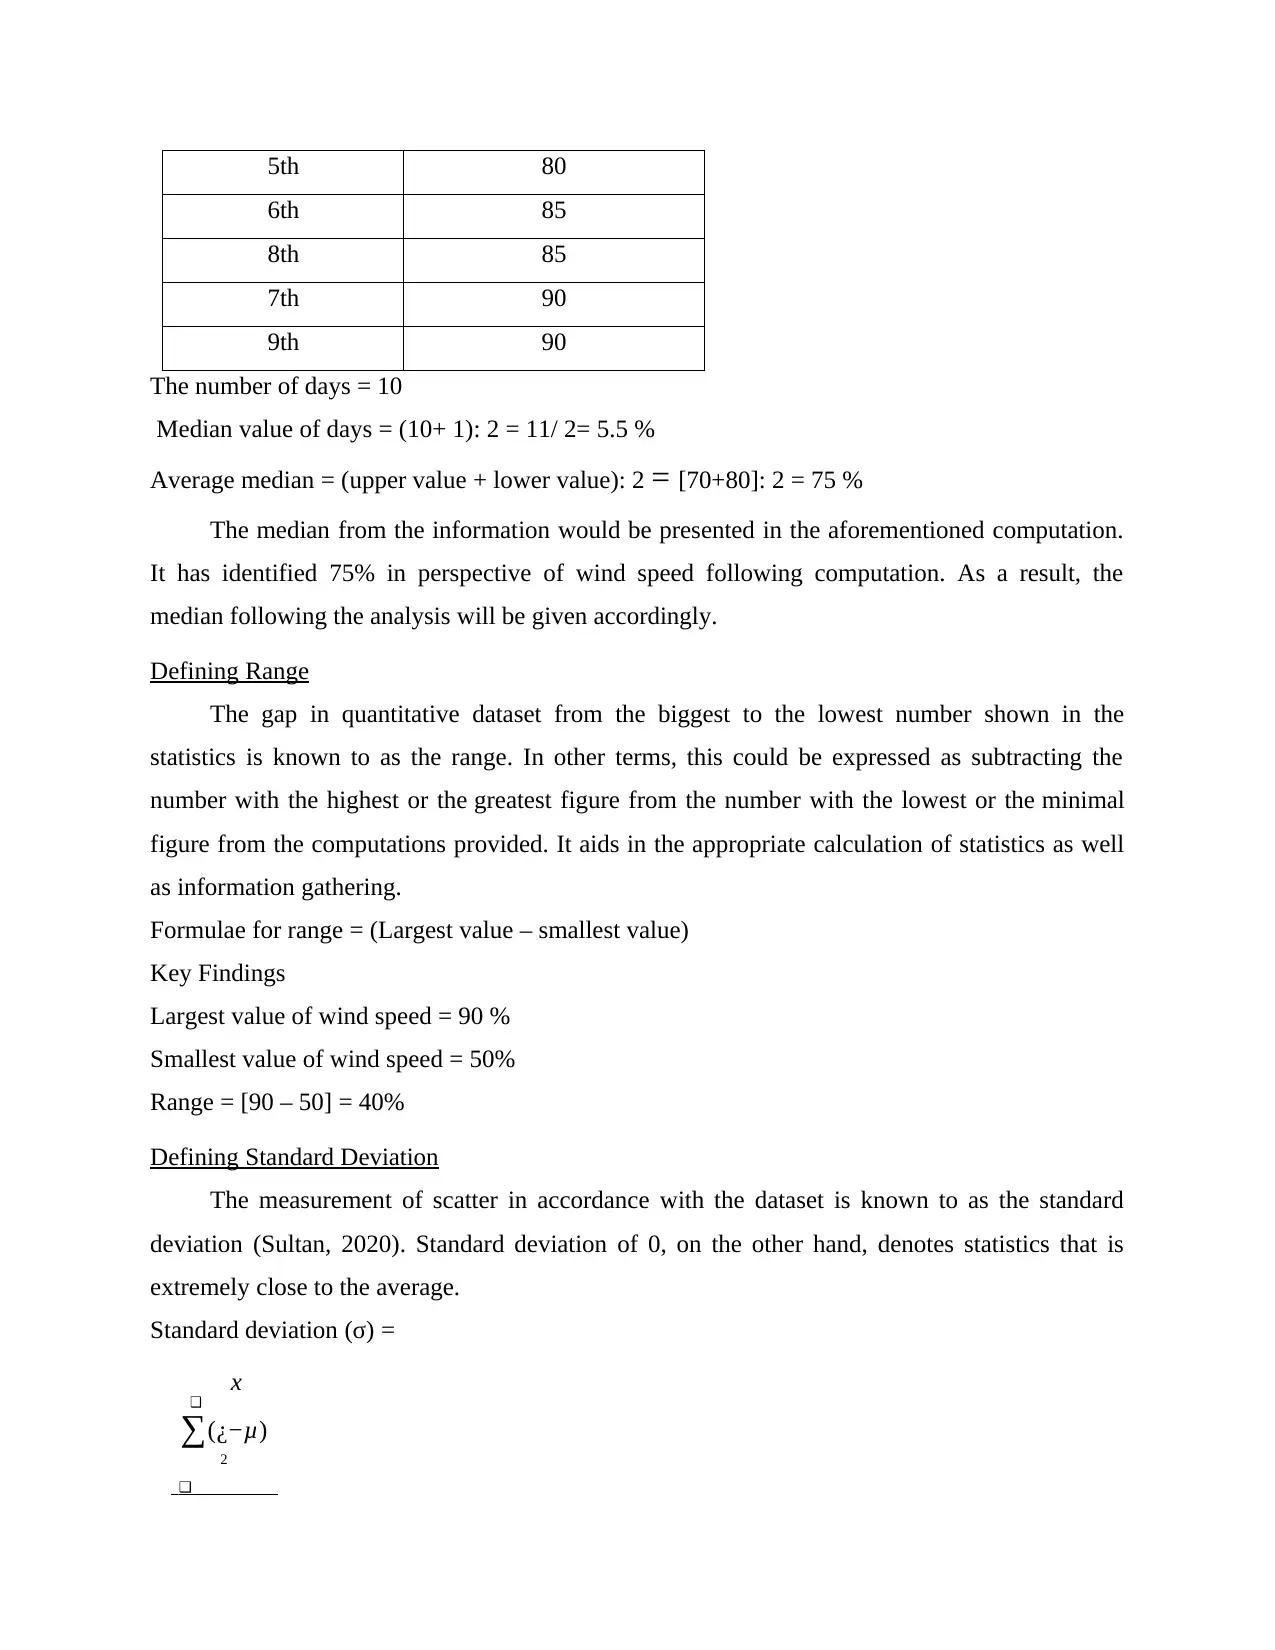
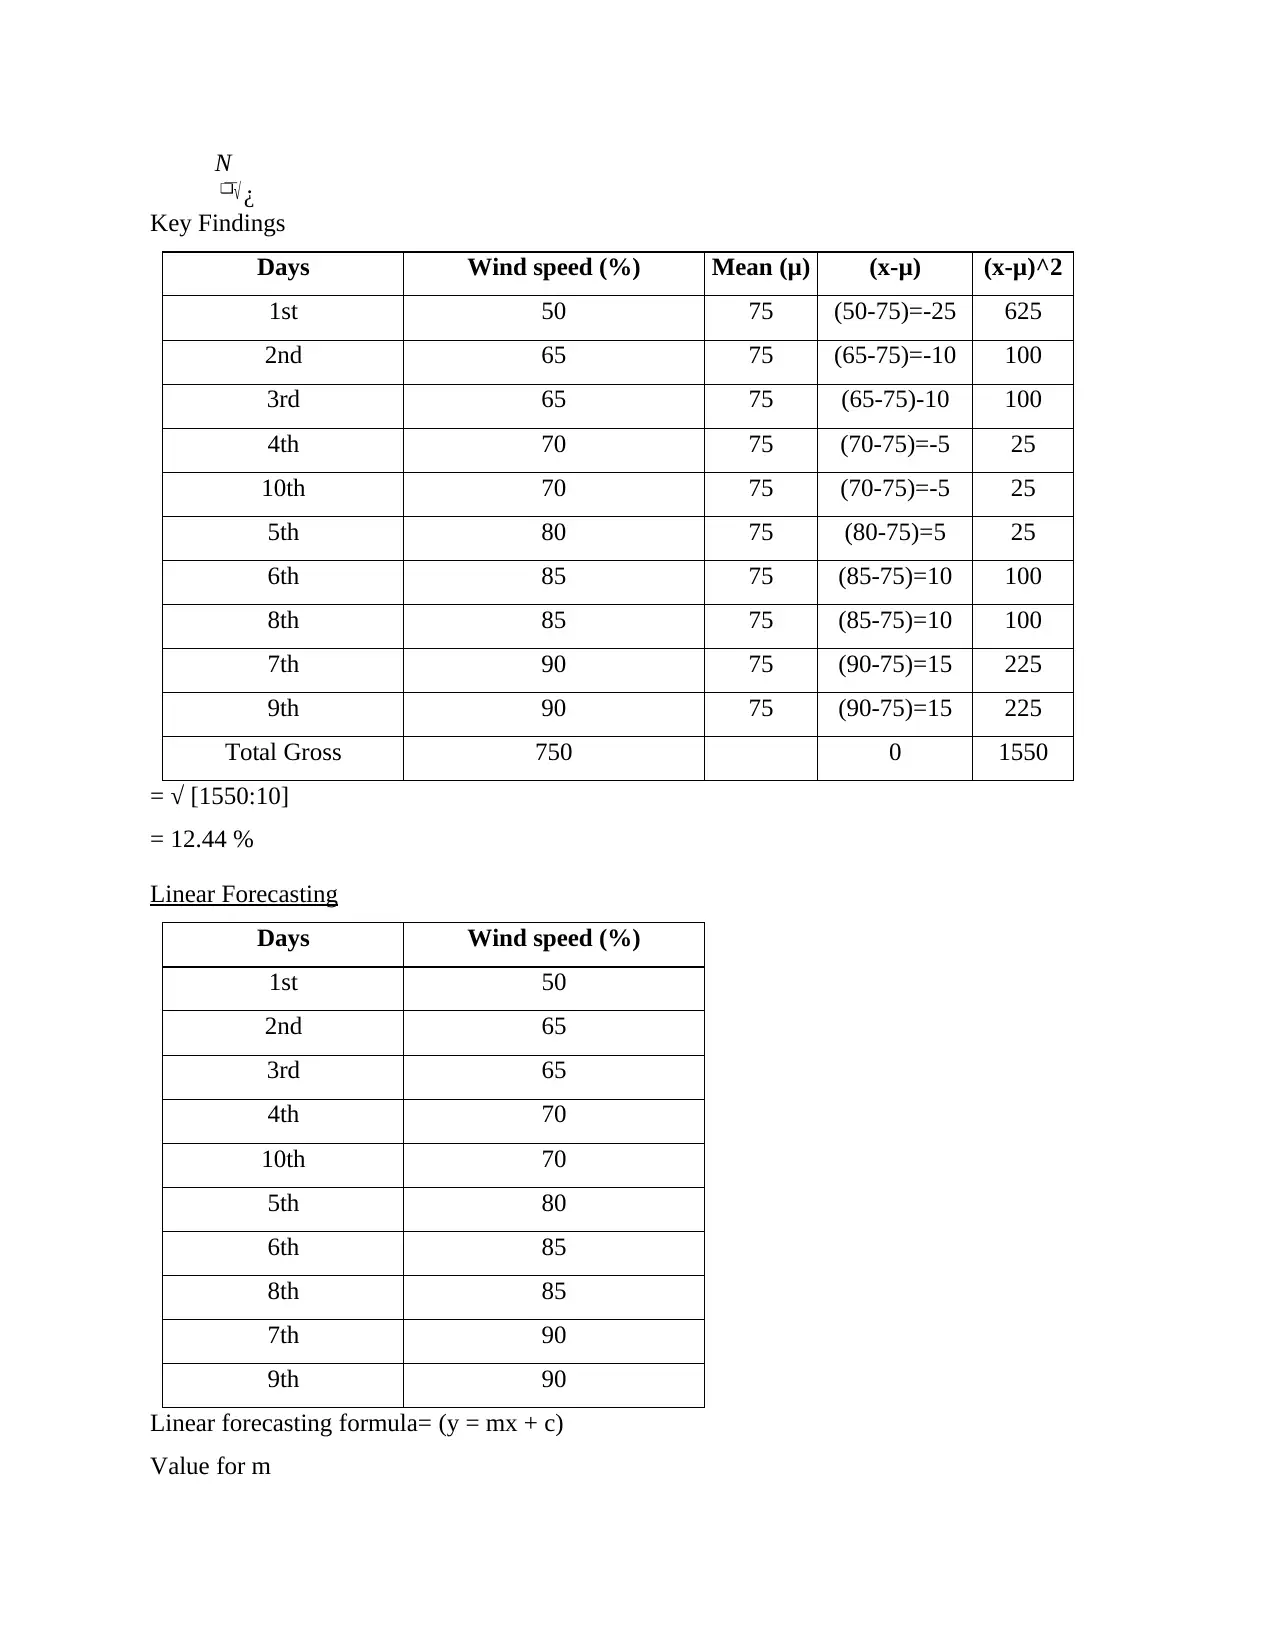
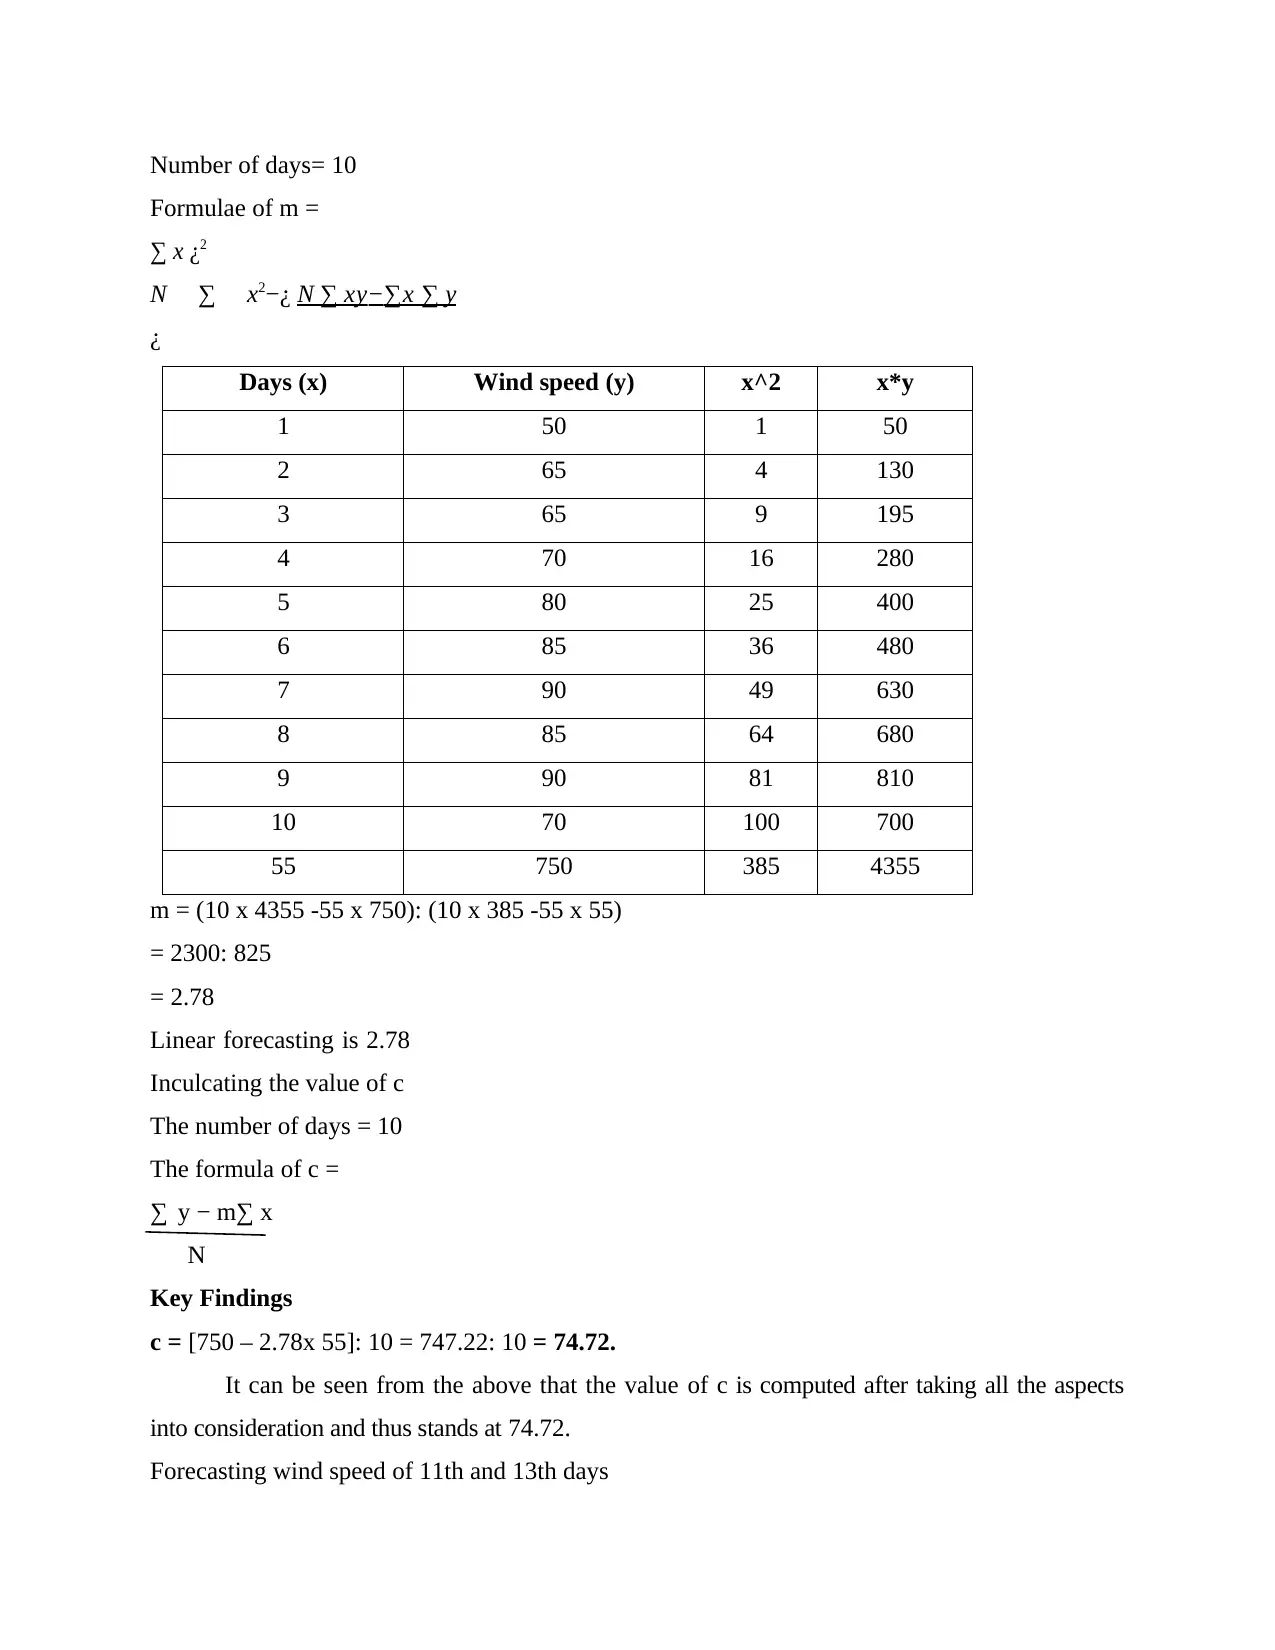
This report presents a quantitative analysis of wind speed data, detailing the calculation of statistical measures such as mean, mode, median, range, and standard deviation. The analysis includes a dataset of wind speeds recorded over ten days, with calculations and interpretations provided for each statistical measure. The report further explores linear forecasting techniques to predict wind speeds for the 11th and 13th days, utilizing a linear forecasting formula and deriving values for 'm' and 'c'. The study concludes by summarizing the various computations and their significance in understanding and predicting wind speed patterns. Desklib offers a wealth of similar solved assignments to aid students in their studies.
tabler-icon-diamond-filled.svg

Contribute Materials

Your contribution can guide someone’s learning journey. Share your documents today.
Document Page
Numeracy and data
analysis
tabler-icon-diamond-filled.svg

Secure Best Marks with AI Grader

Need help grading? Try our AI Grader for instant feedback on your assignments.
Document Page
Contents
Contents...........................................................................................................................................2
INTRODUCTION...........................................................................................................................3
MAIN BODY..................................................................................................................................3
Evaluating data as per the wind speed.........................................................................................3
Presentation of data......................................................................................................................3
Defining Mean.............................................................................................................................4
Defining Mode.............................................................................................................................5
Defining Median..........................................................................................................................5
Defining Range............................................................................................................................6
Defining Standard Deviation.......................................................................................................6
Linear Forecasting.......................................................................................................................7
CONCLUSION................................................................................................................................9
REFERENCES..............................................................................................................................10
Document Page
INTRODUCTION
In this study, the quantitative computation would explain how to calculate mean, mode, and
median (FitzSimons and Boistrup, 2017). It will show how to calculate the standard deviation,
range, as well as other wind speed estimates.
MAIN BODY
Evaluating data as per the wind speed
Days Wind speed
1st 50
2nd 65
3rd 65
4th 70
5th 80
6th 85
7th 90
8th 85
9th 90
10th 70
Total Gross 750
Presentation of data
3D column chart-
Document Page
3D bar chart-
Evaluation of data for presentation
Defining Mean
The numerical averaging of all complete computations is known to as the mean. To put it
another way, incorporating the numbers and calculating the averaged total (Kumar, 2018). It is a
compilation of averaged numbers.
The formula of Mean: (μ) =

x

N
tabler-icon-diamond-filled.svg

Secure Best Marks with AI Grader

Need help grading? Try our AI Grader for instant feedback on your assignments.
Document Page
Key Findings
Number of days: 10
Observing the wind speed: 750
Mean (μ): 750: 10 = 75 %
The relevance of wind speed for 10 successive days with a cumulative of 75 percent is
calculated using the mean of these estimates. It was discovered by mean computations.
Defining Mode
The term "mode" refers to the frequency with which a certain number appears in the
statistics. In other terms, the figure that appears more than once in the dataset is referred to as the
mode.
Key Findings
Number of days =10
Wind speed = 50, 65, 65, 70, 80, 85, 90, 85, 90, 70
Mode = 65%, 70%, 85% and 90%.
It can be seen from the above-mentioned mode computations indicate the quantities that
have appeared on multiple occasions. The numbers 65, 70, 85, and 90 appear multiple times in
the computations. The importance of a number occurring multiple times is determined by the
mode from the foregoing computations.
Defining Median
The middle figure that has been noticed following instilling the digits is known to as the
median (Naimipour, Guzdial and Shreiner, 2020). Following rearranging the statistics in a
sequential sequence, the median is determined. The following are the median computation:
Formula for median = number of terms +1 divided by 2
Key Findings
Days Wind speed (%)
1st 50
2nd 65
3rd 65
4th 70
10th 70
Document Page
5th 80
6th 85
8th 85
7th 90
9th 90
The number of days = 10
Median value of days = (10+ 1): 2 = 11/ 2= 5.5 %
Average median = (upper value + lower value): 2 = [70+80]: 2 = 75 %
The median from the information would be presented in the aforementioned computation.
It has identified 75% in perspective of wind speed following computation. As a result, the
median following the analysis will be given accordingly.
Defining Range
The gap in quantitative dataset from the biggest to the lowest number shown in the
statistics is known to as the range. In other terms, this could be expressed as subtracting the
number with the highest or the greatest figure from the number with the lowest or the minimal
figure from the computations provided. It aids in the appropriate calculation of statistics as well
as information gathering.
Formulae for range = (Largest value smallest value)
Key Findings
Largest value of wind speed = 90 %
Smallest value of wind speed = 50%
Range = [90 50] = 40%
Defining Standard Deviation
The measurement of scatter in accordance with the dataset is known to as the standard
deviation (Sultan, 2020). Standard deviation of 0, on the other hand, denotes statistics that is
extremely close to the average.
Standard deviation (σ) =
x

(¿−μ)
2
Document Page
N
¿
Key Findings
Days Wind speed (%) Mean (μ) (x-μ) (x-μ)^2
1st 50 75 (50-75)=-25 625
2nd 65 75 (65-75)=-10 100
3rd 65 75 (65-75)-10 100
4th 70 75 (70-75)=-5 25
10th 70 75 (70-75)=-5 25
5th 80 75 (80-75)=5 25
6th 85 75 (85-75)=10 100
8th 85 75 (85-75)=10 100
7th 90 75 (90-75)=15 225
9th 90 75 (90-75)=15 225
Total Gross 750 0 1550
= √ [1550:10]
= 12.44 %
Linear Forecasting
Days Wind speed (%)
1st 50
2nd 65
3rd 65
4th 70
10th 70
5th 80
6th 85
8th 85
7th 90
9th 90
Linear forecasting formula= (y = mx + c)
Value for m
tabler-icon-diamond-filled.svg

Paraphrase This Document

Need a fresh take? Get an instant paraphrase of this document with our AI Paraphraser
Document Page
Number of days= 10
Formulae of m =
x ¿ 2
N x2−¿ N xy∑x y
¿
Days (x) Wind speed (y) x^2 x*y
1 50 1 50
2 65 4 130
3 65 9 195
4 70 16 280
5 80 25 400
6 85 36 480
7 90 49 630
8 85 64 680
9 90 81 810
10 70 100 700
55 750 385 4355
m = (10 x 4355 -55 x 750): (10 x 385 -55 x 55)
= 2300: 825
= 2.78
Linear forecasting is 2.78
Inculcating the value of c
The number of days = 10
The formula of c =
y − m∑ x
N
Key Findings
c = [750 – 2.78x 55]: 10 = 747.22: 10 = 74.72.
It can be seen from the above that the value of c is computed after taking all the aspects
into consideration and thus stands at 74.72.
Forecasting wind speed of 11th and 13th days
Document Page
Computing the values of m and c as per the linear forecasting
Linear forecasting formula = (y = 2.78 x + 74.72)
On the 11th day, the value of x is 11
Forecasting of wind speed of 11th day=
y = 2.78 x 11+ 74.72
y = 105.3 %
13th day, the value of x is 13
Forecasting of wind speed of 13th day=
y = 2.78 x 13+ 74.72
y = 110.86 %
CONCLUSION
In this precise study, the quantitative computation has represented many aspects
including mean, mode, and median. It also shows how to calculate the standard deviation, range,
and other computations for determining wind speed for the 11th and the 13th day.
Document Page
REFERENCES
Books and journals
FitzSimons, G. E. and Boistrup, L. B., 2017. In the workplace mathematics does not announce
itself: Towards overcoming the hiatus between mathematics education and work.
Educational Studies in Mathematics. 95(3). pp.329-349.
Kumar, A., 2018. Implementation core Business Intelligence System using modern IT
Development Practices (Agile & DevOps). International Journal of Management, IT
and Engineering. 8(9). pp.444-464.
Naimipour, B., Guzdial, M. and Shreiner, T., 2020, October. Engaging Pre-Service Teachers in
Front-End Design: Developing Technology for a Social Studies Classroom. In 2020
IEEE Frontiers in Education Conference (FIE) (pp. 1-9). IEEE.
Sultan, J.B., 2020. Characteristics of remedial students in learning numeracy and programs that
enhance the achievement.
chevron_up_icon
1 out of 10
circle_padding
hide_on_mobile
zoom_out_icon
logo.png

Your All-in-One AI-Powered Toolkit for Academic Success.

Available 24*7 on WhatsApp / Email

[object Object]