Data Analysis and Forecasting Report: Wind Speed in Manchester City

Verified

Added on  2021/02/20

|10
|1446
|142
Report
AI Summary
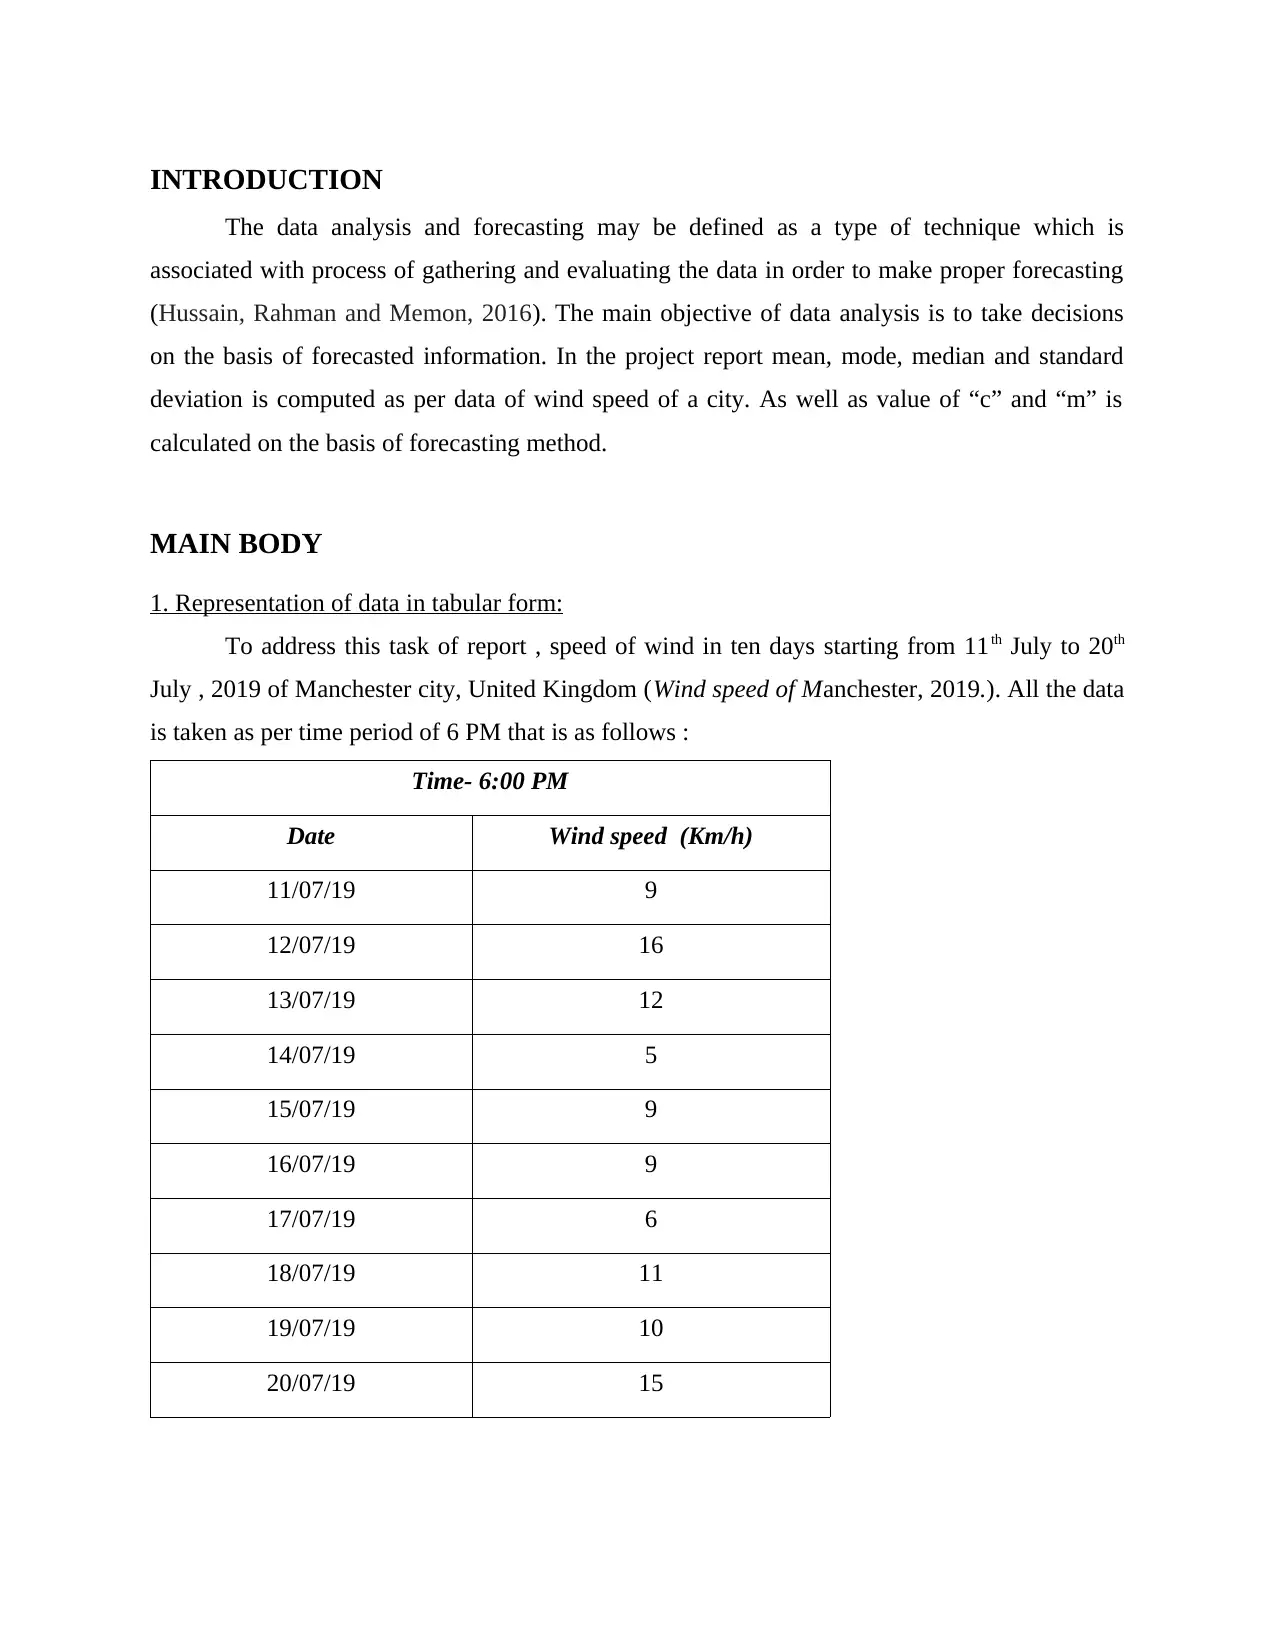
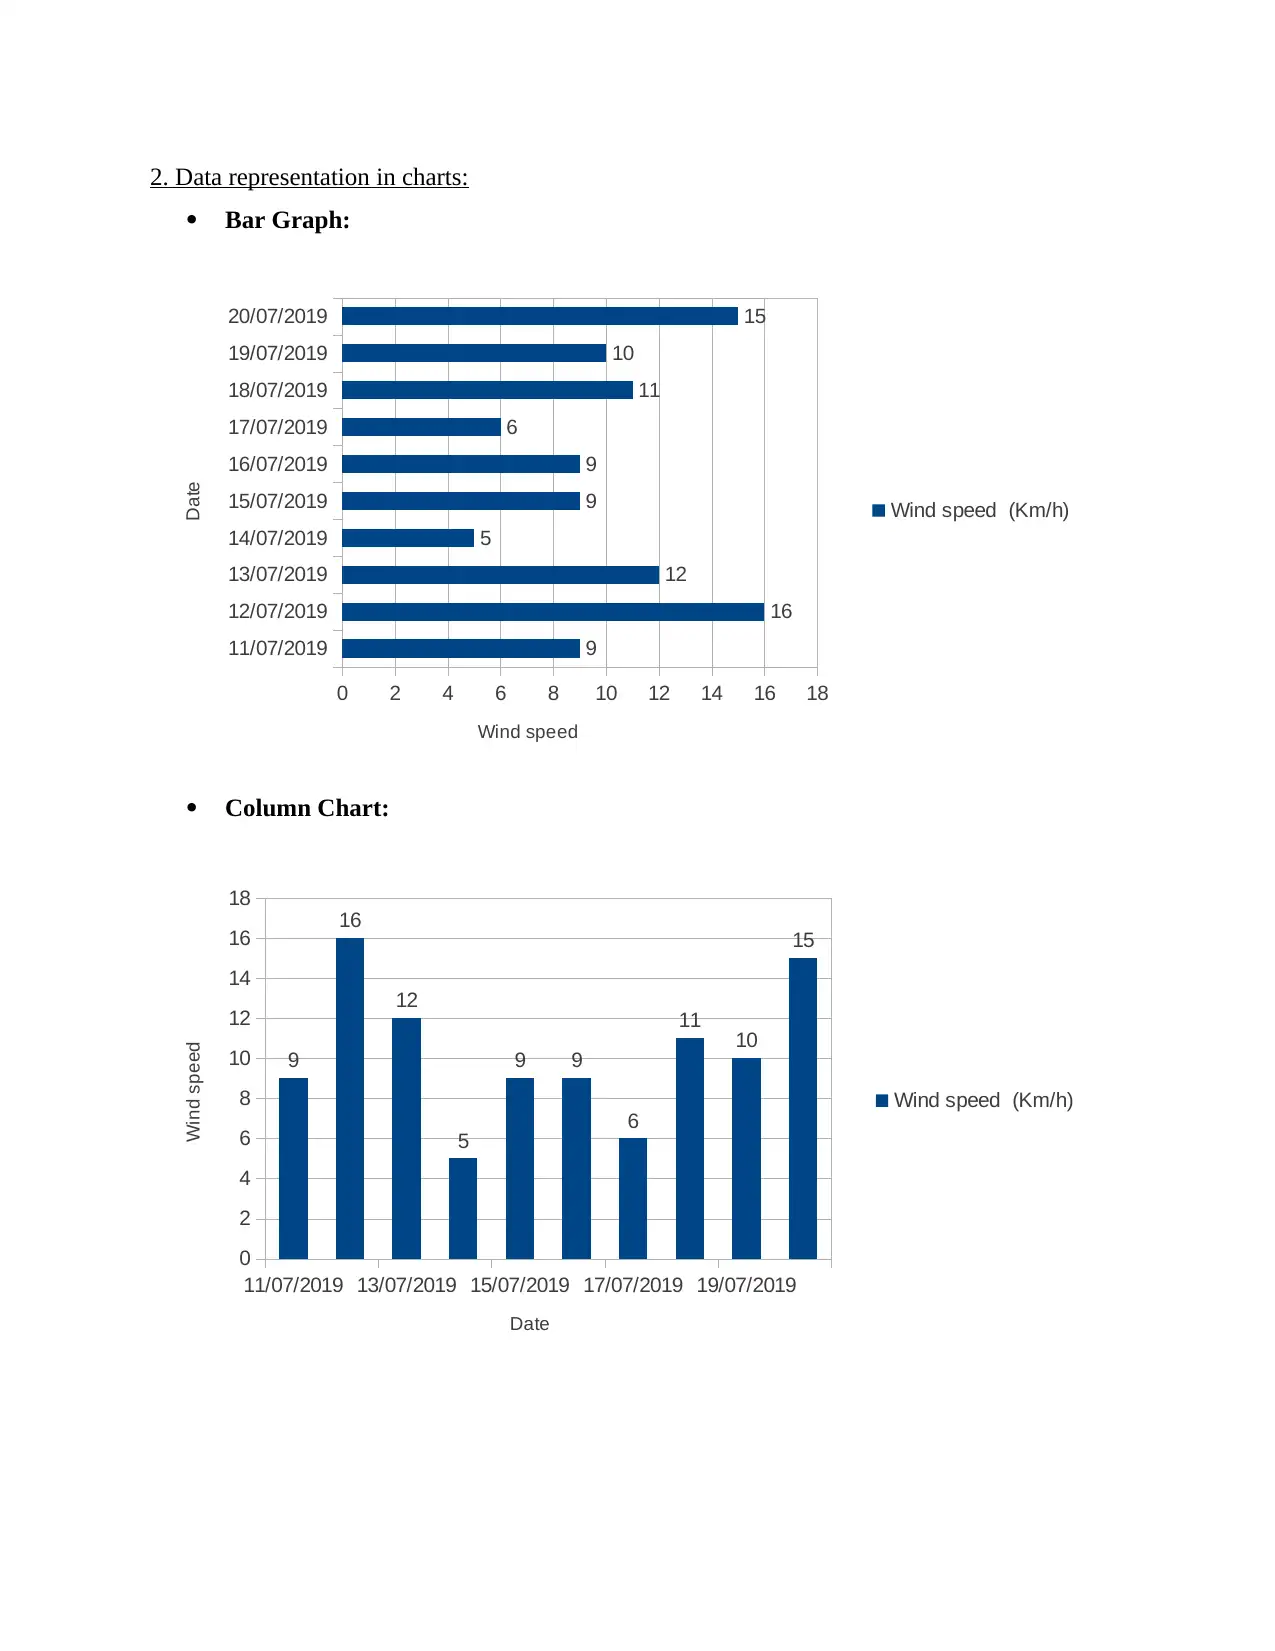
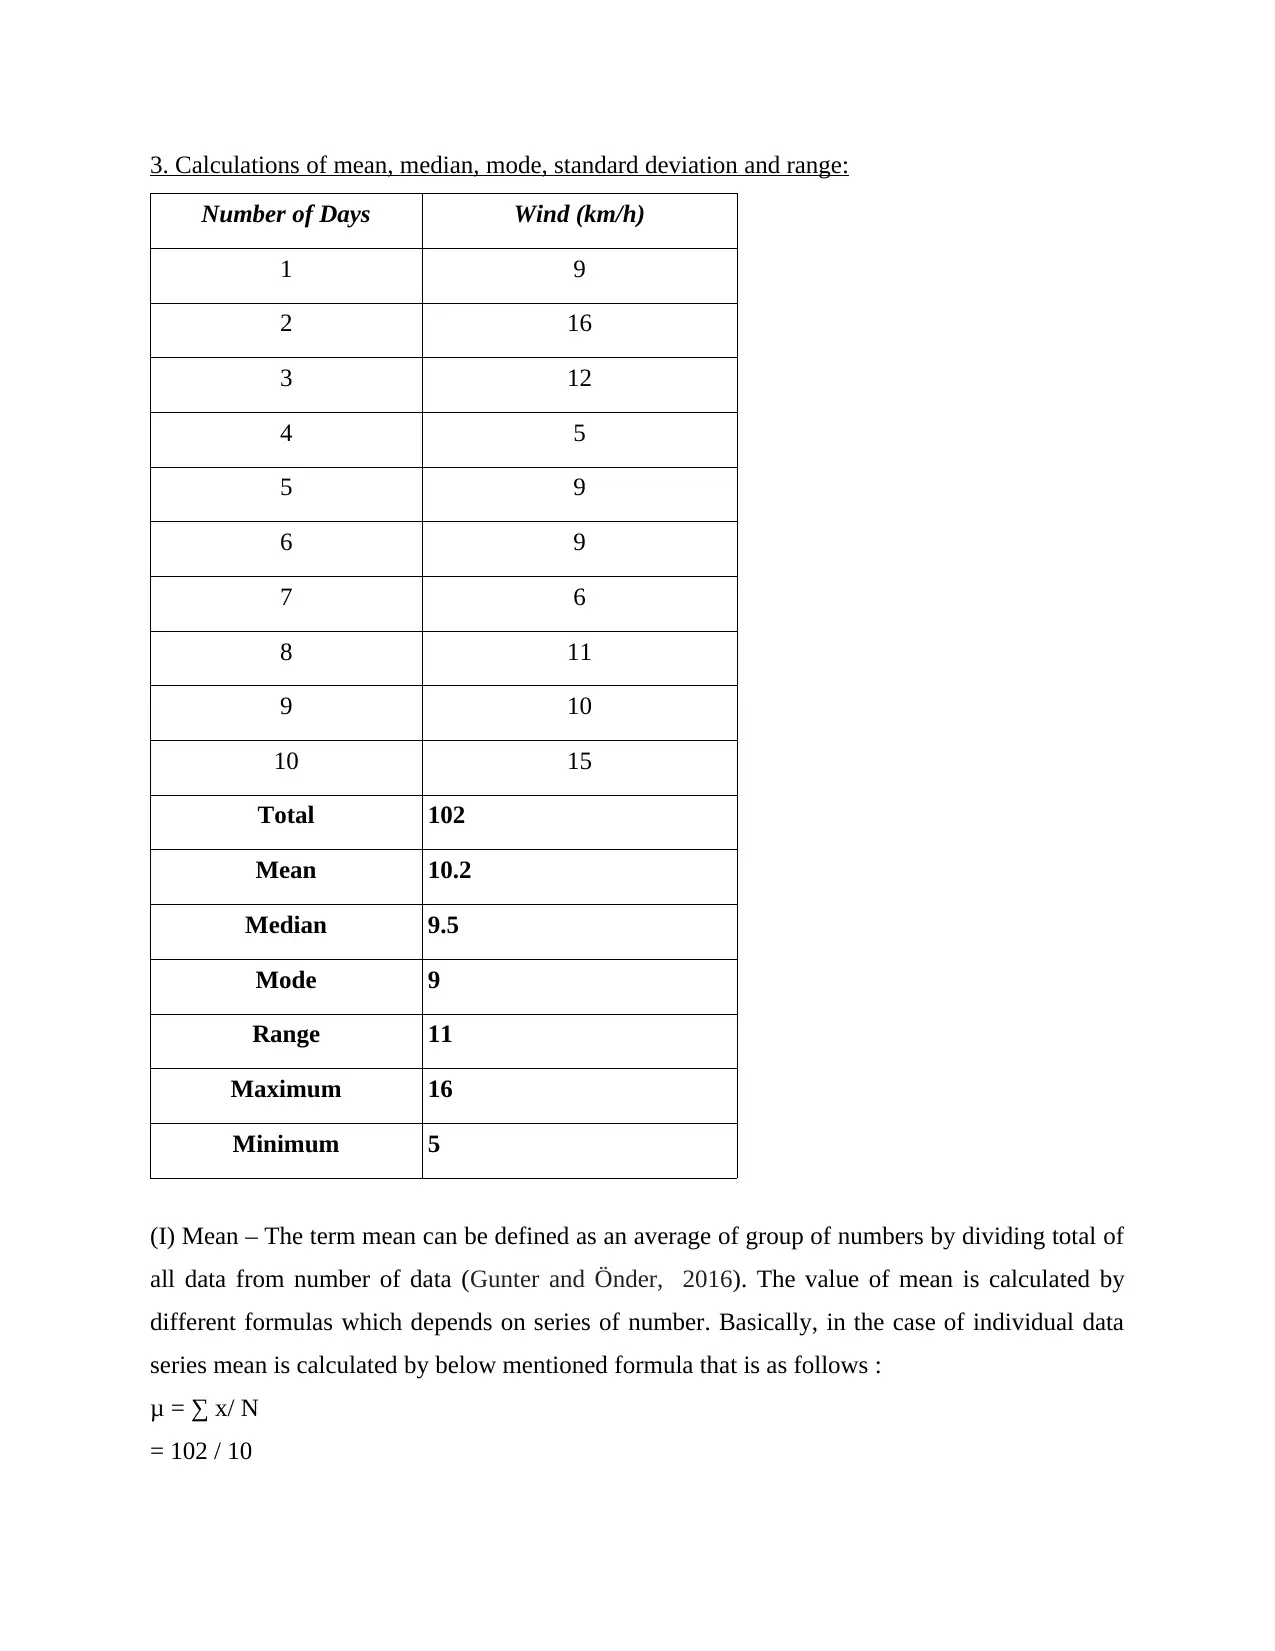
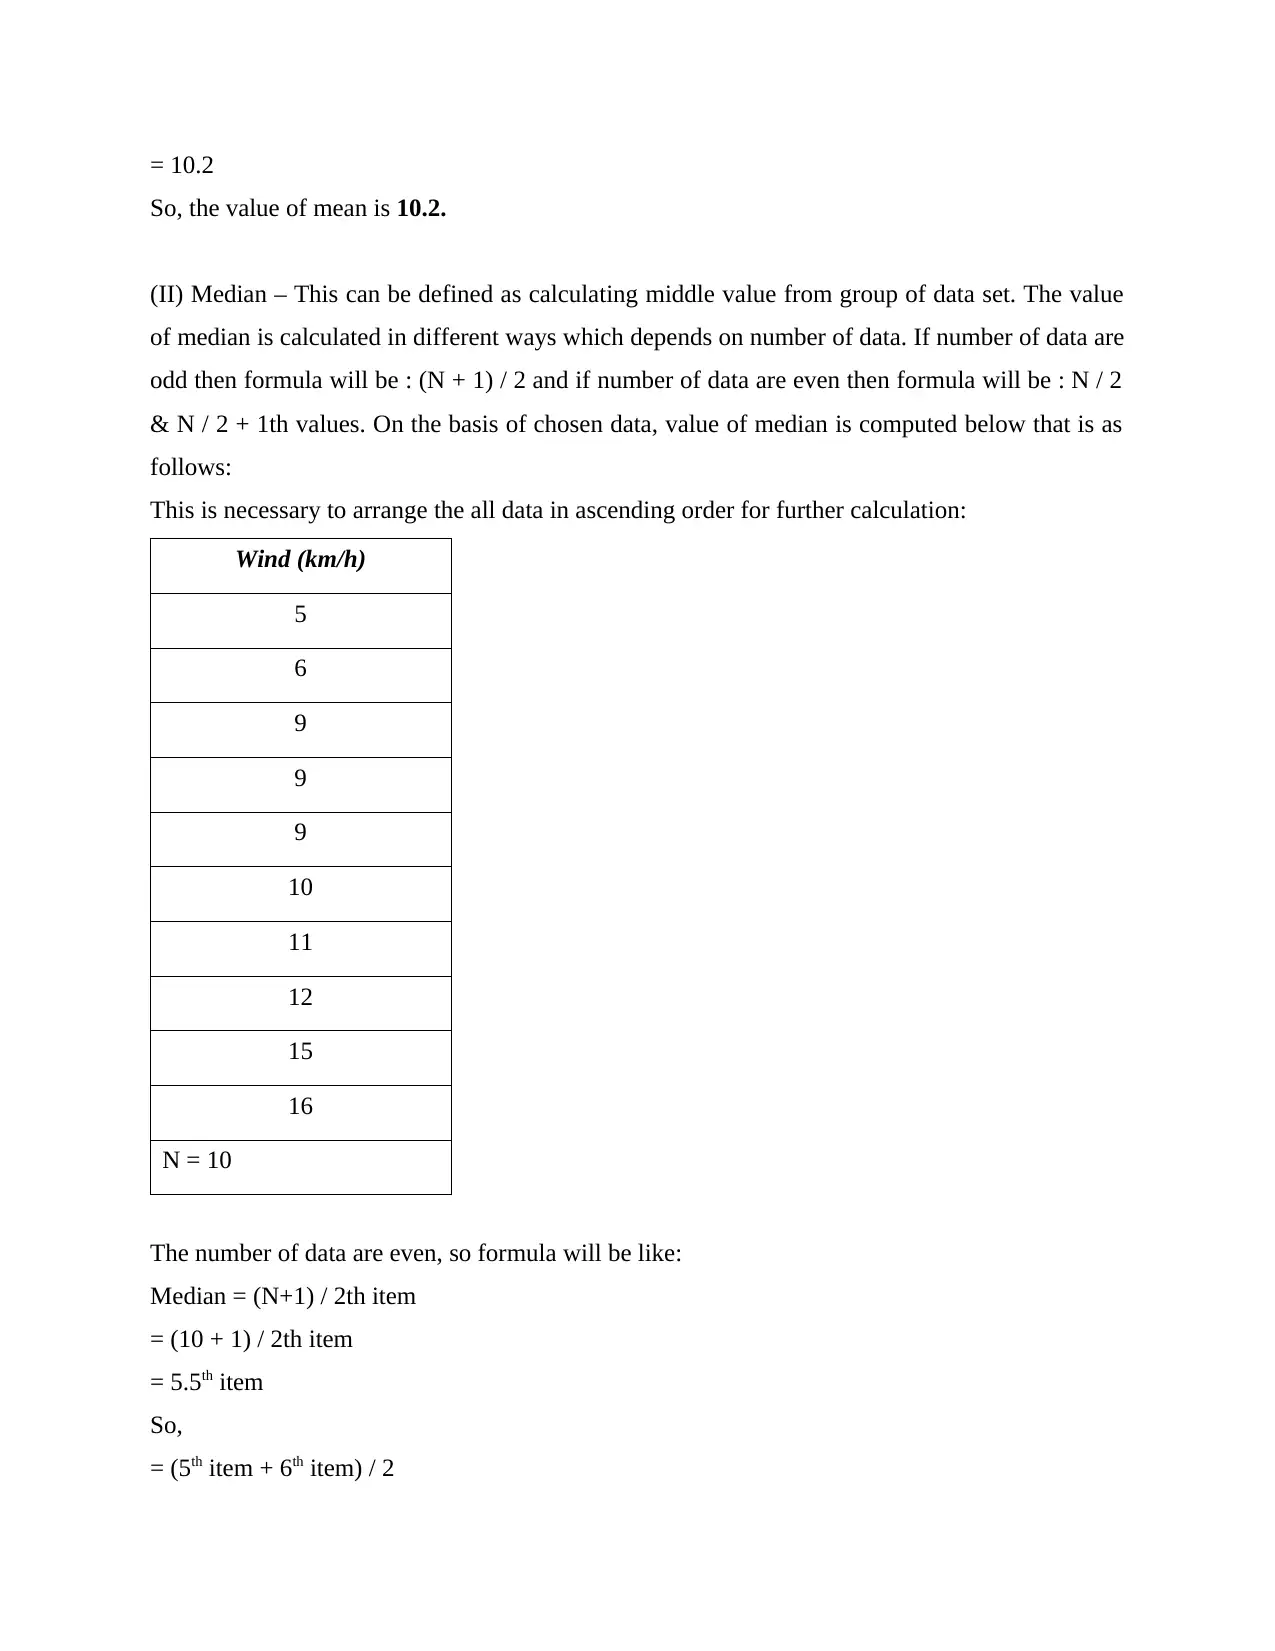
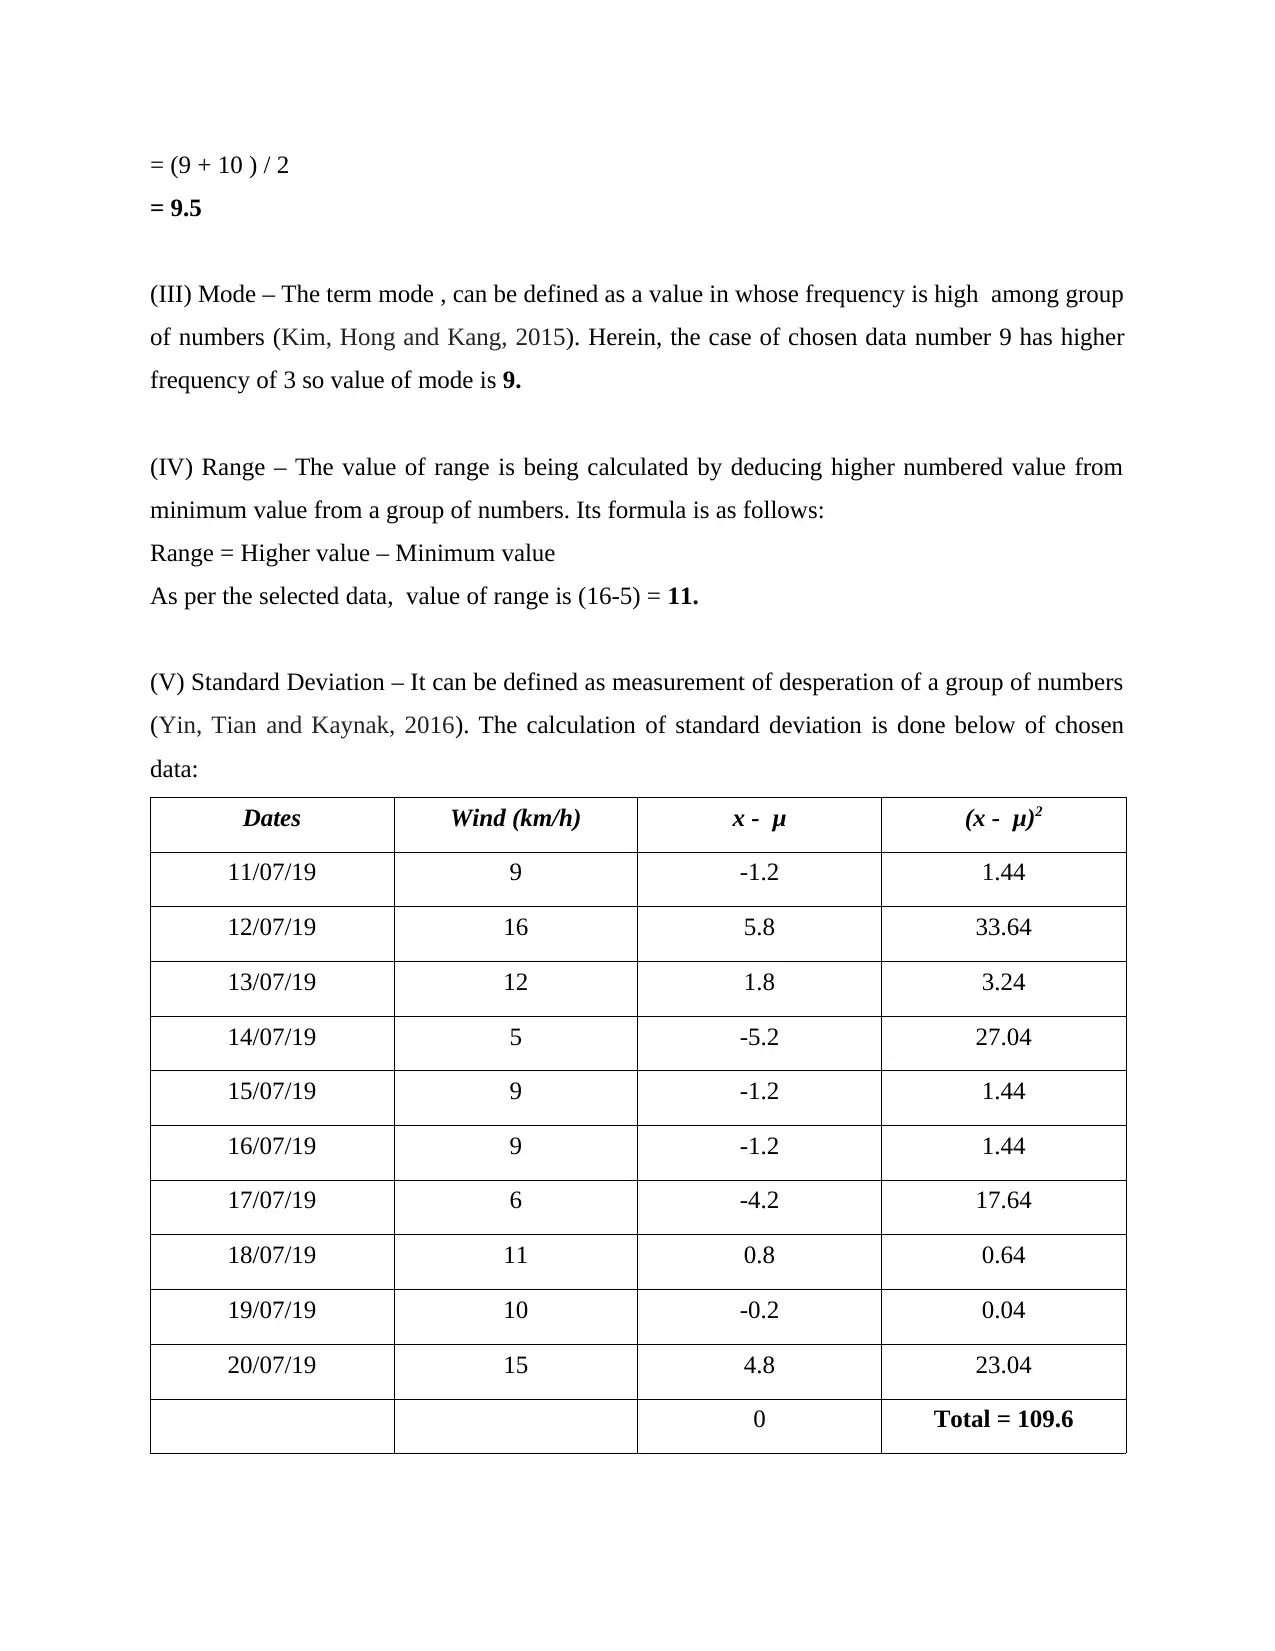
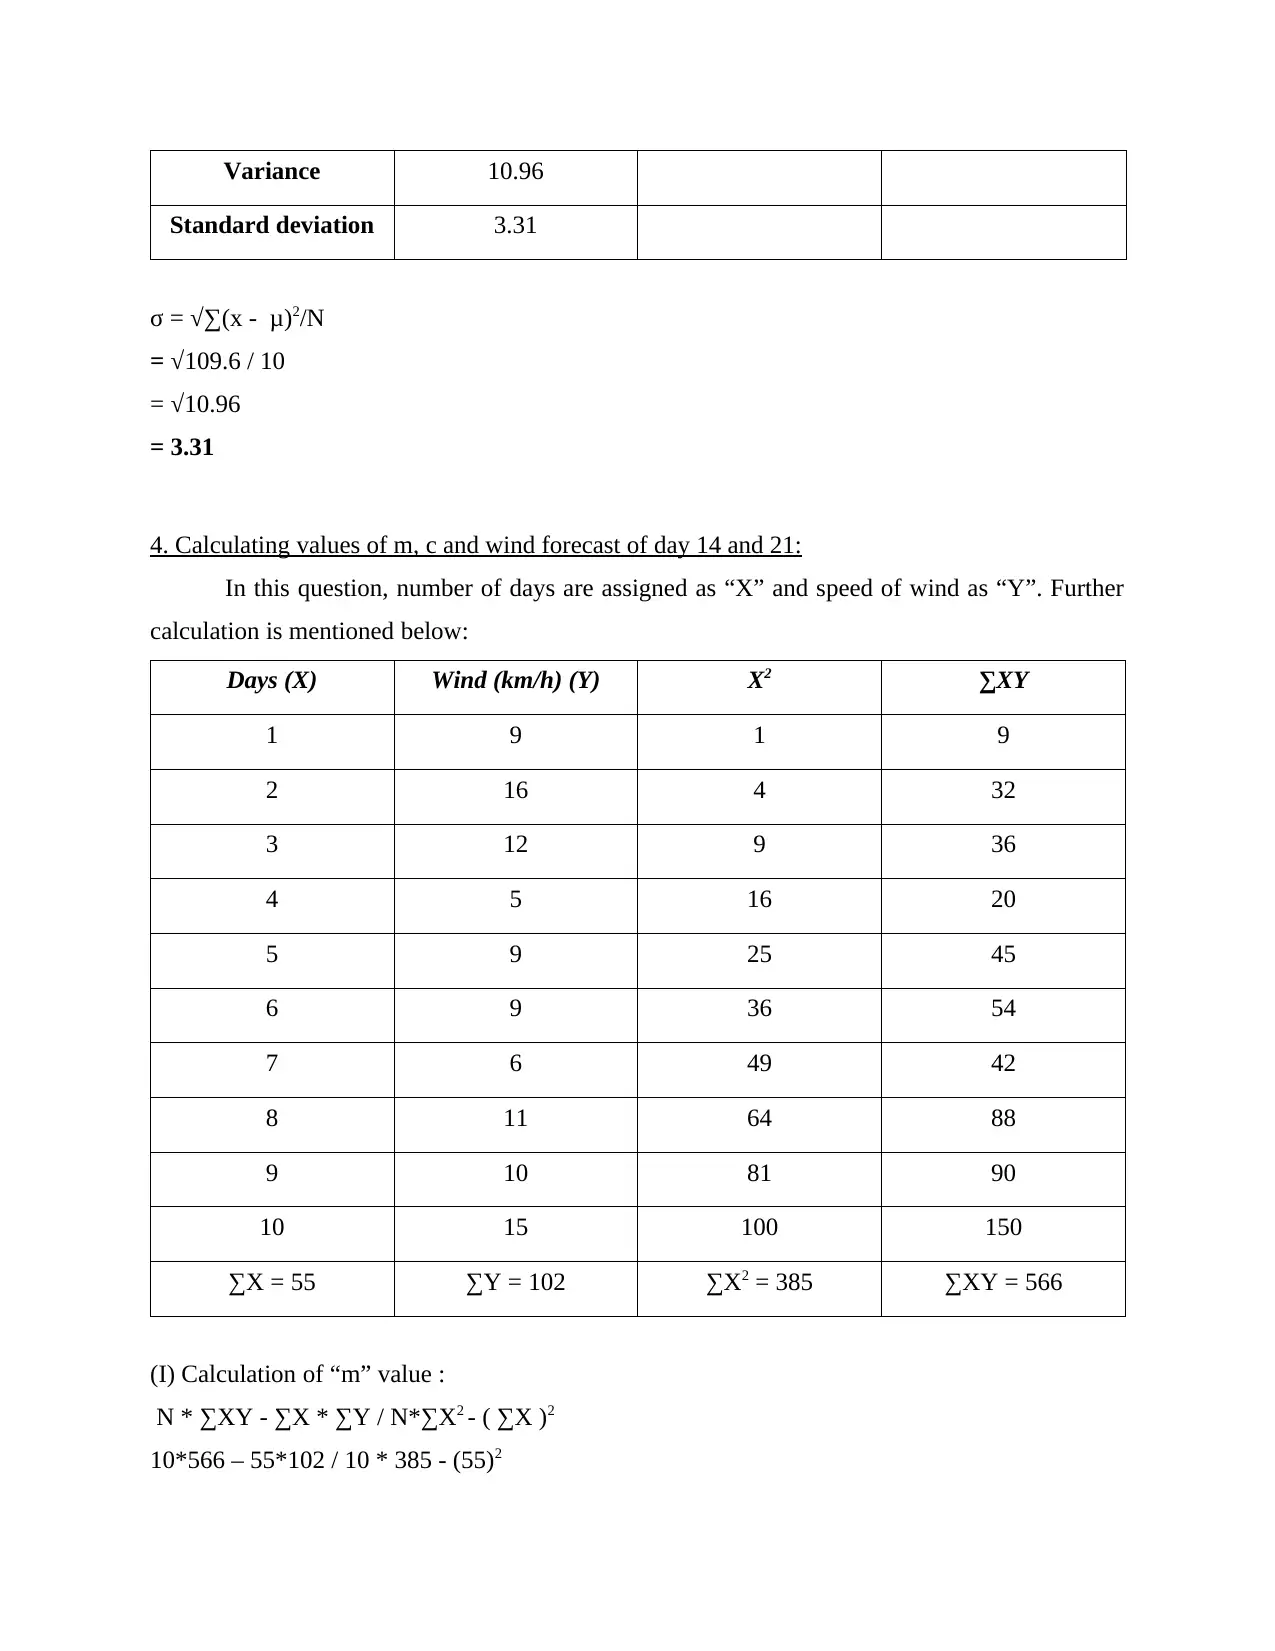
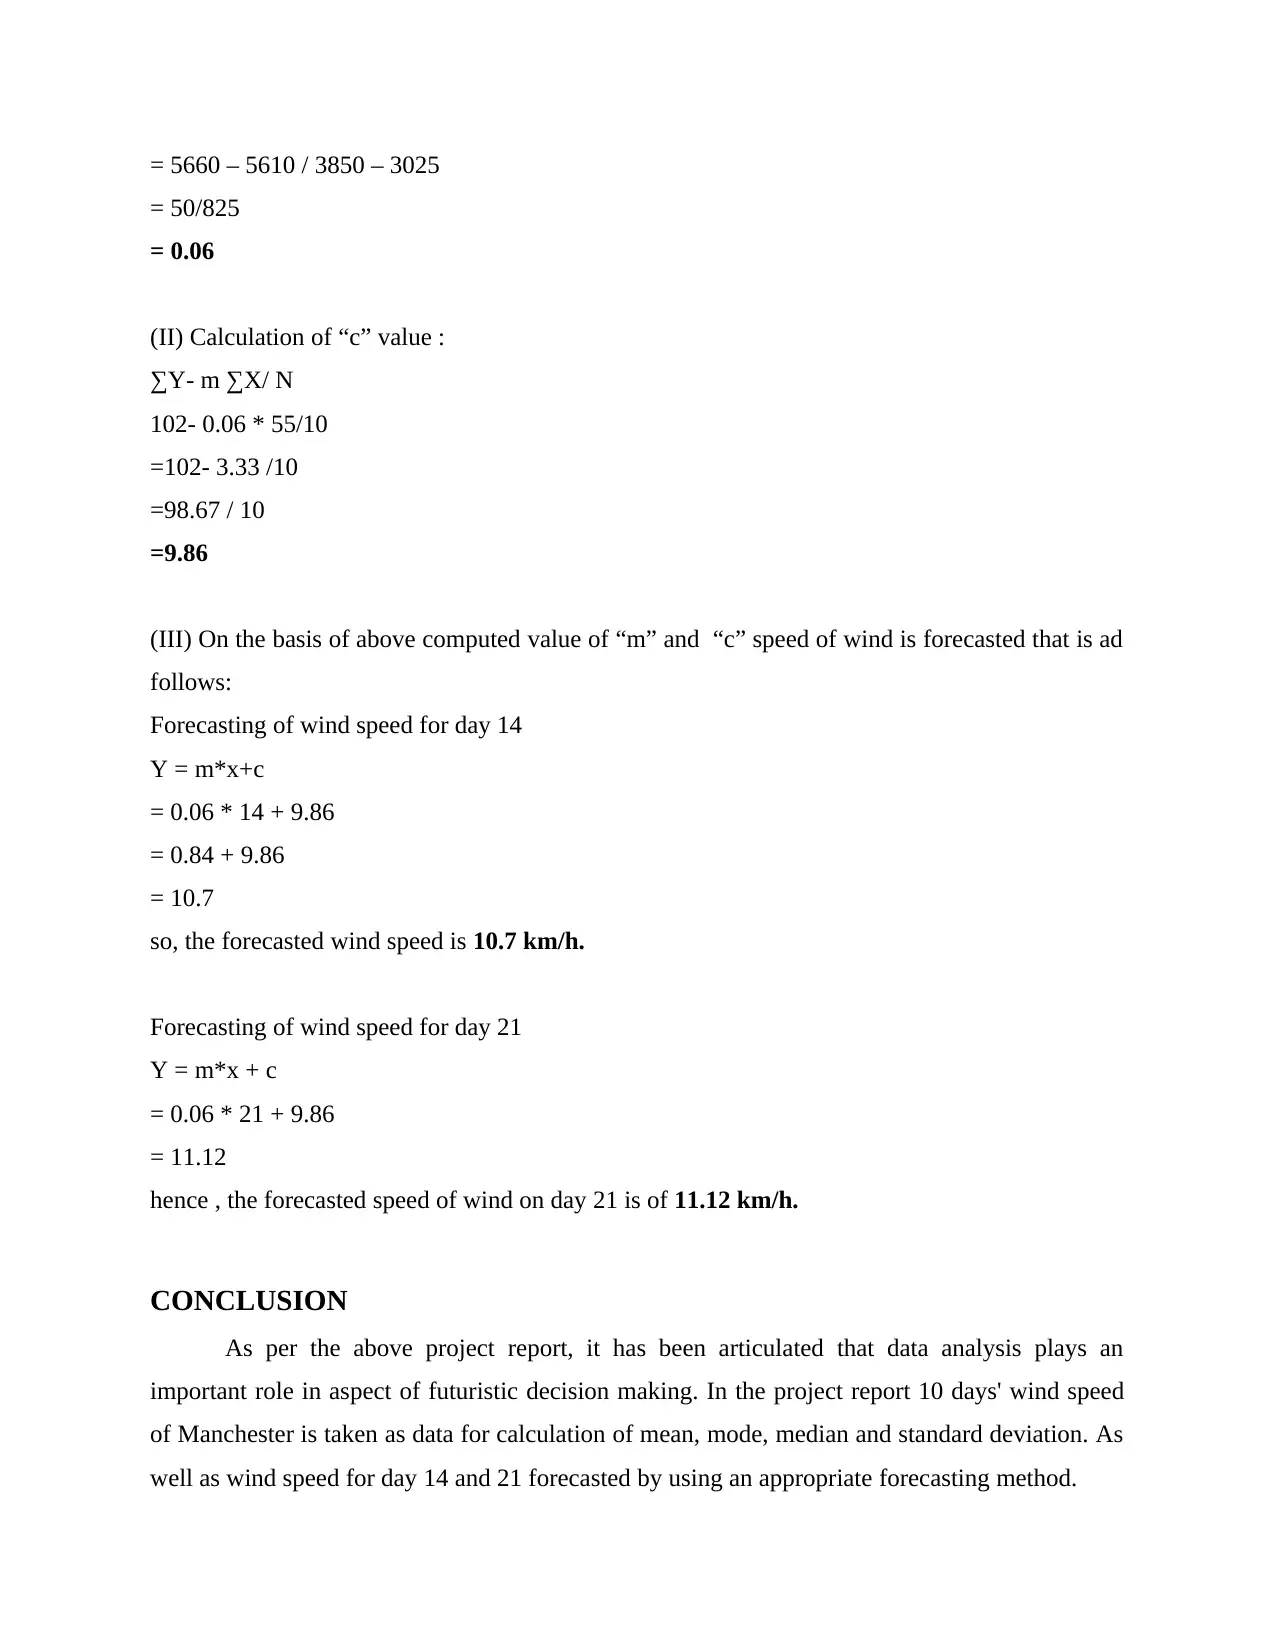
This report provides a comprehensive analysis of wind speed data collected from Manchester, UK, over a ten-day period. The report begins with a tabular representation of the data, followed by visual representations using bar and column charts. Key statistical measures, including mean, median, mode, range, and standard deviation, are calculated to provide a detailed understanding of the data's central tendency and dispersion. Furthermore, the report employs a forecasting method to predict wind speeds for days 14 and 21, calculating the values of 'm' and 'c' using linear regression. The conclusion emphasizes the importance of data analysis in making informed decisions, particularly in forecasting future trends. References to relevant academic sources are included to support the analysis.
tabler-icon-diamond-filled.svg

Contribute Materials

Your contribution can guide someone’s learning journey. Share your documents today.
Document Page
Data Analysis and
Forecasting
tabler-icon-diamond-filled.svg

Secure Best Marks with AI Grader

Need help grading? Try our AI Grader for instant feedback on your assignments.
Document Page
Table of Contents
INTRODUCTION ..........................................................................................................................3
MAIN BODY...................................................................................................................................3
1. Representation of data in tabular form:...................................................................................3
2. Data representation in charts:..................................................................................................4
3. Calculations of mean, median, mode, standard deviation and range: ....................................5
4. Calculating values of m, c and wind forecast of day 14 and 21:............................................7
CONCLUSION................................................................................................................................9
.........................................................................................................................................................9
REFERENCES..............................................................................................................................10
Document Page
INTRODUCTION
The data analysis and forecasting may be defined as a type of technique which is
associated with process of gathering and evaluating the data in order to make proper forecasting
(Hussain, Rahman and Memon, 2016). The main objective of data analysis is to take decisions
on the basis of forecasted information. In the project report mean, mode, median and standard
deviation is computed as per data of wind speed of a city. As well as value of “c” and “m” is
calculated on the basis of forecasting method.
MAIN BODY
1. Representation of data in tabular form:
To address this task of report , speed of wind in ten days starting from 11th July to 20th
July , 2019 of Manchester city, United Kingdom (Wind speed of Manchester, 2019.). All the data
is taken as per time period of 6 PM that is as follows :
Time- 6:00 PM
Date Wind speed (Km/h)
11/07/19 9
12/07/19 16
13/07/19 12
14/07/19 5
15/07/19 9
16/07/19 9
17/07/19 6
18/07/19 11
19/07/19 10
20/07/19 15
Document Page
2. Data representation in charts:
Bar Graph:
11/07/2019
12/07/2019
13/07/2019
14/07/2019
15/07/2019
16/07/2019
17/07/2019
18/07/2019
19/07/2019
20/07/2019
0 2 4 6 8 10 12 14 16 18
9
16
12
5
9
9
6
11
10
15
Wind speed (Km/h)
Wind speed
Date
Column Chart:
11/07/2019 13/07/2019 15/07/2019 17/07/2019 19/07/2019
0
2
4
6
8
10
12
14
16
18
9
16
12
5
9 9
6
11 10
15
Wind speed (Km/h)
Date
Wind speed
tabler-icon-diamond-filled.svg

Secure Best Marks with AI Grader

Need help grading? Try our AI Grader for instant feedback on your assignments.
Document Page
3. Calculations of mean, median, mode, standard deviation and range:
Number of Days Wind (km/h)
1 9
2 16
3 12
4 5
5 9
6 9
7 6
8 11
9 10
10 15
Total 102
Mean 10.2
Median 9.5
Mode 9
Range 11
Maximum 16
Minimum 5
(I) Mean – The term mean can be defined as an average of group of numbers by dividing total of
all data from number of data (Gunter and Önder, 2016). The value of mean is calculated by
different formulas which depends on series of number. Basically, in the case of individual data
series mean is calculated by below mentioned formula that is as follows :
μ = ∑ x/ N
= 102 / 10
Document Page
= 10.2
So, the value of mean is 10.2.
(II) Median – This can be defined as calculating middle value from group of data set. The value
of median is calculated in different ways which depends on number of data. If number of data are
odd then formula will be : (N + 1) / 2 and if number of data are even then formula will be : N / 2
& N / 2 + 1th values. On the basis of chosen data, value of median is computed below that is as
follows:
This is necessary to arrange the all data in ascending order for further calculation:
Wind (km/h)
5
6
9
9
9
10
11
12
15
16
N = 10
The number of data are even, so formula will be like:
Median = (N+1) / 2th item
= (10 + 1) / 2th item
= 5.5th item
So,
= (5th item + 6th item) / 2
Document Page
= (9 + 10 ) / 2
= 9.5
(III) Mode – The term mode , can be defined as a value in whose frequency is high among group
of numbers (Kim, Hong and Kang, 2015). Herein, the case of chosen data number 9 has higher
frequency of 3 so value of mode is 9.
(IV) Range – The value of range is being calculated by deducing higher numbered value from
minimum value from a group of numbers. Its formula is as follows:
Range = Higher value – Minimum value
As per the selected data, value of range is (16-5) = 11.
(V) Standard Deviation – It can be defined as measurement of desperation of a group of numbers
(Yin, Tian and Kaynak, 2016). The calculation of standard deviation is done below of chosen
data:
Dates Wind (km/h) x - μ (x - μ)2
11/07/19 9 -1.2 1.44
12/07/19 16 5.8 33.64
13/07/19 12 1.8 3.24
14/07/19 5 -5.2 27.04
15/07/19 9 -1.2 1.44
16/07/19 9 -1.2 1.44
17/07/19 6 -4.2 17.64
18/07/19 11 0.8 0.64
19/07/19 10 -0.2 0.04
20/07/19 15 4.8 23.04
0 Total = 109.6
tabler-icon-diamond-filled.svg

Paraphrase This Document

Need a fresh take? Get an instant paraphrase of this document with our AI Paraphraser
Document Page
Variance 10.96
Standard deviation 3.31
σ = √∑(x - μ)2/N
= √109.6 / 10
= 10.96
= 3.31
4. Calculating values of m, c and wind forecast of day 14 and 21:
In this question, number of days are assigned as “X” and speed of wind as “Y”. Further
calculation is mentioned below:
Days (X) Wind (km/h) (Y) X2 ∑XY
1 9 1 9
2 16 4 32
3 12 9 36
4 5 16 20
5 9 25 45
6 9 36 54
7 6 49 42
8 11 64 88
9 10 81 90
10 15 100 150
∑X = 55 ∑Y = 102 ∑X2 = 385 ∑XY = 566
(I) Calculation of “m” value :
N * ∑XY - ∑X * ∑Y / N*∑X2 - ( ∑X )2
10*566 – 55*102 / 10 * 385 - (55)2
Document Page
= 5660 – 5610 / 3850 – 3025
= 50/825
= 0.06
(II) Calculation of “c” value :
∑Y- m ∑X/ N
102- 0.06 * 55/10
=102- 3.33 /10
=98.67 / 10
=9.86
(III) On the basis of above computed value of “m” and “c” speed of wind is forecasted that is ad
follows:
Forecasting of wind speed for day 14
Y = m*x+c
= 0.06 * 14 + 9.86
= 0.84 + 9.86
= 10.7
so, the forecasted wind speed is 10.7 km/h.
Forecasting of wind speed for day 21
Y = m*x + c
= 0.06 * 21 + 9.86
= 11.12
hence , the forecasted speed of wind on day 21 is of 11.12 km/h.
CONCLUSION
As per the above project report, it has been articulated that data analysis plays an
important role in aspect of futuristic decision making. In the project report 10 days' wind speed
of Manchester is taken as data for calculation of mean, mode, median and standard deviation. As
well as wind speed for day 14 and 21 forecasted by using an appropriate forecasting method.
Document Page
chevron_up_icon
1 out of 10
circle_padding
hide_on_mobile
zoom_out_icon
logo.png

Your All-in-One AI-Powered Toolkit for Academic Success.

Available 24*7 on WhatsApp / Email

[object Object]