Report on Numeracy and Data Analysis: London Wind Speed Data
VerifiedAdded on 2021/02/20
|8
|1579
|31
Report
AI Summary
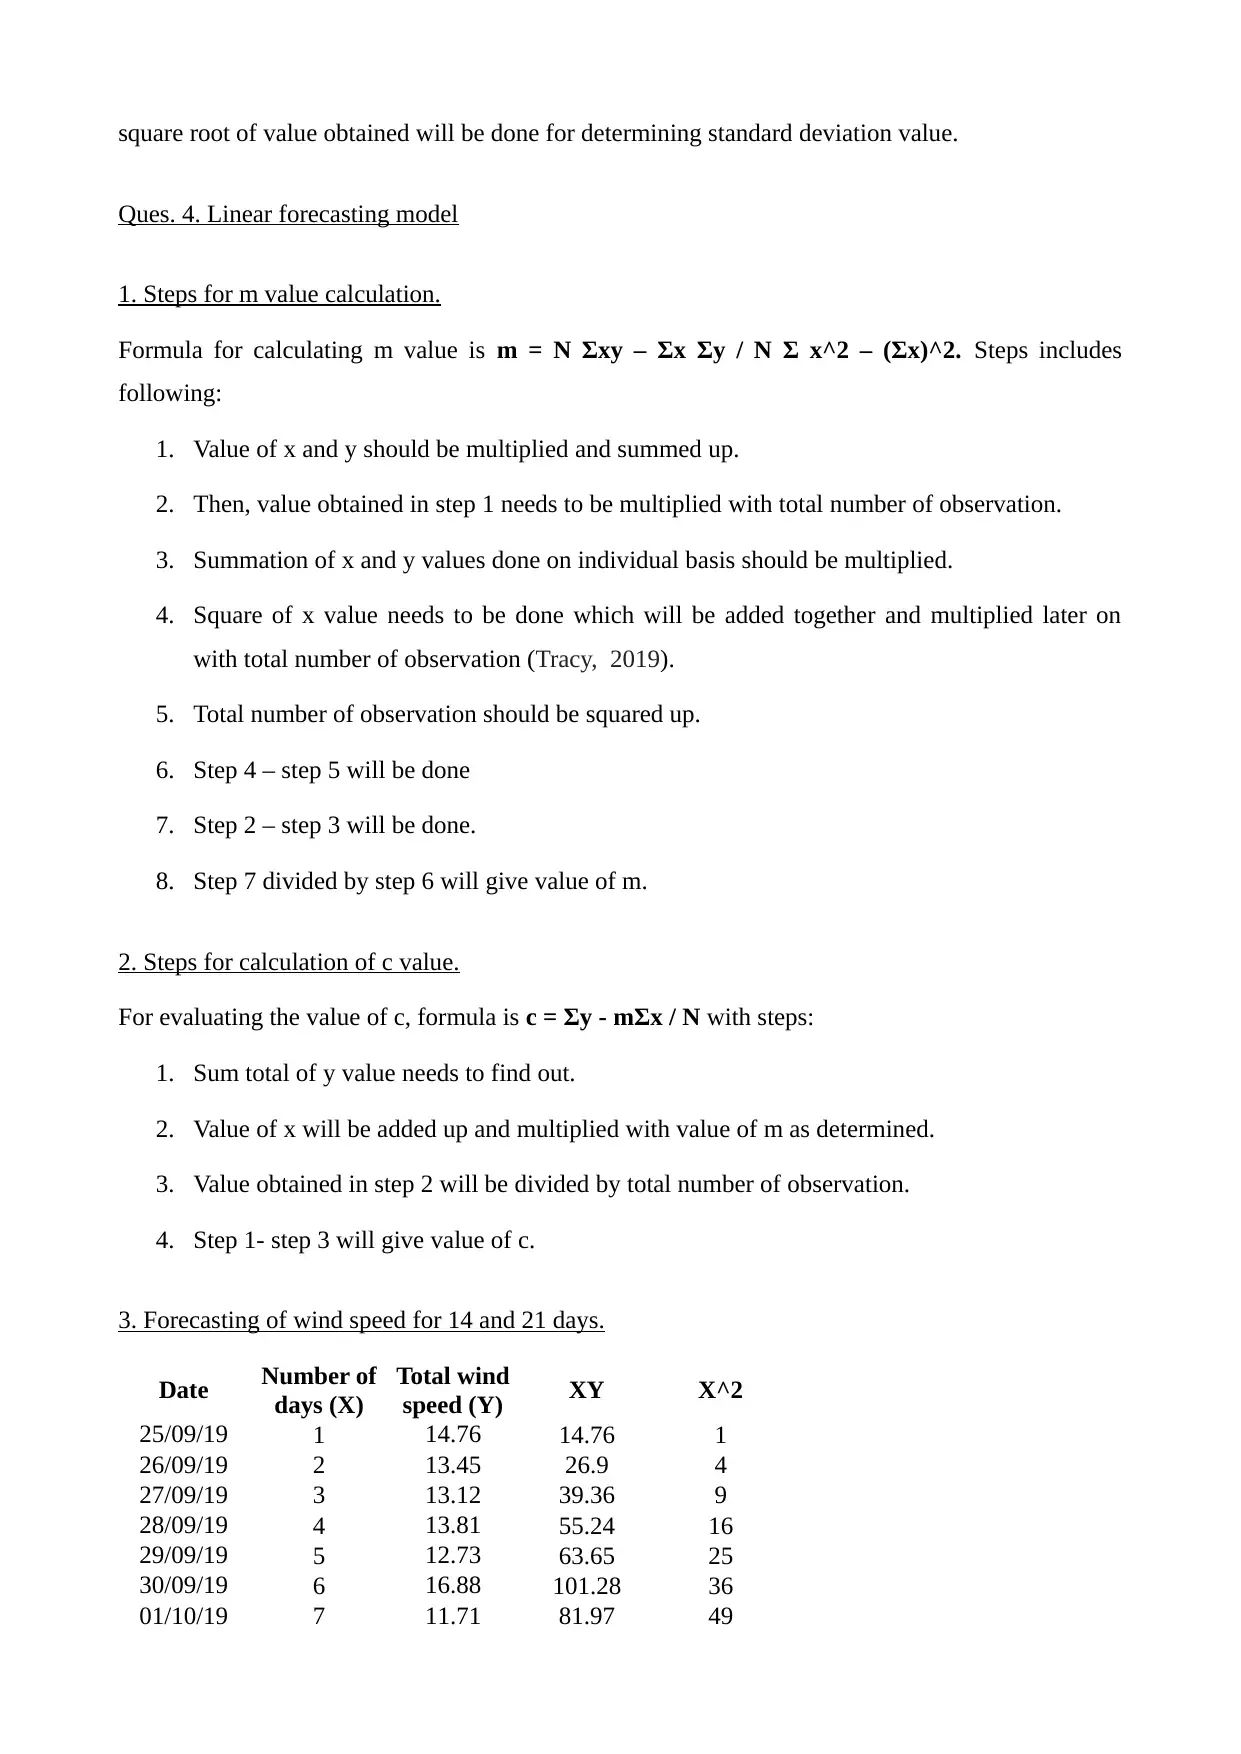
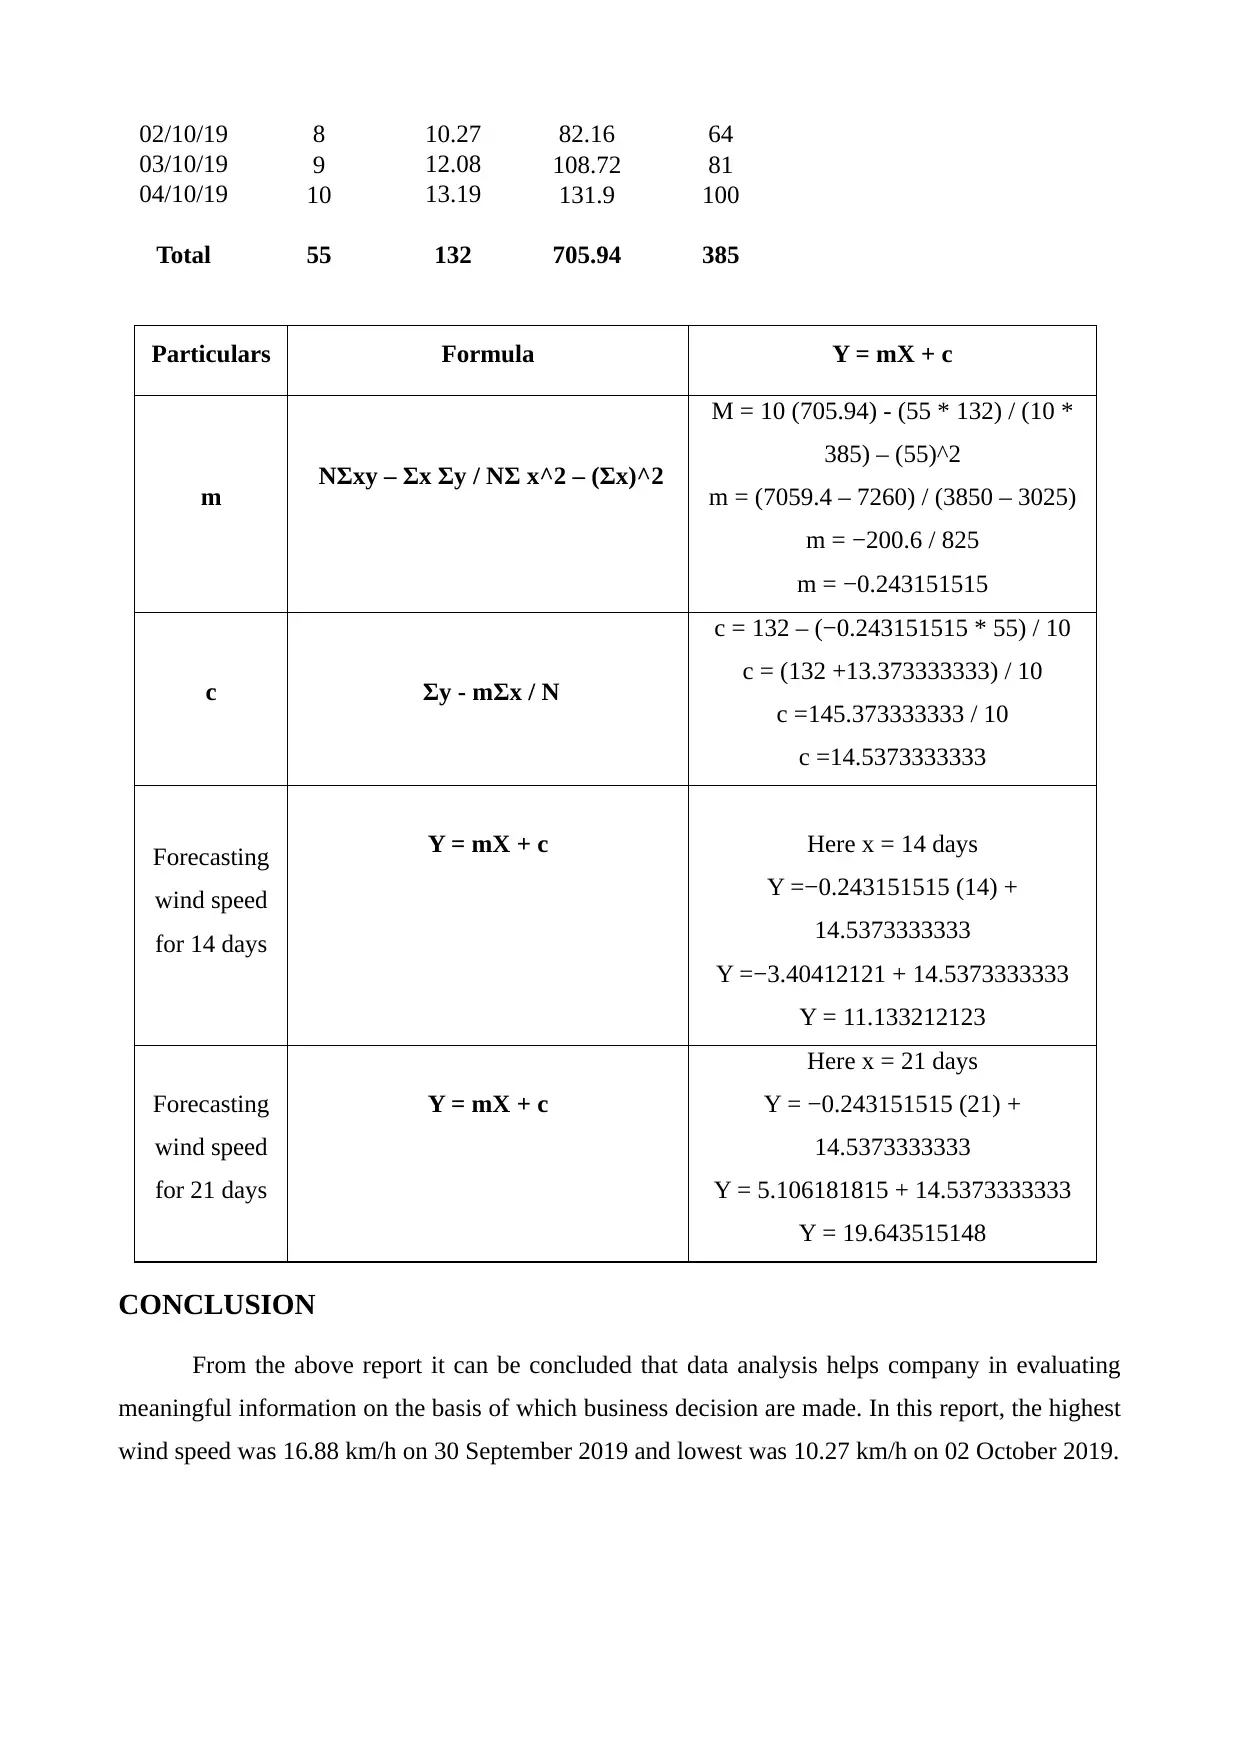
This report presents a comprehensive data analysis of wind speed data collected from London, UK, over a ten-day period. The analysis begins with the arrangement of the data in a tabular format and then proceeds to graphical presentations using bar and line charts to visualize the fluctuating wind speed trends. Various statistical methods, including the calculation of mean, median, mode, range, and standard deviation, are employed to interpret the data and identify key characteristics. Furthermore, the report utilizes a linear forecasting model to predict wind speeds for the 14th and 21st days, providing a practical application of the data analysis techniques. The conclusion summarizes the findings, highlighting the importance of data analysis in decision-making processes. The report includes detailed steps for calculations and references supporting the methodologies used. The report is available on Desklib, a platform providing students with AI-based study tools, past papers, and solved assignments.

Numeracy and Data analysis
Paraphrase This Document
Need a fresh take? Get an instant paraphrase of this document with our AI Paraphraser

Table of Contents
INTRODUCTION................................................................................................................................3
MAIN BODY.......................................................................................................................................3
Ques. 1. Arrangement of data in table form.....................................................................................3
Ques. 2. Graphical presentation of data...........................................................................................3
Ques. 3. Calculation of following along with steps.........................................................................3
Ques. 4. Linear forecasting model...................................................................................................4
1. Steps for m value calculation.......................................................................................................4
2. Steps for calculation of c value....................................................................................................4
3. Forecasting of wind speed for 14 and 21 days.............................................................................5
CONCLUSION....................................................................................................................................5
REFERENCES.....................................................................................................................................6

INTRODUCTION
Analysis of data gathered is considered as one of the most important process for every business
organisation which assists company in making crucial decision. With the help of statistical as well
as mathematical tools, data collected can be interpreted in better manner for deriving some
meaningful information from it. The present report is about data analysis of wind speed of London
city, United Kingdom of past 10 consecutive days. It will provide data analysis with the help of
graphs and table as well for better understanding and interpretation. Furthermore, use of different
types of statistical methods such as mean, mode etc. will be done for interpreting data. At last, focus
will be made on defining use of linear forecasting model for 14 and 21 days for determining wind
speed.
MAIN BODY
Ques. 1. Arrangement of data in table form.
Date Wind speed Km/Hr
25/09/19 14.76
26/09/19 13.45
27/09/19 13.12
28/09/19 13.81
29/09/19 12.73
30/09/19 16.88
01/10/19 11.71
02/10/19 10.27
03/10/19 12.08
04/10/19 13.19
Ques. 2. Graphical presentation of data.
1. Bar chart
⊘ This is a preview!⊘
Do you want full access?
Subscribe today to unlock all pages.

Trusted by 1+ million students worldwide

2. Line chart
Interpretation – The highest wind speed was on 30 September 2019 i.e. 16.88 km/h and
lowest wind speed was on 2 October 2019 which is 10.27 km/h. It can be interpreted that mixed
fluctuating trend has been observed in the London City in past ten consecutive days.
25/09/2019
26/09/2019
27/09/2019
28/09/2019
29/09/2019
30/09/2019
01/10/2019
02/10/2019
03/10/2019
04/10/2019
0
2
4
6
8
10
12
14
16
18
Wind speed Km/Hr
25/09/2019
26/09/2019
27/09/2019
28/09/2019
29/09/2019
30/09/2019
01/10/2019
02/10/2019
03/10/2019
04/10/2019
0 2 4 6 8 10 12 14 16 18
Wind speed Km/Hr
Paraphrase This Document
Need a fresh take? Get an instant paraphrase of this document with our AI Paraphraser

Ques. 3. Calculation of following along with steps.
Day Wind speed Km/Hr
1 14.76
2 13.45
3 13.12
4 13.81
5 12.73
6 16.88
7 11.71
8 10.27
9 12.08
10 13.19
Particulars Values
Mean 13.2
Median 13.155
Mode #VALUE!
Range 6.61
Standard deviation 1.7856651422
Mean – Collect all the data values of both the small and big numbers which average has to be
determined. Add up all together so that a total can be find. After summing up, the next step is to
count the number of values as falling in the data set. Now, divide the added value by total number
of count determined so as to ascertain the mean value.
Median – Arrange all the numbers from least to the greatest value. In case if items in the data set is
even number, then median can be calculated by taking average of two middle numbers of arranged
data set (Bethapudi and Desai, 2017).
Range – For calculating the range value of given data set, first the highest as well as lowest value in
such set of data has to be determined. After identification of highest and lowest value, the value
having lower degree will be subtracted from the highest number of the data set which will be called
as range of that data set (Dickie, Feldman and Meyers, 2017).
Mode – In order to evaluating modal value, all the numbers present in the data set needs to be sort
down in order. After, sorting of number is done the next step is related with counting of each
number present therein. The number which is repeating most is mode.
Standard Deviation – First step is to find out the average value of present data. Then from each
number present, mean has to be subtracted and result obtained needs to be square of. After, that
mean of squared differences needs to evaluate (Massmann, Woods and Wagener, 2018). At last,

square root of value obtained will be done for determining standard deviation value.
Ques. 4. Linear forecasting model
1. Steps for m value calculation.
Formula for calculating m value is m = N Σxy – Σx Σy / N Σ x^2 – (Σx)^2. Steps includes
following:
1. Value of x and y should be multiplied and summed up.
2. Then, value obtained in step 1 needs to be multiplied with total number of observation.
3. Summation of x and y values done on individual basis should be multiplied.
4. Square of x value needs to be done which will be added together and multiplied later on
with total number of observation (Tracy, 2019).
5. Total number of observation should be squared up.
6. Step 4 – step 5 will be done
7. Step 2 – step 3 will be done.
8. Step 7 divided by step 6 will give value of m.
2. Steps for calculation of c value.
For evaluating the value of c, formula is c = Σy - mΣx / N with steps:
1. Sum total of y value needs to find out.
2. Value of x will be added up and multiplied with value of m as determined.
3. Value obtained in step 2 will be divided by total number of observation.
4. Step 1- step 3 will give value of c.
3. Forecasting of wind speed for 14 and 21 days.
Date Number of
days (X)
Total wind
speed (Y) XY X^2
25/09/19 1 14.76 14.76 1
26/09/19 2 13.45 26.9 4
27/09/19 3 13.12 39.36 9
28/09/19 4 13.81 55.24 16
29/09/19 5 12.73 63.65 25
30/09/19 6 16.88 101.28 36
01/10/19 7 11.71 81.97 49
⊘ This is a preview!⊘
Do you want full access?
Subscribe today to unlock all pages.

Trusted by 1+ million students worldwide

02/10/19 8 10.27 82.16 64
03/10/19 9 12.08 108.72 81
04/10/19 10 13.19 131.9 100
Total 55 132 705.94 385
Particulars Formula Y = mX + c
m NΣxy – Σx Σy / NΣ x^2 – (Σx)^2
M = 10 (705.94) - (55 * 132) / (10 *
385) – (55)^2
m = (7059.4 – 7260) / (3850 – 3025)
m = −200.6 / 825
m = −0.243151515
c Σy - mΣx / N
c = 132 – (−0.243151515 * 55) / 10
c = (132 +13.373333333) / 10
c =145.373333333 / 10
c =14.5373333333
Forecasting
wind speed
for 14 days
Y = mX + c Here x = 14 days
Y =−0.243151515 (14) +
14.5373333333
Y =−3.40412121 + 14.5373333333
Y = 11.133212123
Forecasting
wind speed
for 21 days
Y = mX + c
Here x = 21 days
Y = −0.243151515 (21) +
14.5373333333
Y = 5.106181815 + 14.5373333333
Y = 19.643515148
CONCLUSION
From the above report it can be concluded that data analysis helps company in evaluating
meaningful information on the basis of which business decision are made. In this report, the highest
wind speed was 16.88 km/h on 30 September 2019 and lowest was 10.27 km/h on 02 October 2019.
Paraphrase This Document
Need a fresh take? Get an instant paraphrase of this document with our AI Paraphraser

REFERENCES
Books and Journals
Bethapudi, S. and Desai, S., 2017. Median statistics estimates of Hubble and Newton's
constants. The European Physical Journal Plus. 132(2). p.78.
Dickie, G. A., Feldman, D. J. and Meyers, D. L., International Business Machines Corp,
2017. Merging metadata for database storage regions based on overlapping range values. U.S.
Patent 9,588,978.
Iooss, B. and Lemaître, P., 2015. A review on global sensitivity analysis methods. In Uncertainty
management in simulation-optimization of complex systems (pp. 101-122). Springer, Boston,
MA.
Massmann, C., Woods, R. and Wagener, T., 2018, April. Reducing equifinality by carrying out a
multi-objective evaluation based on the bias, correlation and standard deviation errors. In EGU
General Assembly Conference Abstracts (Vol. 20, p. 11457).
Tracy, S. J., 2019. Qualitative research methods: Collecting evidence, crafting analysis,
communicating impact. John Wiley & Sons.
Online
Steps for calculating mean. 2019. [Online]. Available through:
<https://www.toppr.com/guides/economics/measures-of-central-tendency/calculation-of-mean-
median-and-mode/>.
1 out of 8
Related Documents

Your All-in-One AI-Powered Toolkit for Academic Success.
+13062052269
info@desklib.com
Available 24*7 on WhatsApp / Email
Unlock your academic potential
Copyright © 2020–2025 A2Z Services. All Rights Reserved. Developed and managed by ZUCOL.