Wind Speed Data Analysis and Linear Prediction Model Report

Verified

Added on  2023/06/10

|9
|1546
|286
Report
AI Summary
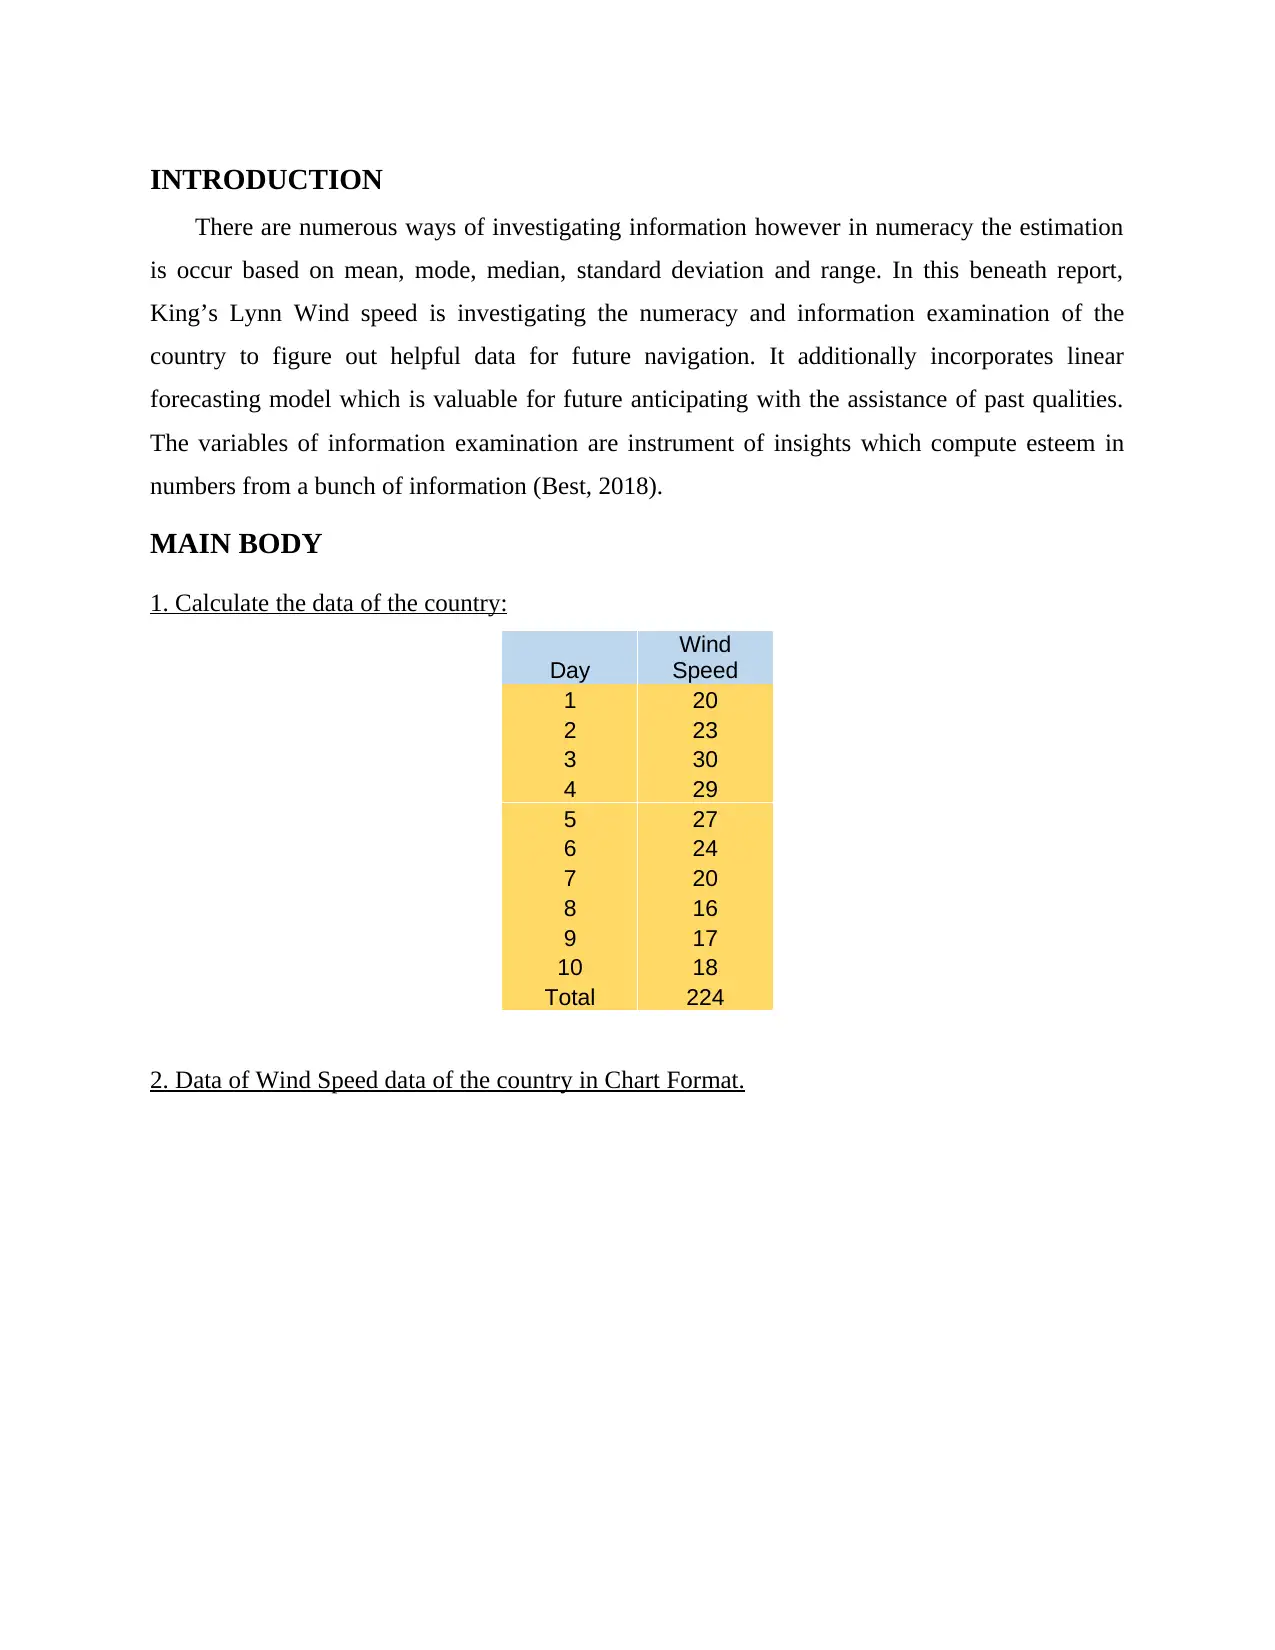
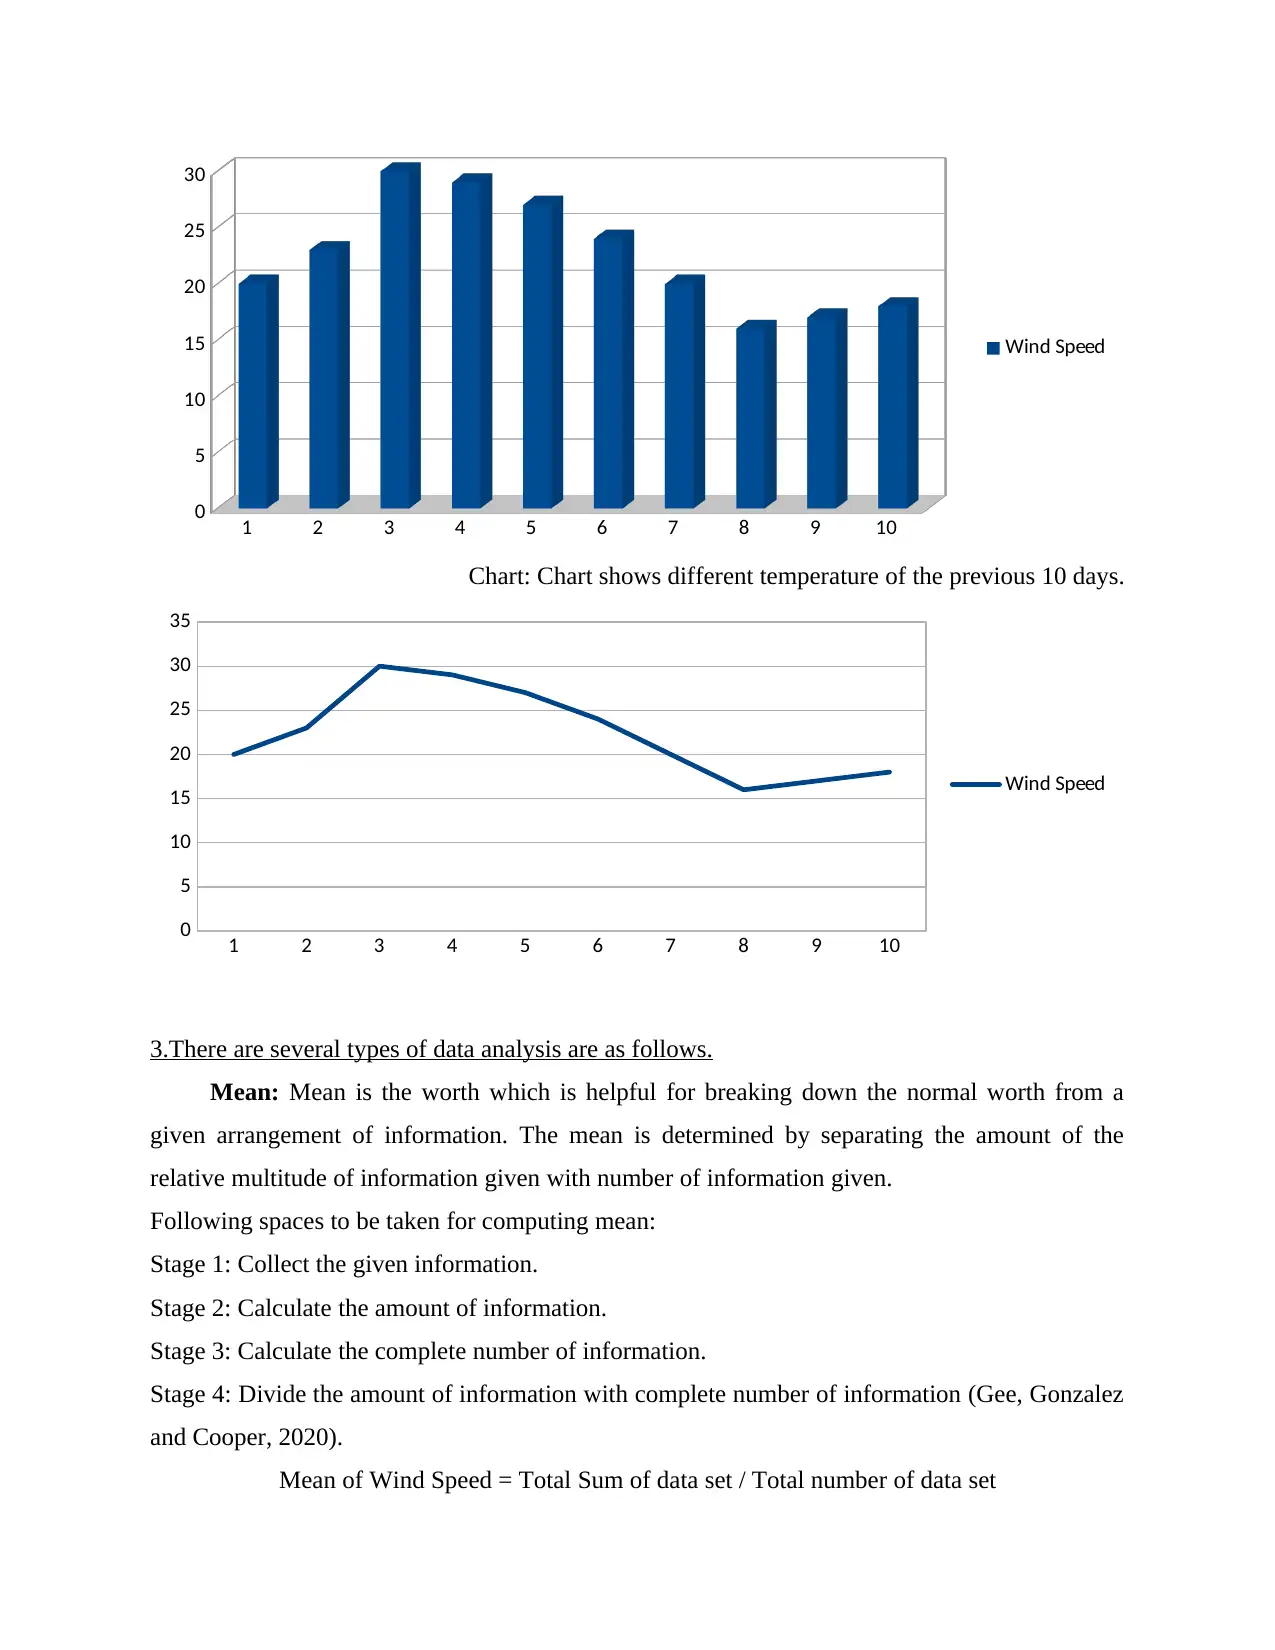
This report presents a comprehensive analysis of wind speed data, focusing on King's Lynn. It begins with an introduction to data analysis and its importance, followed by a detailed calculation of key statistical measures including mean, median, mode, range, and standard deviation. The report uses a chart to visualize wind speed data over a 10-day period. Furthermore, it delves into the application of a linear prediction model to forecast future wind speeds, calculating the values of 'm' and 'c' for the model and predicting wind speeds for specific days. The conclusion summarizes the findings and the usefulness of the analysis for future predictions. The report includes references to relevant sources.
Document Page
And Data Analysis
tabler-icon-diamond-filled.svg

Paraphrase This Document

Need a fresh take? Get an instant paraphrase of this document with our AI Paraphraser
Document Page
Contents
INTRODUCTION...........................................................................................................................3
MAIN BODY..................................................................................................................................3
1. Calculate the data of the country:............................................................................................3
2. Data of Wind Speed data of the country in Chart Format.......................................................3
3.There are several types of data analysis are as follows............................................................4
4. Using Linear Predicting model do regression investigates and discover the worth of c and
m..................................................................................................................................................6
CONCLUSION................................................................................................................................8
REFERENCES................................................................................................................................9
Document Page
INTRODUCTION
There are numerous ways of investigating information however in numeracy the estimation
is occur based on mean, mode, median, standard deviation and range. In this beneath report,
King’s Lynn Wind speed is investigating the numeracy and information examination of the
country to figure out helpful data for future navigation. It additionally incorporates linear
forecasting model which is valuable for future anticipating with the assistance of past qualities.
The variables of information examination are instrument of insights which compute esteem in
numbers from a bunch of information (Best, 2018).
MAIN BODY
1. Calculate the data of the country:
Day
Wind
Speed
1 20
2 23
3 30
4 29
5 27
6 24
7 20
8 16
9 17
10 18
Total 224
2. Data of Wind Speed data of the country in Chart Format.
Document Page
1 2 3 4 5 6 7 8 9 10
0
5
10
15
20
25
30
Wind Speed
Chart: Chart shows different temperature of the previous 10 days.
1 2 3 4 5 6 7 8 9 10
0
5
10
15
20
25
30
35
Wind Speed
3.There are several types of data analysis are as follows.
Mean: Mean is the worth which is helpful for breaking down the normal worth from a
given arrangement of information. The mean is determined by separating the amount of the
relative multitude of information given with number of information given.
Following spaces to be taken for computing mean:
Stage 1: Collect the given information.
Stage 2: Calculate the amount of information.
Stage 3: Calculate the complete number of information.
Stage 4: Divide the amount of information with complete number of information (Gee, Gonzalez
and Cooper, 2020).
Mean of Wind Speed = Total Sum of data set / Total number of data set
tabler-icon-diamond-filled.svg

Paraphrase This Document

Need a fresh take? Get an instant paraphrase of this document with our AI Paraphraser
Document Page
Mean = 224 / 10
Mean = 22.4
Median: The worth of median decides by arranging the information in rising or dropping
request. It is likewise called the mid-term of the set information. It is determined by two unique
ways which is relied upon the even or odd worth (Hodgen and et.al., 2019).
Steps of computing the worth of middle:
Stage 1: Sorting of information in ascending or descending order
Stage 2: Count the number in informational index.
Stage 3: Determining the term is whether even or odd.
Stage 4: If the place of middle is odd then the recipe is (N+1)/2.
Median Value (odd) = N / 2
Median value (even) = (N+1) / 2
Median of wind speed is as follows:
20, 23, 30, 29, 27, 24, 20, 16, 17, 18
16, 17, 18, 20, 20, 23, 24, 27, 29, 30
Median = (10 + 1) / 2
Median =5.5th position
Median = 21.5
Mode = The value of mode is recognized by noticing the higher result of a solitary
number.
Steps of mode are as per the following:
Stage 1: Position the numbers in rising or sliding request.
Stage 2: Analyze the given information.
Stage 3: Finding the number which comes additional time in an information sheet.
Stage 4: Than choose the higher results number.
16, 17, 18, 20, 20, 23, 24, 27, 29, 30
Mode = 20
Range: The worth of range is gotten from taking away the lower number in information from
higher number in information.
Steps to ascertain the Range Value:
Document Page
Stage 1: Sort the information.
Stage 2: Pick out the highest and lowest value.
Stage 3: Calculate the distinction among greatest and least.
Stage 4: At the end, the worth of reach is determined (Marks, 2021).
Calculation of wind speed range:
Range = Highest value – Lowest Value
= 30 – 16
Range = 14
Standard Deviation: The worth of standard deviation is computing the quantity of
spread information according to the worth of mean.
Steps to work out the standard deviation:
Step1: First, track down the value of mean.
Step2: To ascertain every single given standard deviation structure mean.
Step3: Then Calculate the amount of squares.
Step4: After that isolated by the complete number of information.
Step5: At last, take square of the above determined value.
Standard Deviation= √∑ (xi – μ) 2 / N
=√226.4 / 10
Standard Deviation = 1.5
4. Using Linear Predicting model do regression investigates and discover the worth of c and m.
Linear forecasting Theory: This model is based on past estimation report. It is useful for
future determining.
Following are the means of Linear determining hypothesis;
Step 1: Find out the issue.
Step 2: Search and gather the data.
Step 3: Observe the examination from starting.
Step 4: Pick out the model for future practices.
Step 5: Check every one of the information and execution of model.
y = mx + C
where,
Document Page
'y' =Dependent Factor
'mx' = Independent factor
'c' = constant Factor
Following are the means to compute the worth of 'm’;
Step1: Both the values identified of x and y should be multiplied.
Step2: Calculate the amount of complete number.
Step3: Add each term independently.
Step4: Multiply both the factors (Shiyanbola and et.al., 2018).
m = (10*1152 – 55*224) / (10*385 – 3025)
= (11520 – 12320) / (3850 – 3025)
= -800 / 825
m = -0.97
Following are the means to work out worth of 'c'
Step1: To Calculate the amount of 'y' variable
Step2: Find out worth of 'm'
Step3: To compute the amount of 'x' variable and afterward multiply both 'm' and amount of 'x'
Step4: Subtract amount of 'm*x' from amount of 'y'
Step5: Then give a division of the value of above step by 'n'.
c = (224 + 0.97 * 55) / 10
c = (224 + 53.35) / 10
c = 277.35 / 10
c = 27.74
Wind Speed on Day 11:
tabler-icon-diamond-filled.svg

Paraphrase This Document

Need a fresh take? Get an instant paraphrase of this document with our AI Paraphraser
Document Page
m = -0.97, c = 27.74, x = 11
y = mx + c
= (-0.97 * 11) + (27.74)
= - 10.67 + 27.74
y = 17.07
Wind Speed on Day 13:
m = 3, c = -13.5, x = 13
y = mx + c
= - 0.95*13 + (27.74)
= - 12.35 + 27.74
Y = 15.39
CONCLUSION
As per the above report, wind speed of the nation shows the numeracy and information
investigation. In this report the estimation of mean, middle, mode, range, standard deviation and
direct determining hypothesis of the specific nation happen and it is likewise useful for
ascertaining the two days' future worth of the nation wind speed.
Document Page
REFERENCES
Books and Journals
Best, J., 2018. Questioning Quintiles: Implications of Choices of Measures for Income Inequality
and Social Mobility. Numeracy: Advancing Education in Quantitative Literacy, 11(2).
Gee, K., Gonzalez, M. and Cooper, C., 2020. Outcomes of inclusive versus separate placements:
A matched pairs comparison study. Research and Practice for Persons with Severe
Disabilities, 45(4), pp.223-240.
Hodgen, J. and et.al., 2019. Catch Up Numeracy Evaluation report and executive summary.
Marks, G.N., 2021. Should value‐added school effects models include student‐and school‐level
covariates? Evidence from Australian population assessment data. British Educational
Research Journal, 47(1), pp.181-204.
Shiyanbola, O.O. and et.al., 2018. The association of health literacy with illness perceptions,
medication beliefs, and medication adherence among individuals with type 2
diabetes. Research in Social and Administrative Pharmacy, 14(9), pp.824-830.
chevron_up_icon
1 out of 9
circle_padding
hide_on_mobile
zoom_out_icon
[object Object]