Wind Tip Speed Ratio Lab Report: Analysis, Results, and Discussion

Verified

Added on  2021/05/27

|8
|1275
|54
Report
AI Summary
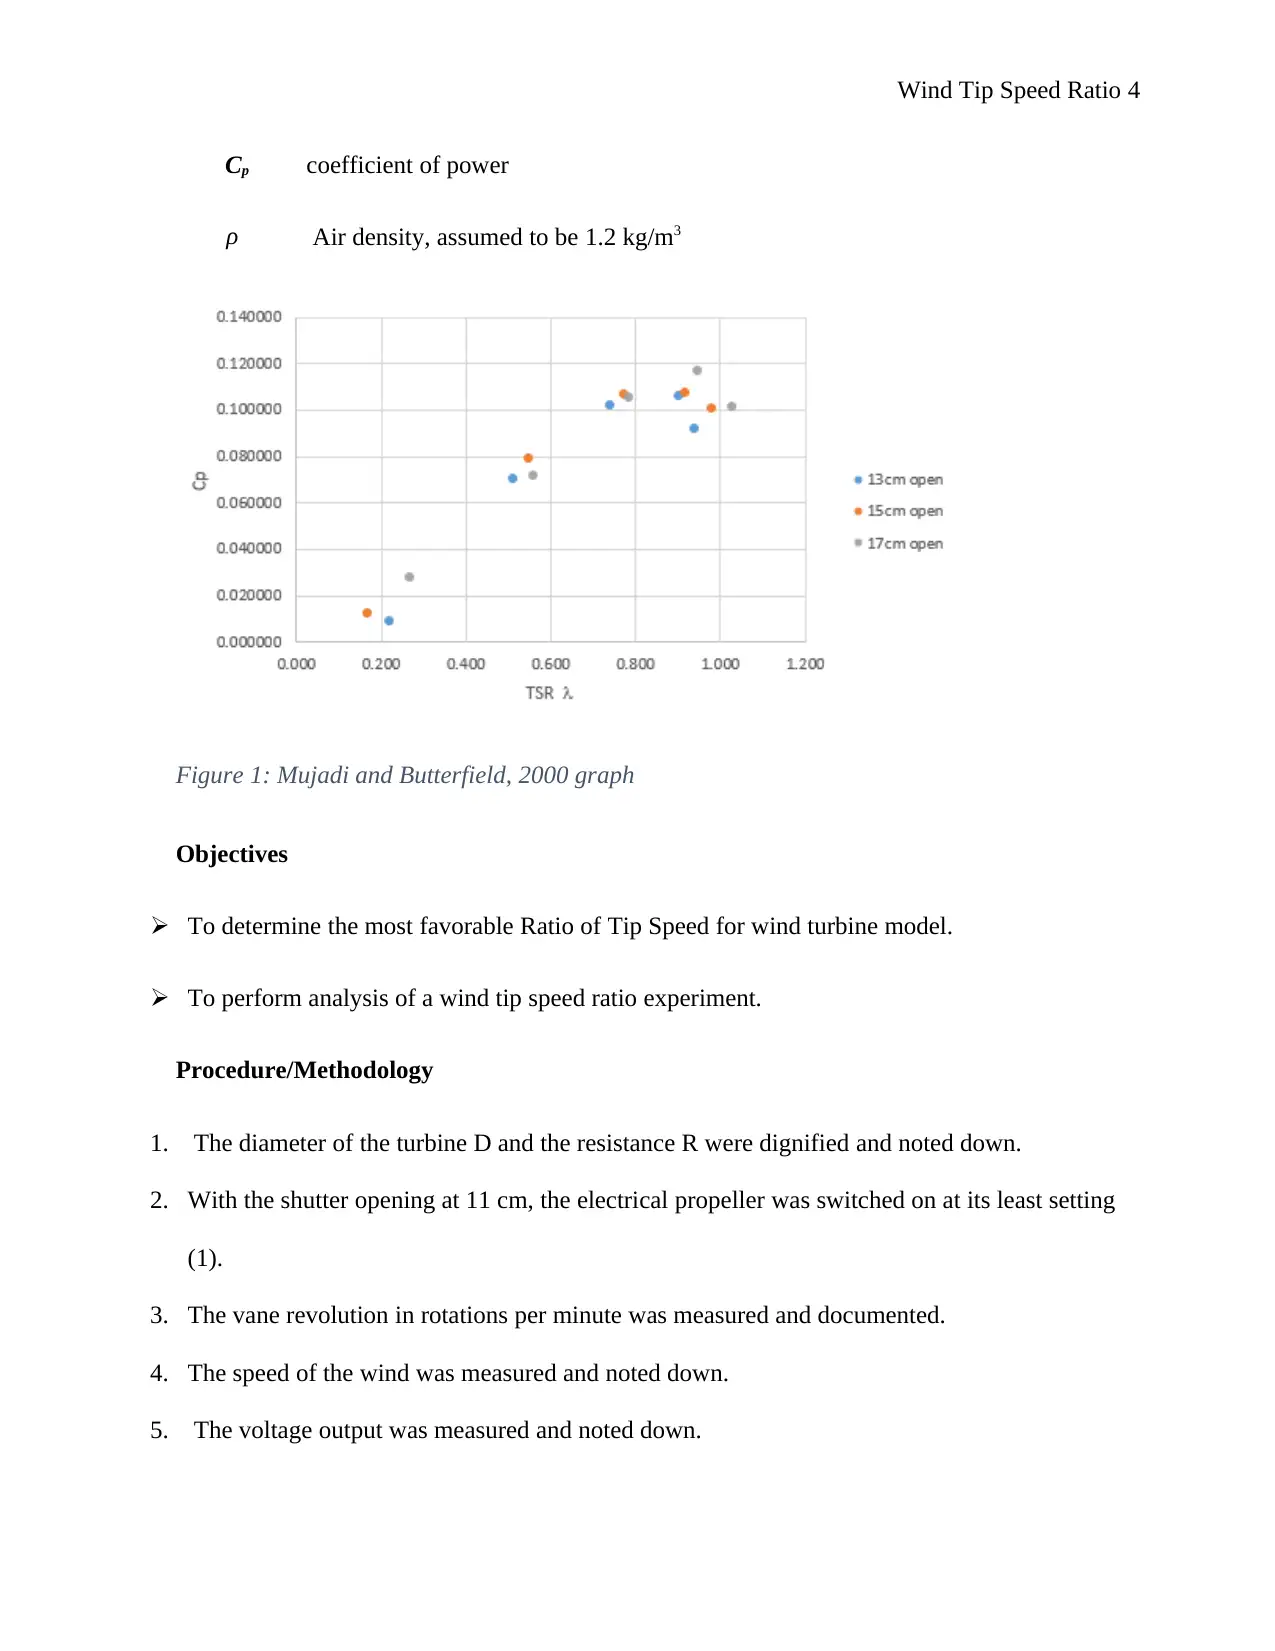
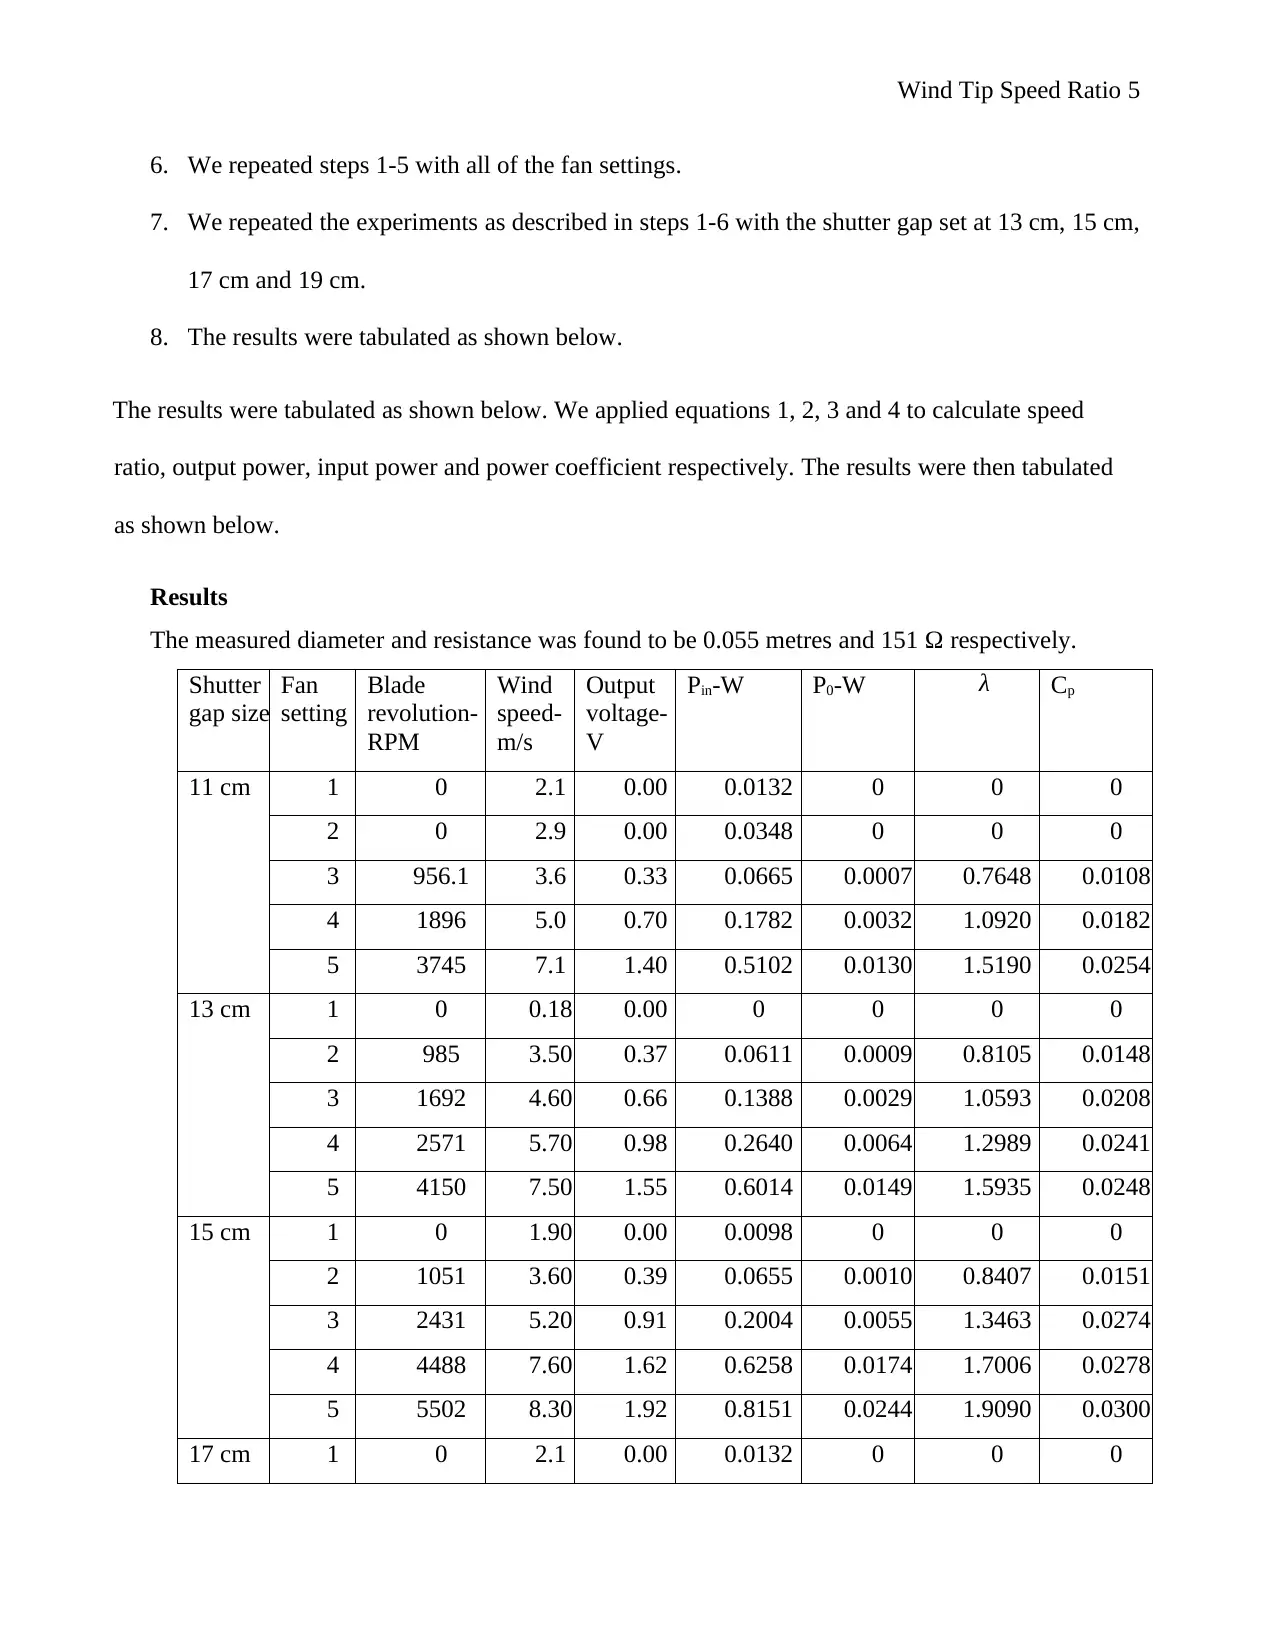
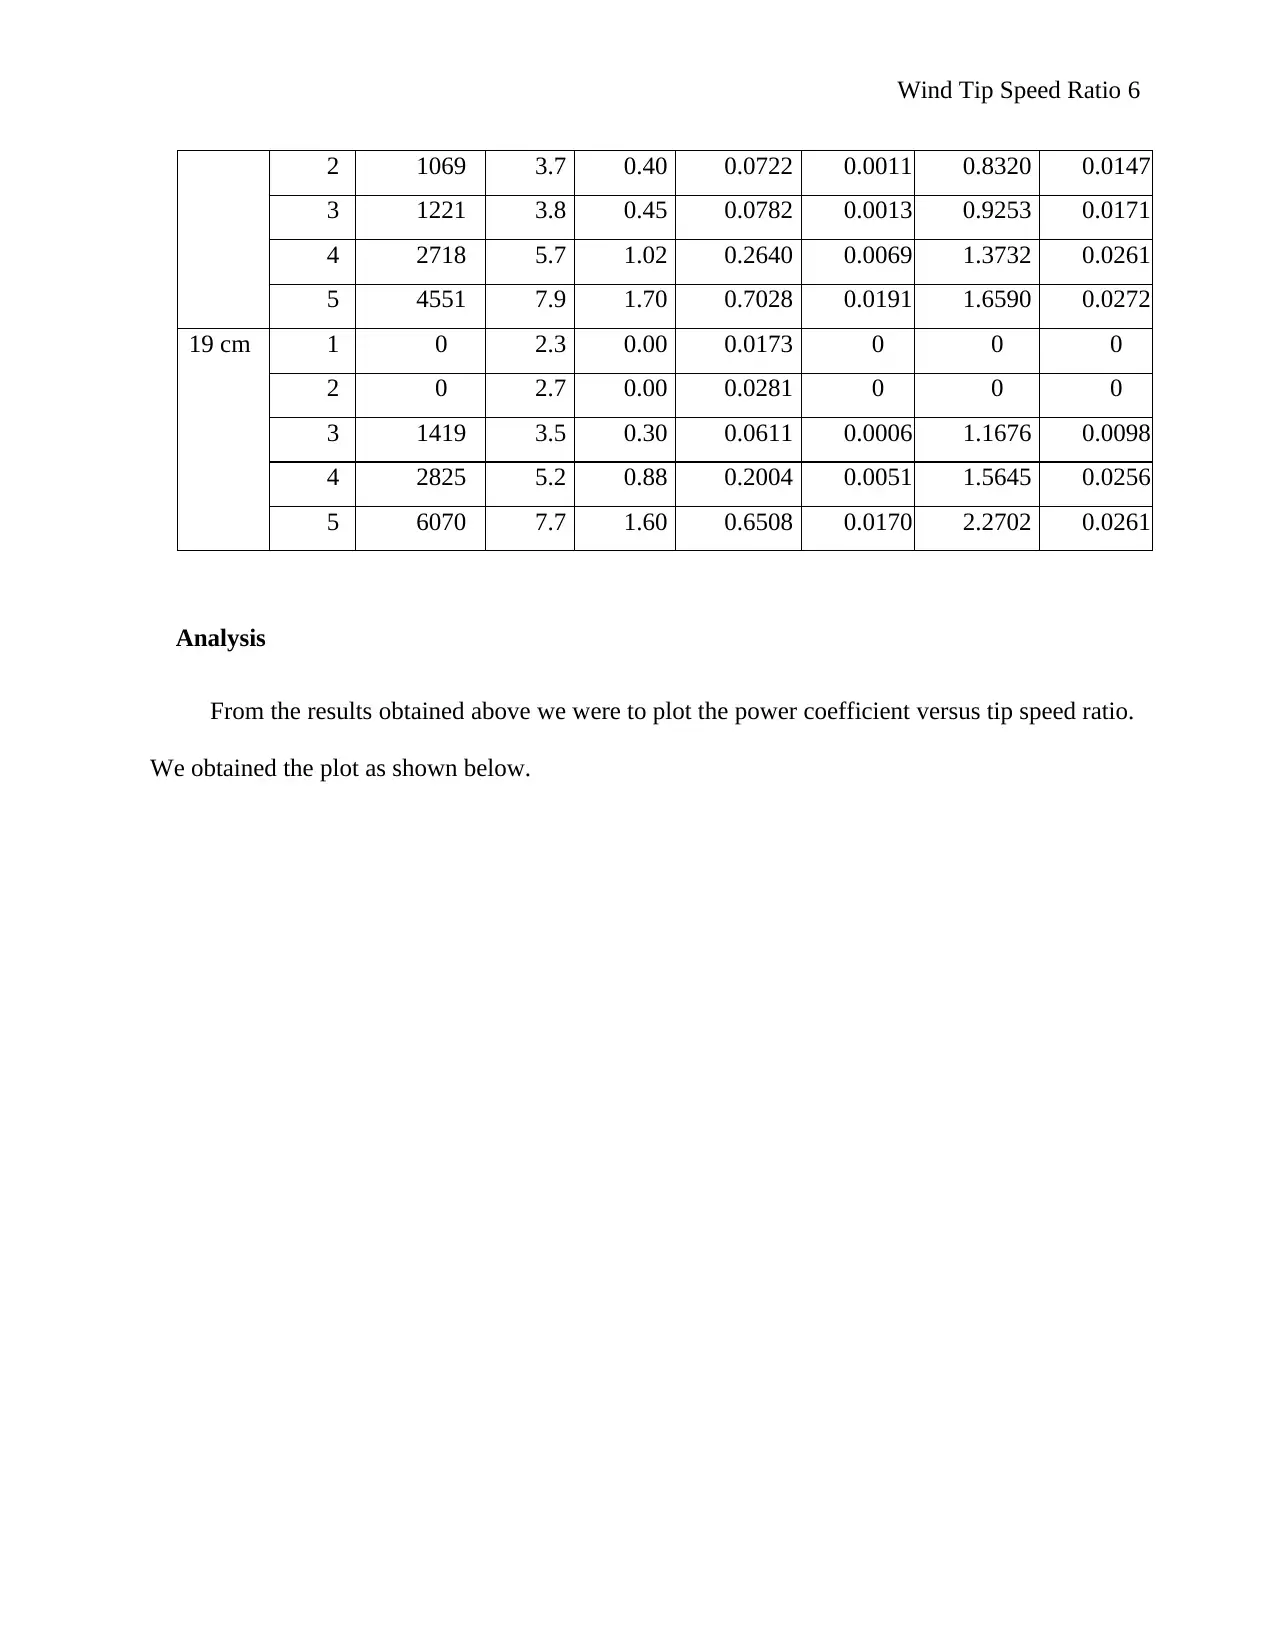
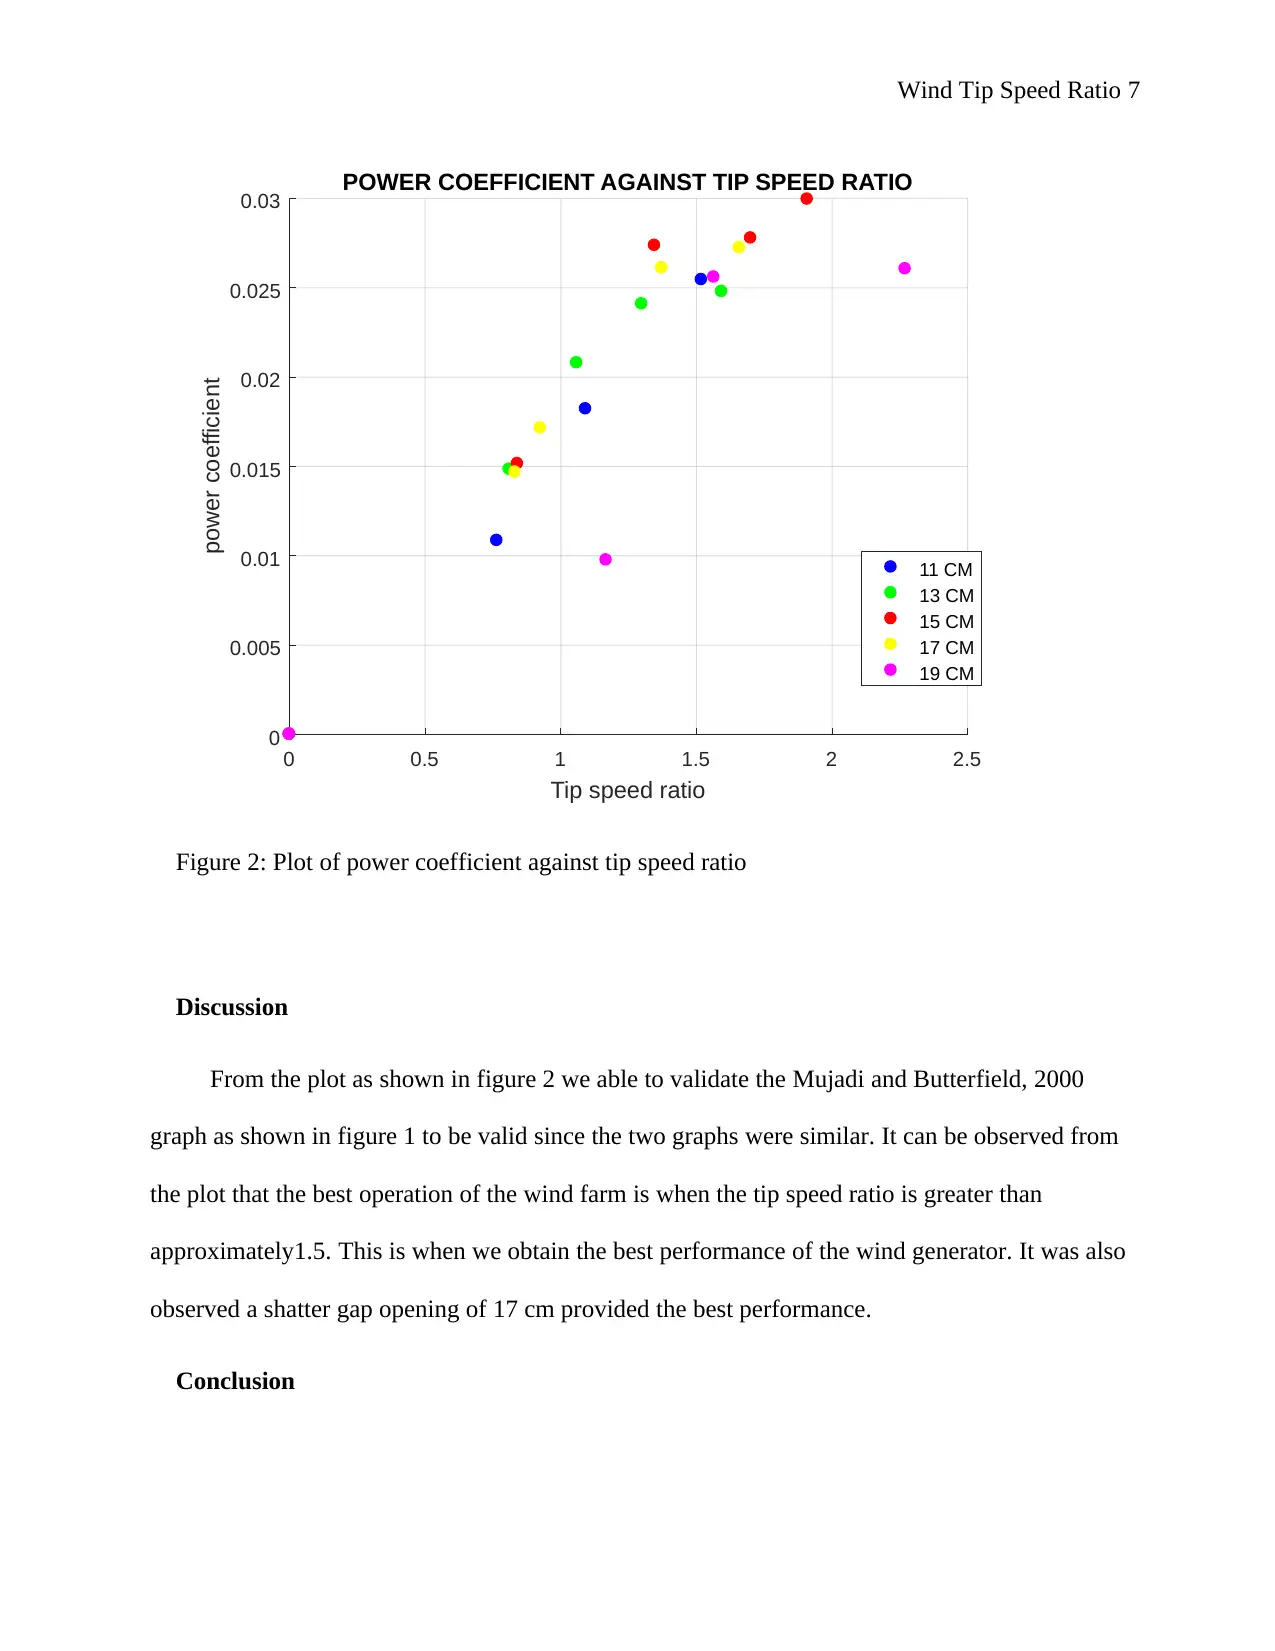
This lab report investigates the Tip Speed Ratio (TSR) of a wind turbine, a crucial factor in wind turbine design, representing the relationship between wind speed and blade tip speed. The experiment involved measuring wind speed, blade revolutions, output voltage, and calculating power output and power coefficient. The methodology included varying fan settings and shutter gaps to observe their impact on TSR. The results were tabulated, and the power coefficient was plotted against the TSR. The analysis validates the relationship of the Mujadi and Butterfield graph, showing that the optimal wind turbine operation occurs when the TSR is above approximately 1.5, and a shutter gap of 17 cm provided the best performance. The report concludes that the optimum operation of the wind generator is when the speed ratio is 1.9 and the corresponding power coefficient is 0.03. The report also includes references to relevant literature on wind turbine technology and design.
Document Page
Wind Tip Speed Ratio 1
Wind Tip Speed Ratio Lab Report
By
(Name)
(Course)
(Professor’s Name)
(Institution)
(State)
(Date)
tabler-icon-diamond-filled.svg

Paraphrase This Document

Need a fresh take? Get an instant paraphrase of this document with our AI Paraphraser
Document Page
Wind Tip Speed Ratio 2
Introduction
The Tip Speed Ratio (TSR) is an exceptionally significant aspect during the design of a
wind turbine. TSR denotes to the relation between the speed of the wind and the speed of the tips
of the wind turbine blades (Busby, 2012, Pg.7).
TSR (λ) = Speed of the Blade Tip / Speed of the Wind.
If the blade of the wind turbine rotates too sluggishly, most of the wind will pass unserved through
the opening in the middle of the blades, consequently giving it no power! But if the blade take
tums too fast, the vanes will blur and behave like a firm barrage to the wind (Jamieson, 2018,
Pg.10). Also, propeller blades generate turmoil as they rotate through the air. If the subsequent
vane reaches too speedily, it will smash that raging air. So, occasionally it is essentially well to
slow down the vanes! The more distance away from the middle, the faster the vanes spin. Wind
turbines ought to be modelled with optimum ratios of the tip speed to attain the maximum quantity
of power from the wind.
Theory
The speed of the tip of blade is determined by the perimeter of the tip of the blade circle
(∏D) divided by the time engaged for the vane to complete a single rotation (60/Rotations Per
Minute) (Jha, 2011, Pg. 20). Thus:
vtip= πD RPM
60
The efficiency of the turbine is influenced by the Ratio of the Speed of the Tip. The Tip Speed
Ratio is the relation of the speed of the tip of the vane:
Document Page
Wind Tip Speed Ratio 3
λ= vtip
U = π D RPM
60 U ……………………………………….equation 1
In the research, we measure the output voltage, V, for a load, R and the power output is specified
by:
P0= V 2
R …………………………………….equation 2
The power coefficient Cp is known as the proportion of the power output from the generator, PO, to
the power input from the wind,
P¿=1
2 ρA U3…………………………………….equation 2
Substituting A= π D2
4 we get the Power Coefficient as:
C p= Output Power
Input Power = P0
½ ρ A U 3 = 4 V 2
½ ρ π R D2 U3 = 8 V 2
ρ π R D2 U3 ……………..equation 4
Where:
vtip blade tip speed (m/s) Rotations Per Minute
D Turbine diameter (m)
λ Ratio of the speed of the tip
U Speed of the wind (m/s)
V voltage output (V) against resistance (R) ohms
PO generator power output (W)
PIn wind power input (W)
Document Page
Wind Tip Speed Ratio 4
Cp coefficient of power
ρ Air density, assumed to be 1.2 kg/m3
Figure 1: Mujadi and Butterfield, 2000 graph
Objectives
To determine the most favorable Ratio of Tip Speed for wind turbine model.
To perform analysis of a wind tip speed ratio experiment.
Procedure/Methodology
1. The diameter of the turbine D and the resistance R were dignified and noted down.
2. With the shutter opening at 11 cm, the electrical propeller was switched on at its least setting
(1).
3. The vane revolution in rotations per minute was measured and documented.
4. The speed of the wind was measured and noted down.
5. The voltage output was measured and noted down.
tabler-icon-diamond-filled.svg

Paraphrase This Document

Need a fresh take? Get an instant paraphrase of this document with our AI Paraphraser
Document Page
Wind Tip Speed Ratio 5
6. We repeated steps 1-5 with all of the fan settings.
7. We repeated the experiments as described in steps 1-6 with the shutter gap set at 13 cm, 15 cm,
17 cm and 19 cm.
8. The results were tabulated as shown below.
The results were tabulated as shown below. We applied equations 1, 2, 3 and 4 to calculate speed
ratio, output power, input power and power coefficient respectively. The results were then tabulated
as shown below.
Results
The measured diameter and resistance was found to be 0.055 metres and 151 Ω respectively.
Shutter
gap size
Fan
setting
Blade
revolution-
RPM
Wind
speed-
m/s
Output
voltage-
V
Pin-W P0-W λ Cp
11 cm 1 0 2.1 0.00 0.0132 0 0 0
2 0 2.9 0.00 0.0348 0 0 0
3 956.1 3.6 0.33 0.0665 0.0007 0.7648 0.0108
4 1896 5.0 0.70 0.1782 0.0032 1.0920 0.0182
5 3745 7.1 1.40 0.5102 0.0130 1.5190 0.0254
13 cm 1 0 0.18 0.00 0 0 0 0
2 985 3.50 0.37 0.0611 0.0009 0.8105 0.0148
3 1692 4.60 0.66 0.1388 0.0029 1.0593 0.0208
4 2571 5.70 0.98 0.2640 0.0064 1.2989 0.0241
5 4150 7.50 1.55 0.6014 0.0149 1.5935 0.0248
15 cm 1 0 1.90 0.00 0.0098 0 0 0
2 1051 3.60 0.39 0.0655 0.0010 0.8407 0.0151
3 2431 5.20 0.91 0.2004 0.0055 1.3463 0.0274
4 4488 7.60 1.62 0.6258 0.0174 1.7006 0.0278
5 5502 8.30 1.92 0.8151 0.0244 1.9090 0.0300
17 cm 1 0 2.1 0.00 0.0132 0 0 0
Document Page
Wind Tip Speed Ratio 6
2 1069 3.7 0.40 0.0722 0.0011 0.8320 0.0147
3 1221 3.8 0.45 0.0782 0.0013 0.9253 0.0171
4 2718 5.7 1.02 0.2640 0.0069 1.3732 0.0261
5 4551 7.9 1.70 0.7028 0.0191 1.6590 0.0272
19 cm 1 0 2.3 0.00 0.0173 0 0 0
2 0 2.7 0.00 0.0281 0 0 0
3 1419 3.5 0.30 0.0611 0.0006 1.1676 0.0098
4 2825 5.2 0.88 0.2004 0.0051 1.5645 0.0256
5 6070 7.7 1.60 0.6508 0.0170 2.2702 0.0261
Analysis
From the results obtained above we were to plot the power coefficient versus tip speed ratio.
We obtained the plot as shown below.
Document Page
Wind Tip Speed Ratio 7
0 0.5 1 1.5 2 2.5
Tip speed ratio
0
0.005
0.01
0.015
0.02
0.025
0.03
power coefficient
POWER COEFFICIENT AGAINST TIP SPEED RATIO
11 CM
13 CM
15 CM
17 CM
19 CM
Figure 2: Plot of power coefficient against tip speed ratio
Discussion
From the plot as shown in figure 2 we able to validate the Mujadi and Butterfield, 2000
graph as shown in figure 1 to be valid since the two graphs were similar. It can be observed from
the plot that the best operation of the wind farm is when the tip speed ratio is greater than
approximately1.5. This is when we obtain the best performance of the wind generator. It was also
observed a shatter gap opening of 17 cm provided the best performance.
Conclusion
tabler-icon-diamond-filled.svg

Paraphrase This Document

Need a fresh take? Get an instant paraphrase of this document with our AI Paraphraser
Document Page
Wind Tip Speed Ratio 8
We conclude that the optimum operation of the wind generator is when the speed ratio is 1.9
and the corresponding power coefficient is 0.03. Therefore the objectives of the assignment were
met.
Reference
Bron̜Dsted, P., & Nijssen, R. P. L. (2013). Advances in wind turbine blade design and
materials. Oxford, Woodhead Publishing. Available from:
http://www.books24x7.com/marc.asp?bookid=68257. (Access of Date: 11th May 2018)
Busby, R. L. (2012). Wind power: the industry grows up. Tulsa, Okla, PennWell Corporation.
Jamieson, P. (2018). Innovation in wind turbine design. Available from:
http://dx.doi.org/10.1002/9781119137924. (Access of Date: 11th May 2018)
chevron_up_icon
1 out of 8
circle_padding
hide_on_mobile
zoom_out_icon
[object Object]