Treasury Wine Ltd vs Australian Vintage Ltd: A Financial Report
VerifiedAdded on 2023/03/30
|6
|1114
|335
Report
AI Summary
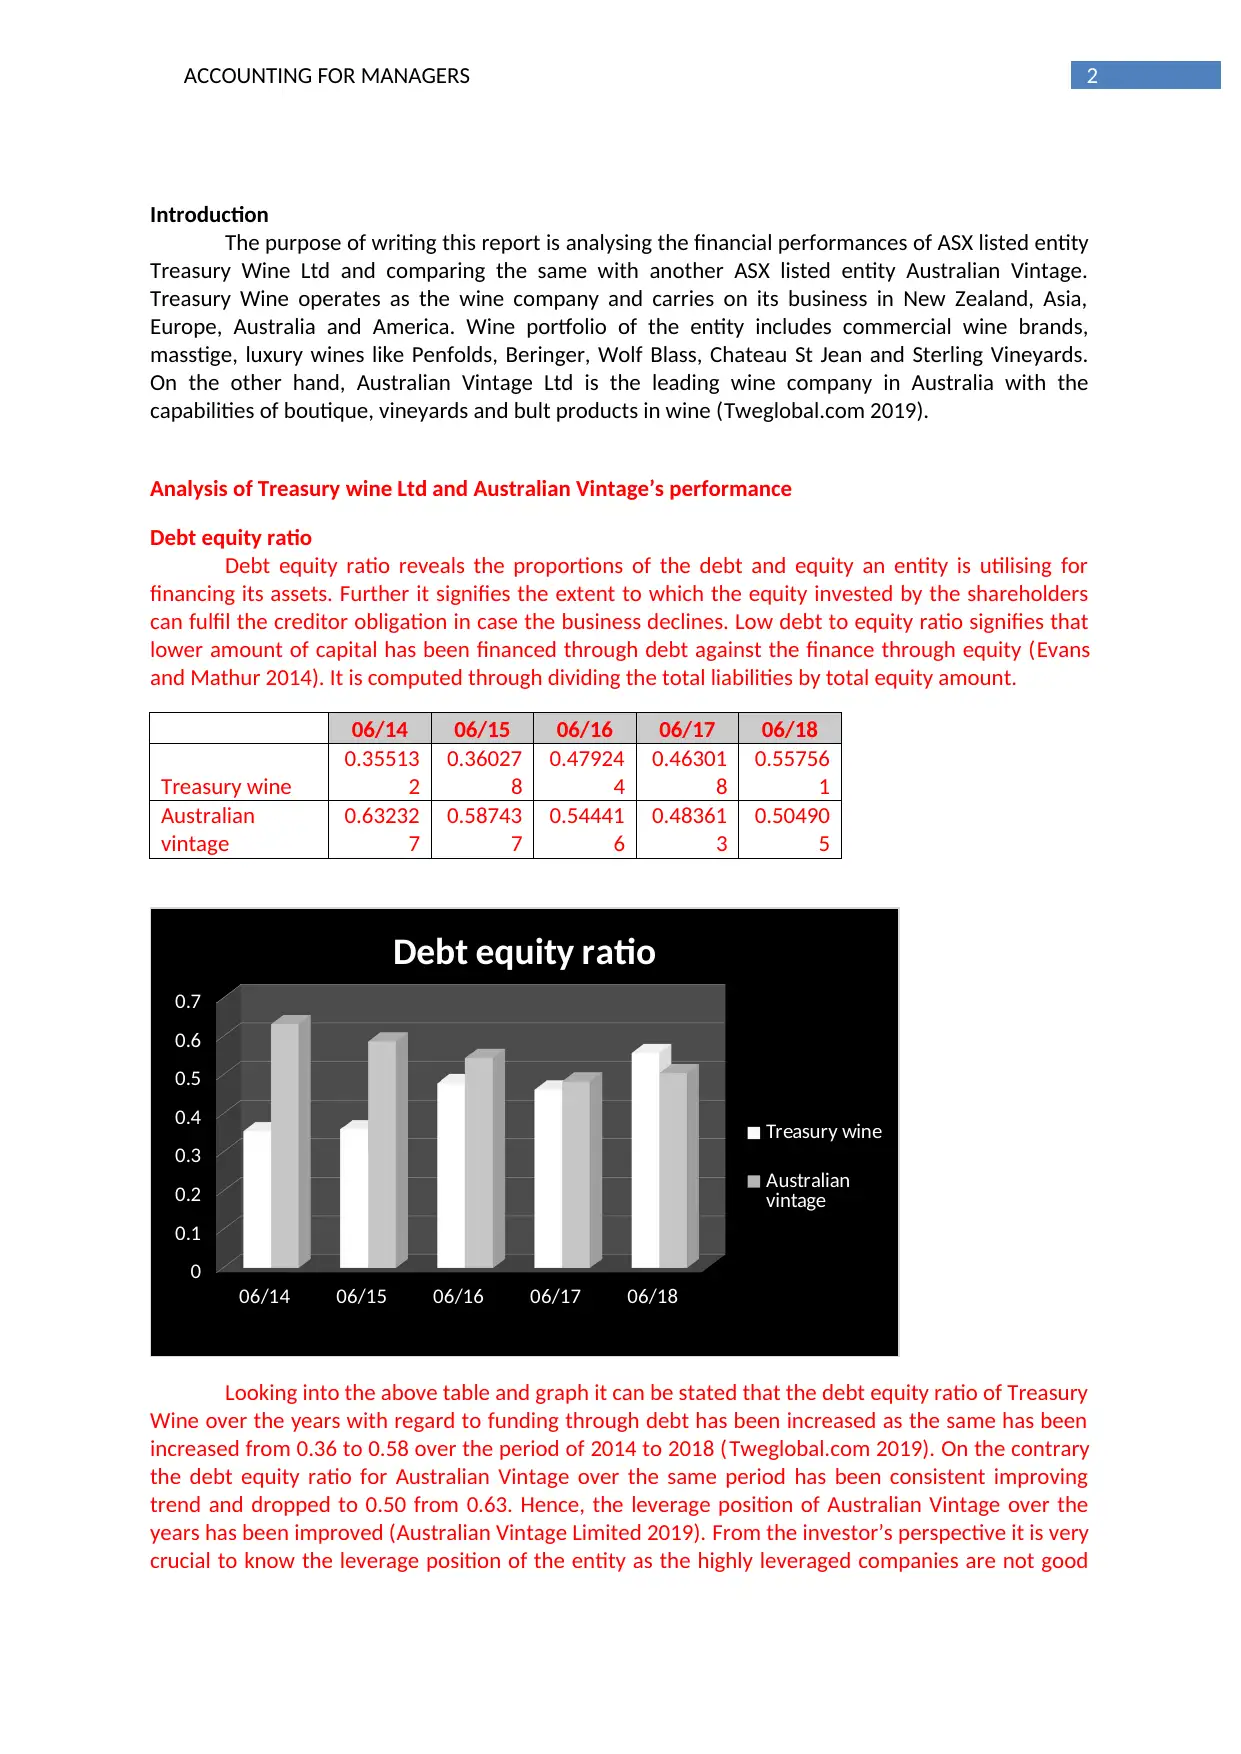
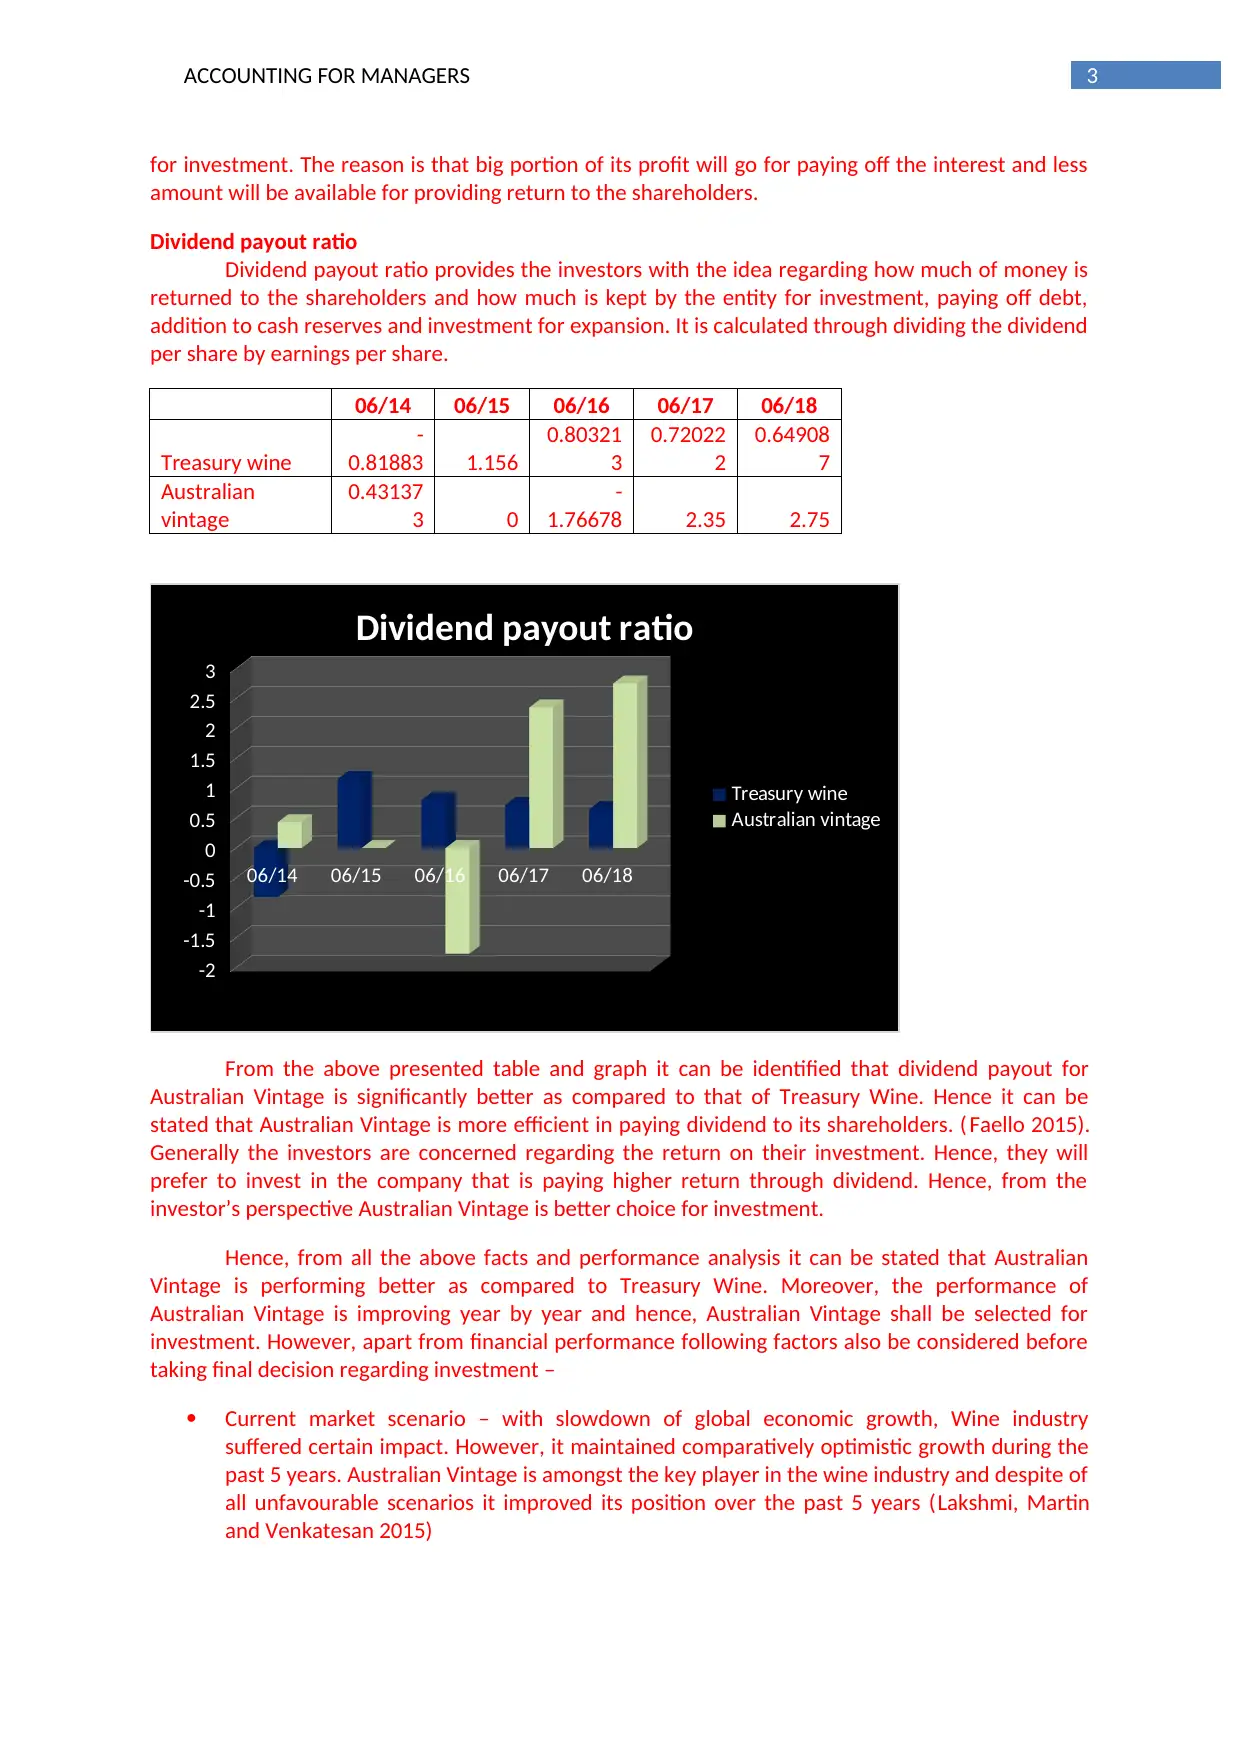
This report analyzes and compares the financial performances of Treasury Wine Ltd and Australian Vintage Ltd, both ASX-listed entities, focusing on key financial metrics such as the debt-equity ratio and dividend payout ratio. The analysis reveals that Australian Vintage has shown a consistent improvement in its debt-equity ratio, indicating a stronger leverage position compared to Treasury Wine. Furthermore, Australian Vintage exhibits a better dividend payout ratio, making it a potentially more attractive investment for shareholders seeking returns. The report also considers market conditions, dividend consistency, and future outlook, ultimately recommending Australian Vintage as the preferred investment choice based on its improving performance and stable share prices. Desklib provides access to similar past papers and solved assignments to aid students in their studies.

Running head: ACCOUNTING FOR MANAGERS
Accounting for managers
Name of the student
Name of the university
Student ID
Author note
Accounting for managers
Name of the student
Name of the university
Student ID
Author note
Paraphrase This Document
Need a fresh take? Get an instant paraphrase of this document with our AI Paraphraser

1ACCOUNTING FOR MANAGERS
Table of Contents
Introduction...........................................................................................................................................2
Analysis of Treasury wine Ltd and Australian Vintage’s performance...................................................2
Debt equity ratio...............................................................................................................................2
Dividend payout ratio........................................................................................................................3
Conclusion and recommendation.....................................................................................................4
Reference..............................................................................................................................................5

2ACCOUNTING FOR MANAGERS
Introduction
The purpose of writing this report is analysing the financial performances of ASX listed entity
Treasury Wine Ltd and comparing the same with another ASX listed entity Australian Vintage.
Treasury Wine operates as the wine company and carries on its business in New Zealand, Asia,
Europe, Australia and America. Wine portfolio of the entity includes commercial wine brands,
masstige, luxury wines like Penfolds, Beringer, Wolf Blass, Chateau St Jean and Sterling Vineyards.
On the other hand, Australian Vintage Ltd is the leading wine company in Australia with the
capabilities of boutique, vineyards and bult products in wine (Tweglobal.com 2019).
Analysis of Treasury wine Ltd and Australian Vintage’s performance
Debt equity ratio
Debt equity ratio reveals the proportions of the debt and equity an entity is utilising for
financing its assets. Further it signifies the extent to which the equity invested by the shareholders
can fulfil the creditor obligation in case the business declines. Low debt to equity ratio signifies that
lower amount of capital has been financed through debt against the finance through equity (Evans
and Mathur 2014). It is computed through dividing the total liabilities by total equity amount.
06/14 06/15 06/16 06/17 06/18
Treasury wine
0.35513
2
0.36027
8
0.47924
4
0.46301
8
0.55756
1
Australian
vintage
0.63232
7
0.58743
7
0.54441
6
0.48361
3
0.50490
5
06/14 06/15 06/16 06/17 06/18
0
0.1
0.2
0.3
0.4
0.5
0.6
0.7
Debt equity ratio
Treasury wine
Australian
vintage
Looking into the above table and graph it can be stated that the debt equity ratio of Treasury
Wine over the years with regard to funding through debt has been increased as the same has been
increased from 0.36 to 0.58 over the period of 2014 to 2018 (Tweglobal.com 2019). On the contrary
the debt equity ratio for Australian Vintage over the same period has been consistent improving
trend and dropped to 0.50 from 0.63. Hence, the leverage position of Australian Vintage over the
years has been improved (Australian Vintage Limited 2019). From the investor’s perspective it is very
crucial to know the leverage position of the entity as the highly leveraged companies are not good
⊘ This is a preview!⊘
Do you want full access?
Subscribe today to unlock all pages.

Trusted by 1+ million students worldwide

3ACCOUNTING FOR MANAGERS
for investment. The reason is that big portion of its profit will go for paying off the interest and less
amount will be available for providing return to the shareholders.
Dividend payout ratio
Dividend payout ratio provides the investors with the idea regarding how much of money is
returned to the shareholders and how much is kept by the entity for investment, paying off debt,
addition to cash reserves and investment for expansion. It is calculated through dividing the dividend
per share by earnings per share.
06/14 06/15 06/16 06/17 06/18
Treasury wine
-
0.81883 1.156
0.80321
3
0.72022
2
0.64908
7
Australian
vintage
0.43137
3 0
-
1.76678 2.35 2.75
06/14 06/15 06/16 06/17 06/18
-2
-1.5
-1
-0.5
0
0.5
1
1.5
2
2.5
3
Dividend payout ratio
Treasury wine
Australian vintage
From the above presented table and graph it can be identified that dividend payout for
Australian Vintage is significantly better as compared to that of Treasury Wine. Hence it can be
stated that Australian Vintage is more efficient in paying dividend to its shareholders. ( Faello 2015).
Generally the investors are concerned regarding the return on their investment. Hence, they will
prefer to invest in the company that is paying higher return through dividend. Hence, from the
investor’s perspective Australian Vintage is better choice for investment.
Hence, from all the above facts and performance analysis it can be stated that Australian
Vintage is performing better as compared to Treasury Wine. Moreover, the performance of
Australian Vintage is improving year by year and hence, Australian Vintage shall be selected for
investment. However, apart from financial performance following factors also be considered before
taking final decision regarding investment –
Current market scenario – with slowdown of global economic growth, Wine industry
suffered certain impact. However, it maintained comparatively optimistic growth during the
past 5 years. Australian Vintage is amongst the key player in the wine industry and despite of
all unfavourable scenarios it improved its position over the past 5 years (Lakshmi, Martin
and Venkatesan 2015)
Paraphrase This Document
Need a fresh take? Get an instant paraphrase of this document with our AI Paraphraser

4ACCOUNTING FOR MANAGERS
Dividend – the company is improving in terms of paying dividend to its shareholders and
regular in paying dividend to its shareholders. Over the last 5 years the dividend per share
has been increased to $2.75 per share from 0.43 cents per share (Tweglobal.com 2019).
Future outlook – the company has received lot of attention owing to its considerable
increase in share price over last few months. Further, the shares of the company at presents
are seemed to be priced correctly. Moreover the share prices are stable as compared to
other companies in market and the same is indicated through lower beta. It signifies that it is
less likely that the shares will not fall lower than the natural market volatility (St 2018)
Conclusion and recommendation
From the above presented data it can be identified that the performance of Australian
Vintage is better and improving trend in all aspects those are generally analysed by the investors
before investing as compared to Treasury Wine. Further, the market condition as well as the
dividend payment records of the company is consistent. Moreover, the share prices have
considerably increased during the last few months that is also indicating the improved performance.
Hence, it is recommended that Australian Vintage shall be chosen for investment over Australian
Vintage.

5ACCOUNTING FOR MANAGERS
Reference
Australian Vintage Limited. 2019. Home - Australian Vintage Limited. [online] Available at:
https://www.australianvintage.com.au/ [Accessed 31 May 2019].
Evans, J.R. and Mathur, A., 2014. Retailing and the period leading up to the Great Recession: a model
and a 25-year financial ratio analysis of US retailing. The International Review of Retail, Distribution
and Consumer Research, 24(1), pp.30-58.
Faello, J., 2015. Understanding the limitations of financial ratios. Academy of Accounting and
Financial Studies Journal, 19(3), p.75.
Lakshmi, T.M., Martin, A. and Venkatesan, V.P., 2015. A genetic bankrupt ratio analysis tool using a
genetic algorithm to identify influencing financial ratios. IEEE Transactions on Evolutionary
Computation, 20(1), pp.38-51.
St, S. 2018. At $0.64, Is Australian Vintage Ltd (ASX:AVG) A Buy?. [online] Simply Wall St. Available
at: https://simplywall.st/stocks/au/food-beverage-tobacco/asx-avg/australian-vintage-shares/
news/at-0-64-is-australian-vintage-ltd-asxavg-a-buy/ [Accessed 1 Jun. 2019].
Tweglobal.com. 2019. Home - Treasury Wine Estates . [online] Available at:
https://www.tweglobal.com/ [Accessed 31 May 2019].
⊘ This is a preview!⊘
Do you want full access?
Subscribe today to unlock all pages.

Trusted by 1+ million students worldwide
1 out of 6
Related Documents

Your All-in-One AI-Powered Toolkit for Academic Success.
+13062052269
info@desklib.com
Available 24*7 on WhatsApp / Email
Unlock your academic potential
Copyright © 2020–2025 A2Z Services. All Rights Reserved. Developed and managed by ZUCOL.