University Report: Data Management and Wine Consumption in New Zealand
VerifiedAdded on 2022/08/20
|11
|3015
|12
Report
AI Summary
This report, titled "Data Management for Business Success," examines the factors influencing wine consumption in New Zealand. The study investigates the declining trend in wine consumption, analyzing market data and consumer behavior. The research includes an introduction providing background on the wine industry in New Zealand, highlighting the shift in consumer preferences, and the dominance of beer consumption. It identifies the research problem as the decrease in wine consumption and outlines research objectives, questions, and hypotheses. The methodology section details the research philosophy (positivism) and approach (deductive), along with the use of a survey questionnaire for primary data collection. The study employs SPSS for data analysis, utilizing descriptive and inferential statistics, including correlation and regression analysis. The report also outlines the population and sampling methods, including sample size calculation and the use of simple random sampling. The analysis focuses on independent variables such as demographic factors, price points, and brand recognition, and their impact on wine consumption, the dependent variable. Finally, the research plan is outlined, detailing the timeline for each stage of the project, from topic selection to the final report submission.
Running head: DATA MANAGEMENT FOR BUSINESS SUCCESS
Data Management for Business Success
Name of the student
Name of the university
Author note
Data Management for Business Success
Name of the student
Name of the university
Author note
Paraphrase This Document
Need a fresh take? Get an instant paraphrase of this document with our AI Paraphraser
1DATA MANAGEMENT FOR BUSINESS SUCCESS
Topic: The factor affecting the wine consumption of people in New Zealand
1.0 Introduction
1.1 Background of the study
The current global industry is fast paced with significant changes in the buying behaviour
of the consumers. Consumers are changing their behaviour and attitudes significantly which
affects all the industries. Wine industry had been booming in the past decade due to the wine
culture followed by the Kiwis. However, the current market shows that there has been significant
decrease in the wine consumption in the past few years. Alcohol and wine is a multi-billion
dollar industry where it can be seen that various alcoholic drinks were available for domestic
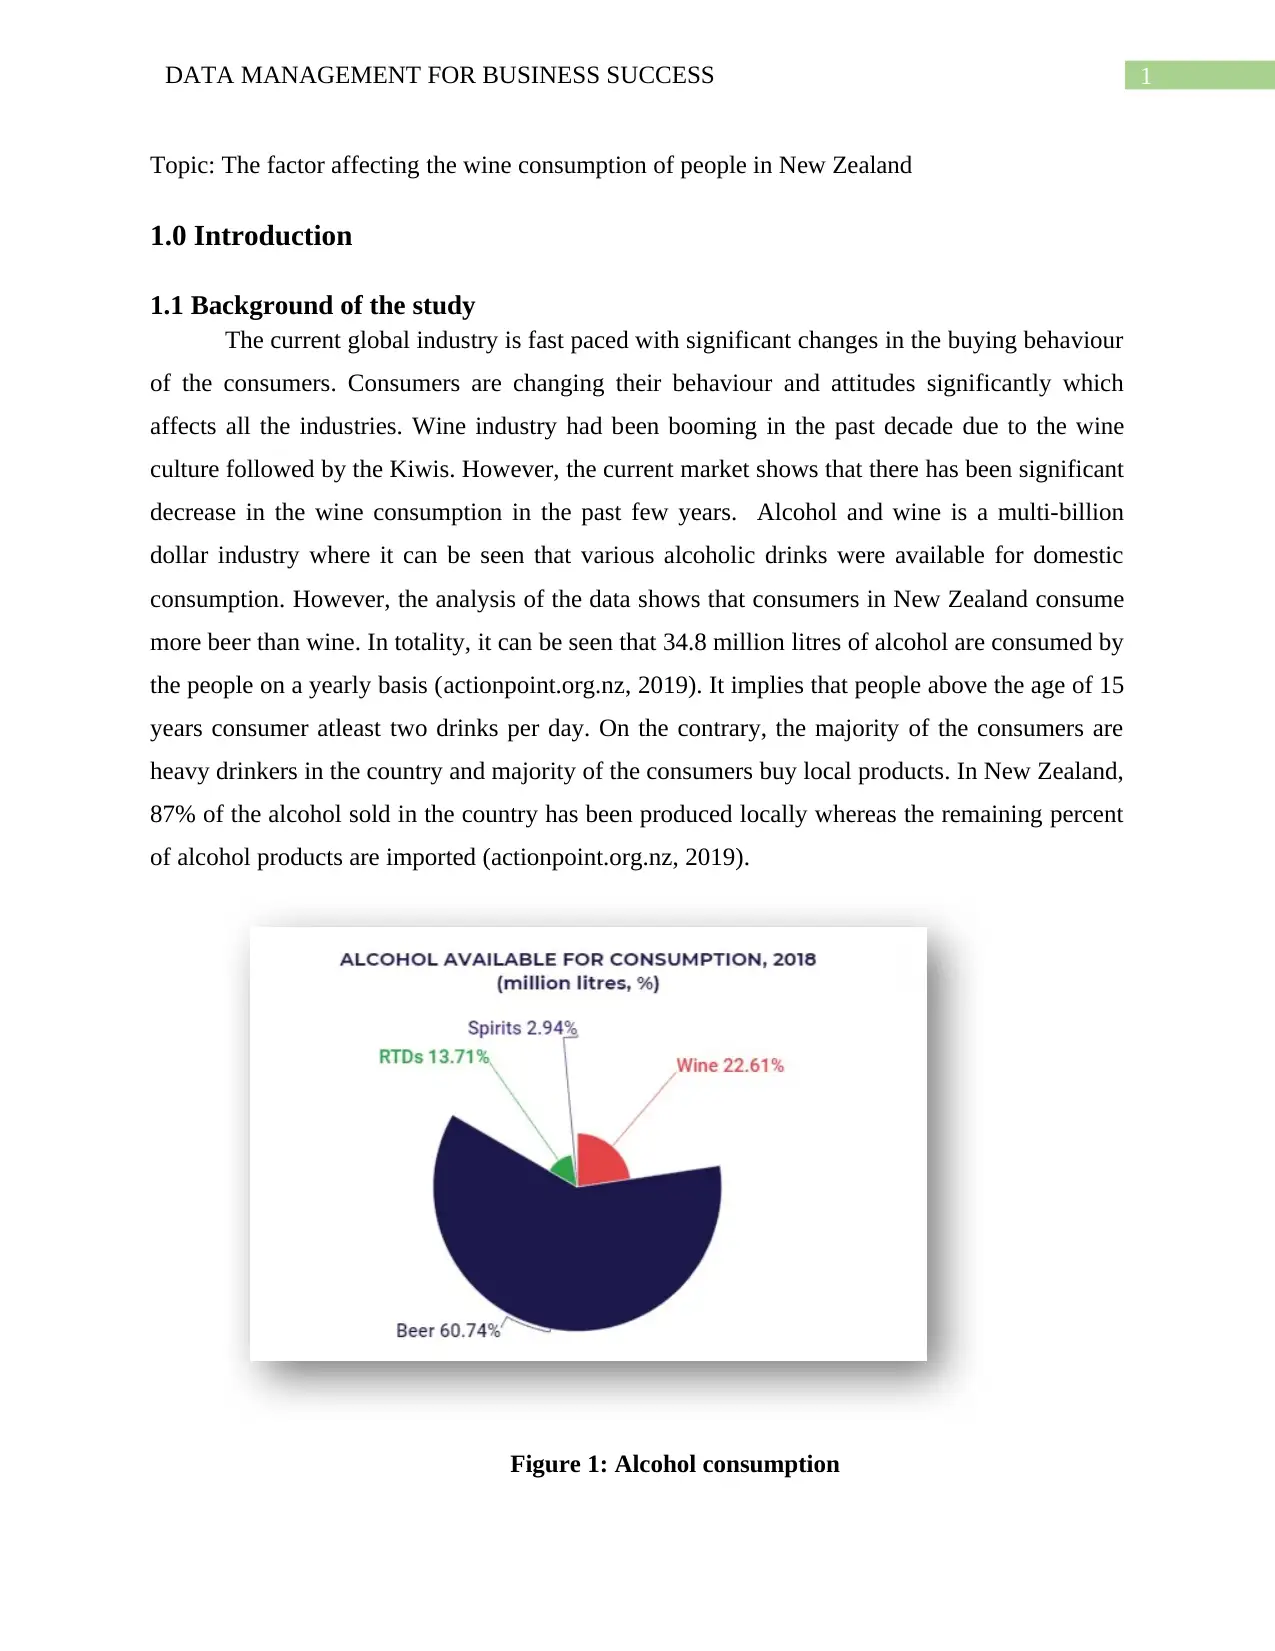
consumption. However, the analysis of the data shows that consumers in New Zealand consume
more beer than wine. In totality, it can be seen that 34.8 million litres of alcohol are consumed by
the people on a yearly basis (actionpoint.org.nz, 2019). It implies that people above the age of 15
years consumer atleast two drinks per day. On the contrary, the majority of the consumers are
heavy drinkers in the country and majority of the consumers buy local products. In New Zealand,
87% of the alcohol sold in the country has been produced locally whereas the remaining percent
of alcohol products are imported (actionpoint.org.nz, 2019).
Figure 1: Alcohol consumption
Topic: The factor affecting the wine consumption of people in New Zealand
1.0 Introduction
1.1 Background of the study
The current global industry is fast paced with significant changes in the buying behaviour
of the consumers. Consumers are changing their behaviour and attitudes significantly which
affects all the industries. Wine industry had been booming in the past decade due to the wine
culture followed by the Kiwis. However, the current market shows that there has been significant
decrease in the wine consumption in the past few years. Alcohol and wine is a multi-billion
dollar industry where it can be seen that various alcoholic drinks were available for domestic
consumption. However, the analysis of the data shows that consumers in New Zealand consume
more beer than wine. In totality, it can be seen that 34.8 million litres of alcohol are consumed by
the people on a yearly basis (actionpoint.org.nz, 2019). It implies that people above the age of 15
years consumer atleast two drinks per day. On the contrary, the majority of the consumers are
heavy drinkers in the country and majority of the consumers buy local products. In New Zealand,
87% of the alcohol sold in the country has been produced locally whereas the remaining percent
of alcohol products are imported (actionpoint.org.nz, 2019).
Figure 1: Alcohol consumption
2DATA MANAGEMENT FOR BUSINESS SUCCESS
Source: (actionpoint.org.nz, 2019)
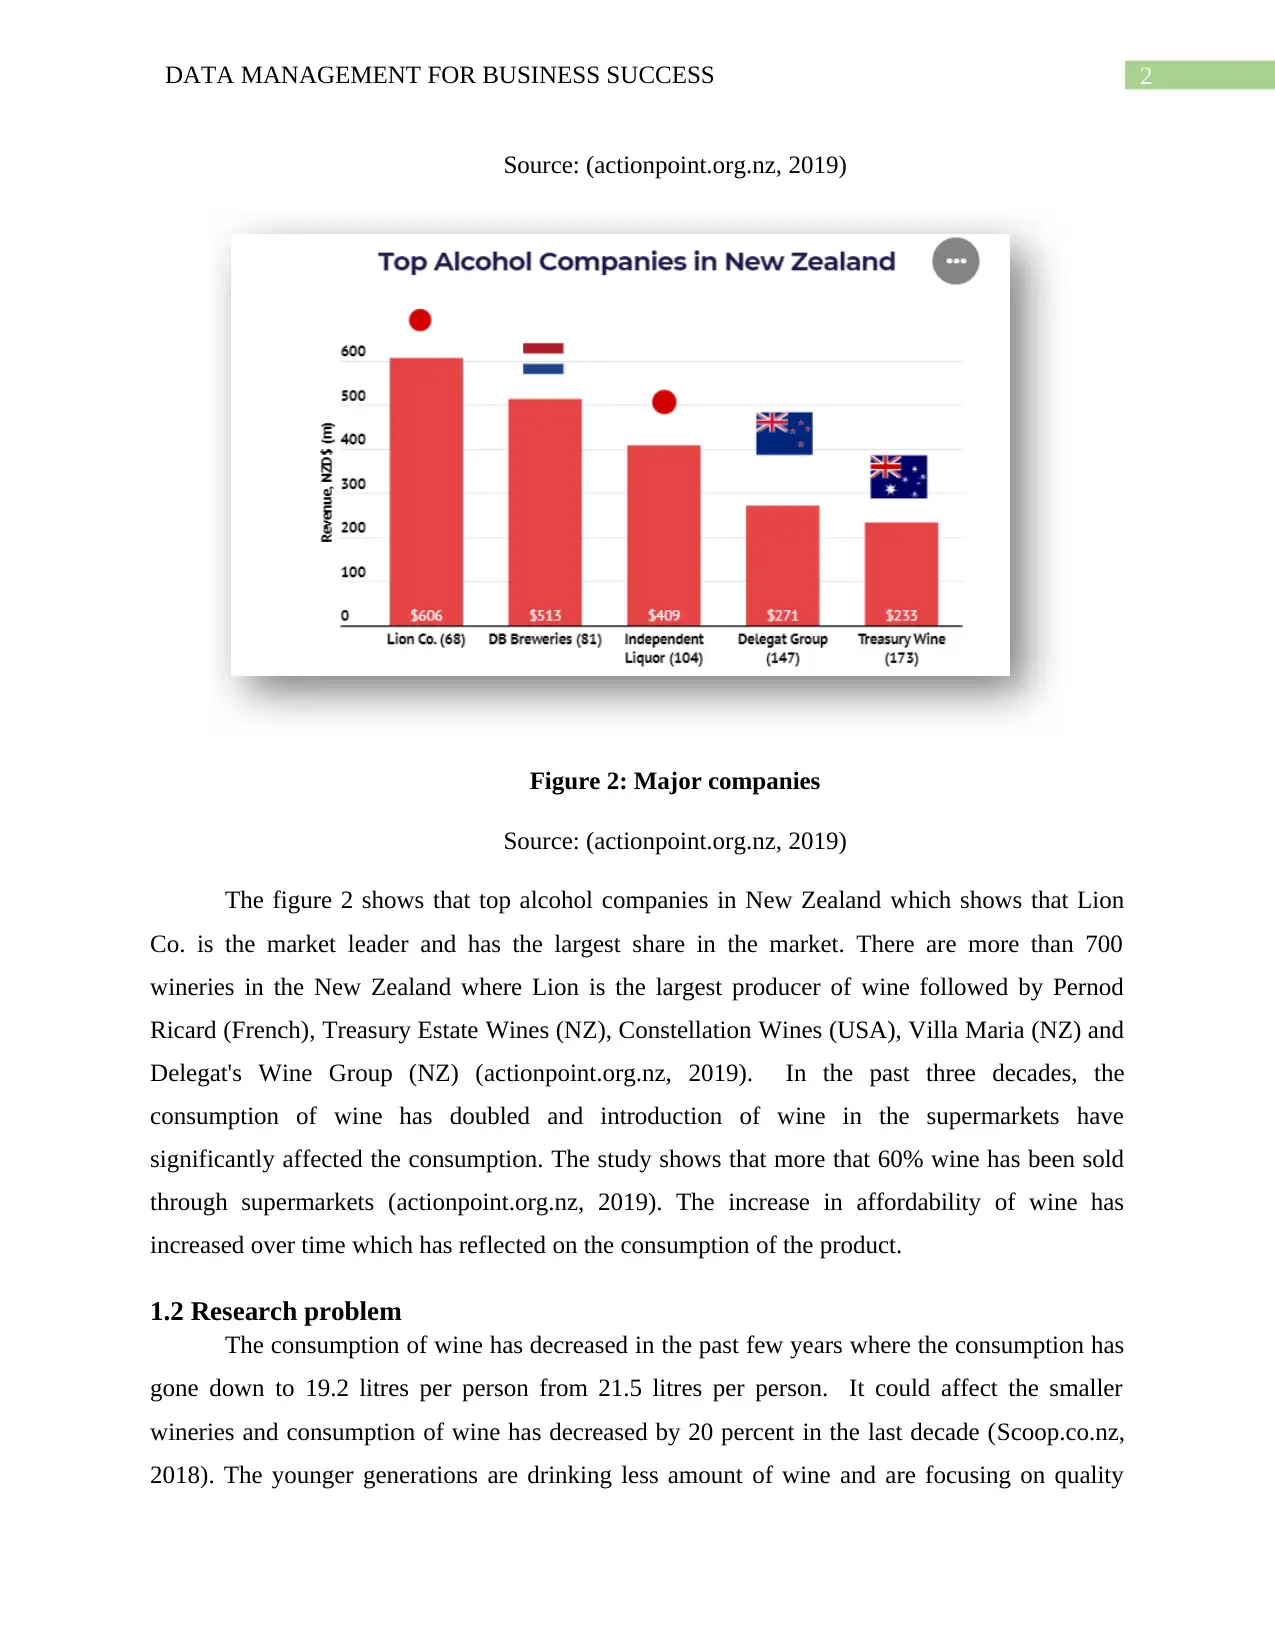
Figure 2: Major companies
Source: (actionpoint.org.nz, 2019)
The figure 2 shows that top alcohol companies in New Zealand which shows that Lion
Co. is the market leader and has the largest share in the market. There are more than 700
wineries in the New Zealand where Lion is the largest producer of wine followed by Pernod
Ricard (French), Treasury Estate Wines (NZ), Constellation Wines (USA), Villa Maria (NZ) and
Delegat's Wine Group (NZ) (actionpoint.org.nz, 2019). In the past three decades, the
consumption of wine has doubled and introduction of wine in the supermarkets have
significantly affected the consumption. The study shows that more that 60% wine has been sold
through supermarkets (actionpoint.org.nz, 2019). The increase in affordability of wine has
increased over time which has reflected on the consumption of the product.
1.2 Research problem
The consumption of wine has decreased in the past few years where the consumption has
gone down to 19.2 litres per person from 21.5 litres per person. It could affect the smaller
wineries and consumption of wine has decreased by 20 percent in the last decade (Scoop.co.nz,
2018). The younger generations are drinking less amount of wine and are focusing on quality
Source: (actionpoint.org.nz, 2019)
Figure 2: Major companies
Source: (actionpoint.org.nz, 2019)
The figure 2 shows that top alcohol companies in New Zealand which shows that Lion
Co. is the market leader and has the largest share in the market. There are more than 700
wineries in the New Zealand where Lion is the largest producer of wine followed by Pernod
Ricard (French), Treasury Estate Wines (NZ), Constellation Wines (USA), Villa Maria (NZ) and
Delegat's Wine Group (NZ) (actionpoint.org.nz, 2019). In the past three decades, the
consumption of wine has doubled and introduction of wine in the supermarkets have
significantly affected the consumption. The study shows that more that 60% wine has been sold
through supermarkets (actionpoint.org.nz, 2019). The increase in affordability of wine has
increased over time which has reflected on the consumption of the product.
1.2 Research problem
The consumption of wine has decreased in the past few years where the consumption has
gone down to 19.2 litres per person from 21.5 litres per person. It could affect the smaller
wineries and consumption of wine has decreased by 20 percent in the last decade (Scoop.co.nz,
2018). The younger generations are drinking less amount of wine and are focusing on quality
⊘ This is a preview!⊘
Do you want full access?
Subscribe today to unlock all pages.
Trusted by 1+ million students worldwide
3DATA MANAGEMENT FOR BUSINESS SUCCESS
over quantity. The kiwi wine and vineyard exports is going through flow-on-effect. A survey
shows that the wine consumption among the younger generation are quite less when compared to
the older generation which is significantly affecting the industry (Wilkins, 2018). Even though
the industry is growing, the changing in consumption behaviour has been significantly affecting
the industry which makes it necessary to evaluate the factors affecting the perception and attitude
of the consumers towards wine consumption in the New Zealand.
1.3 Research objectives
In light of the identified research problem, the following objectives have been stated and
chosen for evaluation:
To examine the factors affecting the consumption of wine in New Zealand
To identify the role of demographic factors in affecting the consumption of wine.
To recommend suitable strategies to positively influence the consumption of wine in the
market
1.4 Research questions
What are the factors affecting the consumption of wine in New Zealand?
What is the role of demographic factors in affecting the consumption of wine?
1.5 Research hypothesis
H01: Demographic factors does not have any influence on consumption of wine
H11: Demographic factors have a significant influence on consumption of wine
H02: Price points does not have any influence on consumption of wine
H12: Price points does have a noteworthy influence on consumption of wine
H03: Brand recognition does not have any influence on consumption of wine
H13: Brand recognition have positive influence on consumption of wine
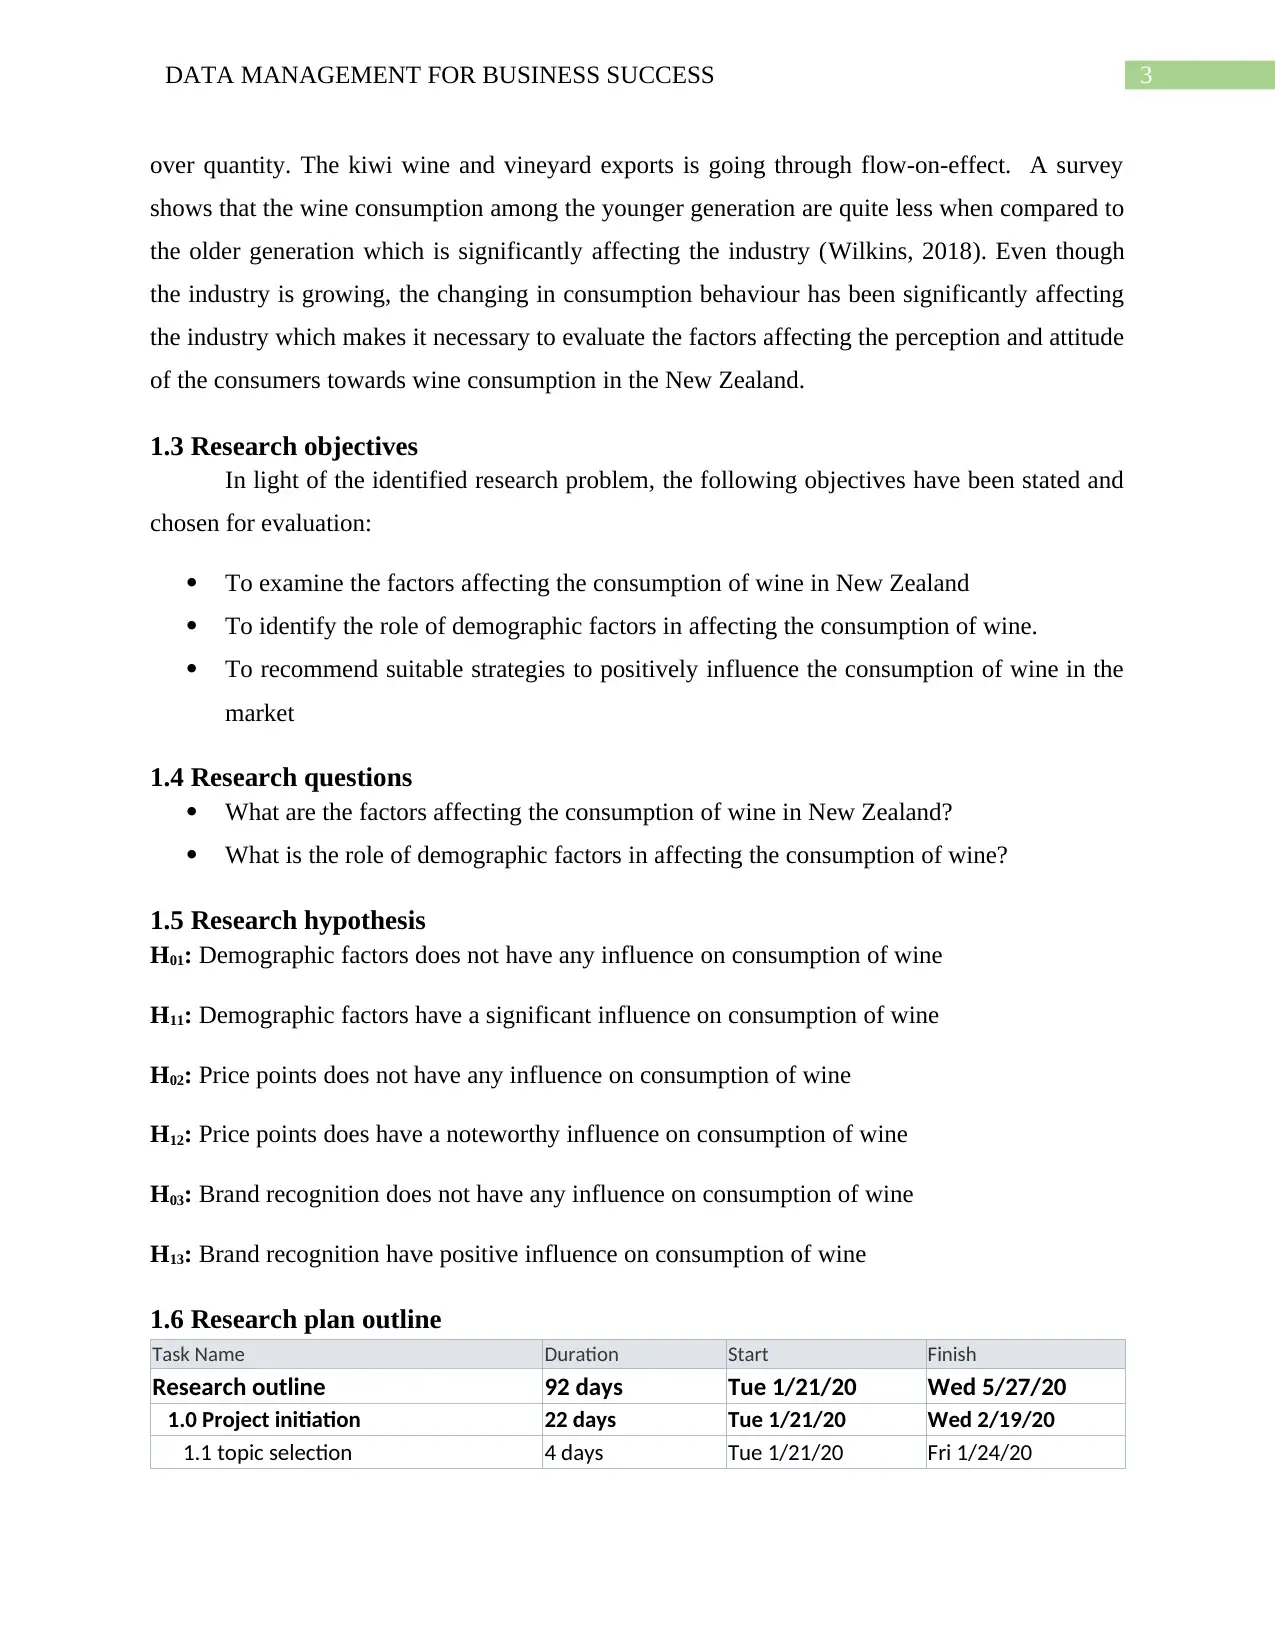
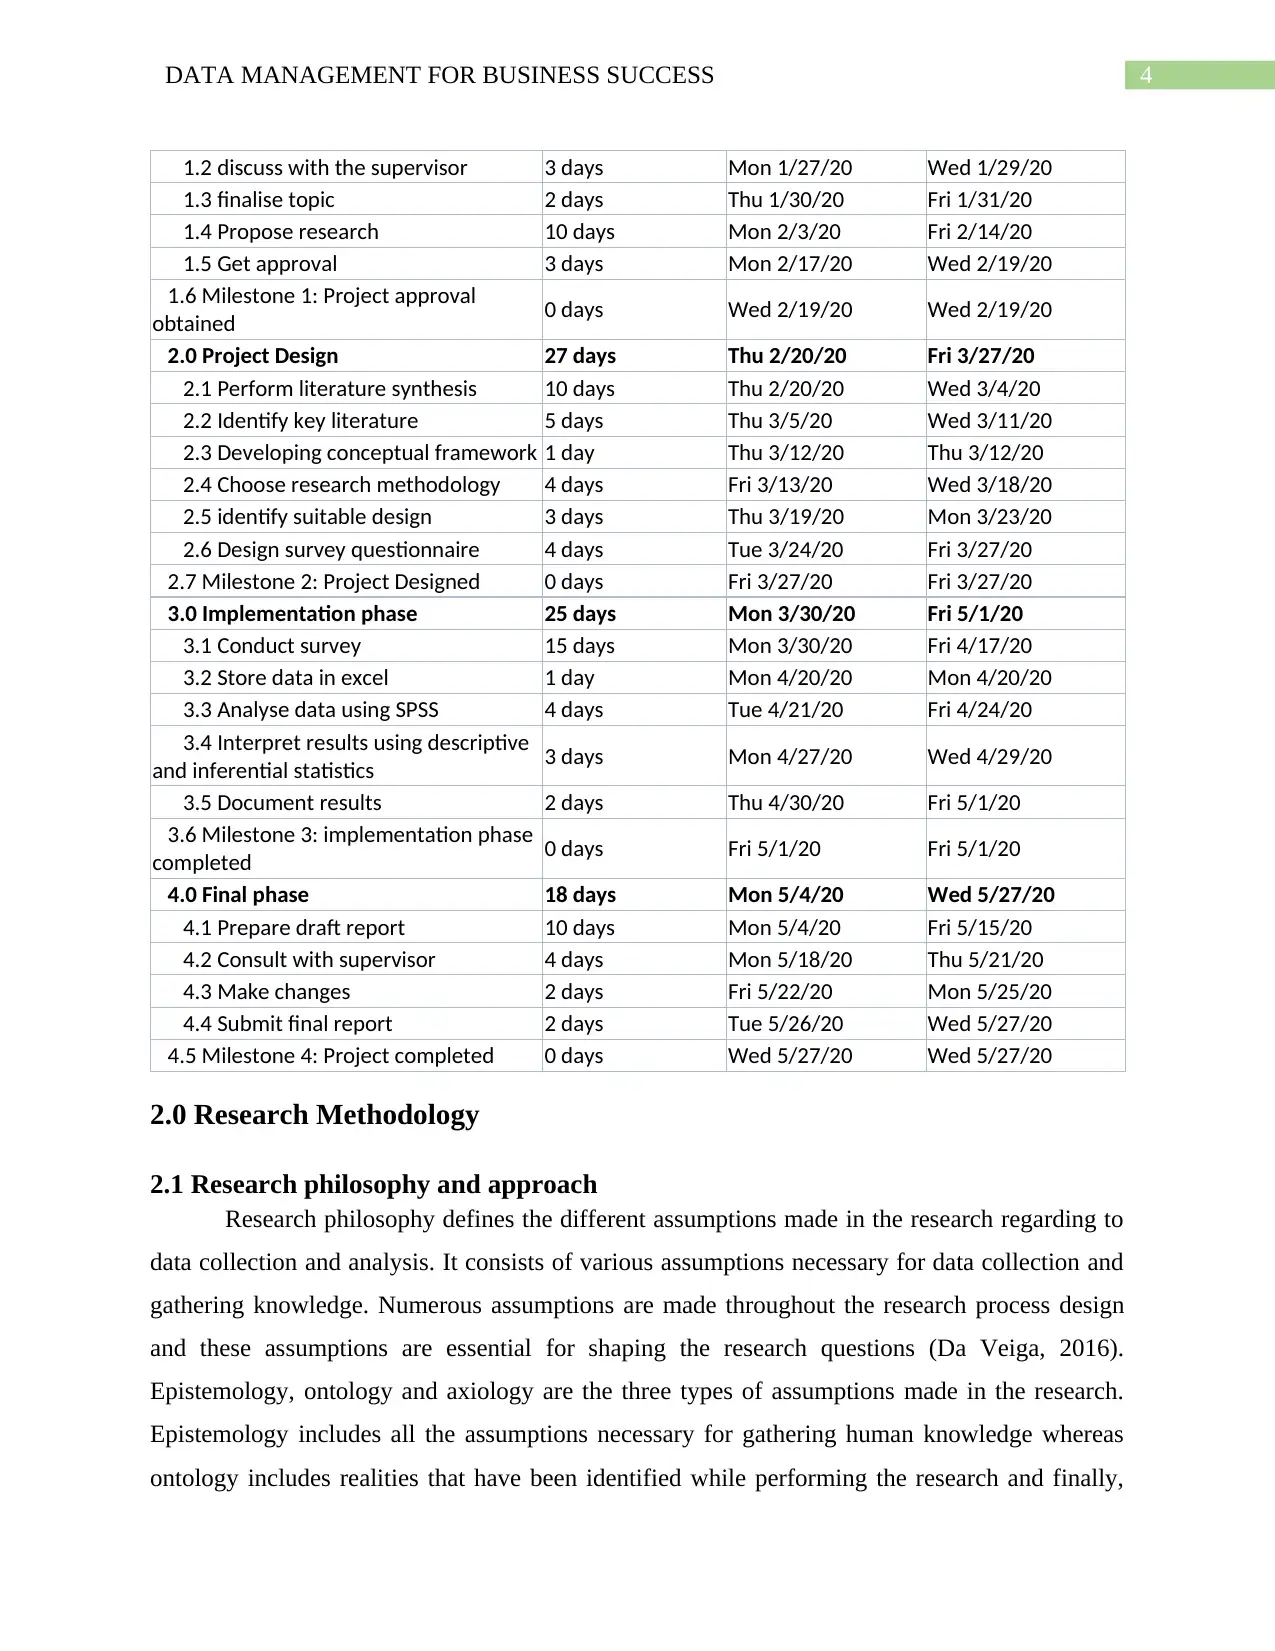
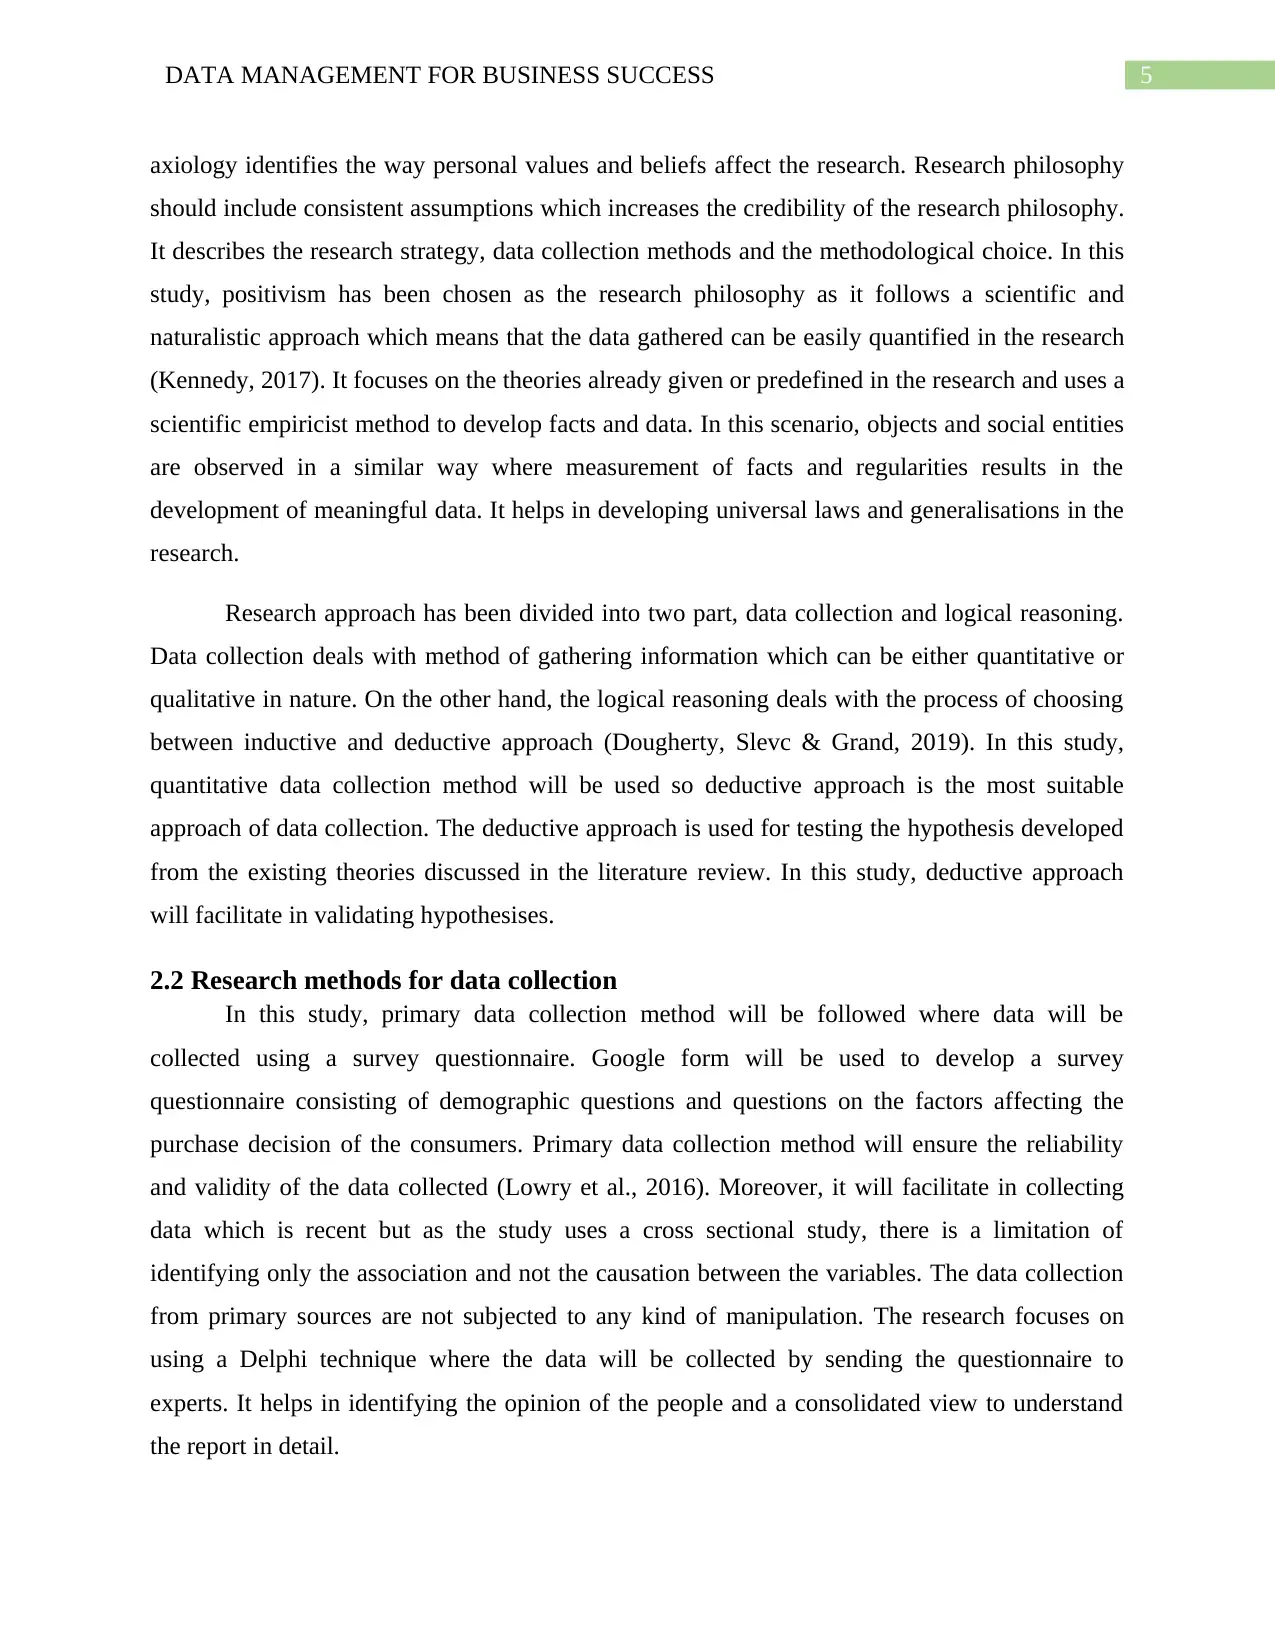
1.6 Research plan outline
Task Name Duration Start Finish
Research outline 92 days Tue 1/21/20 Wed 5/27/20
1.0 Project initiation 22 days Tue 1/21/20 Wed 2/19/20
1.1 topic selection 4 days Tue 1/21/20 Fri 1/24/20
over quantity. The kiwi wine and vineyard exports is going through flow-on-effect. A survey
shows that the wine consumption among the younger generation are quite less when compared to
the older generation which is significantly affecting the industry (Wilkins, 2018). Even though
the industry is growing, the changing in consumption behaviour has been significantly affecting
the industry which makes it necessary to evaluate the factors affecting the perception and attitude
of the consumers towards wine consumption in the New Zealand.
1.3 Research objectives
In light of the identified research problem, the following objectives have been stated and
chosen for evaluation:
To examine the factors affecting the consumption of wine in New Zealand
To identify the role of demographic factors in affecting the consumption of wine.
To recommend suitable strategies to positively influence the consumption of wine in the
market
1.4 Research questions
What are the factors affecting the consumption of wine in New Zealand?
What is the role of demographic factors in affecting the consumption of wine?
1.5 Research hypothesis
H01: Demographic factors does not have any influence on consumption of wine
H11: Demographic factors have a significant influence on consumption of wine
H02: Price points does not have any influence on consumption of wine
H12: Price points does have a noteworthy influence on consumption of wine
H03: Brand recognition does not have any influence on consumption of wine
H13: Brand recognition have positive influence on consumption of wine
1.6 Research plan outline
Task Name Duration Start Finish
Research outline 92 days Tue 1/21/20 Wed 5/27/20
1.0 Project initiation 22 days Tue 1/21/20 Wed 2/19/20
1.1 topic selection 4 days Tue 1/21/20 Fri 1/24/20
Paraphrase This Document
Need a fresh take? Get an instant paraphrase of this document with our AI Paraphraser
4DATA MANAGEMENT FOR BUSINESS SUCCESS
1.2 discuss with the supervisor 3 days Mon 1/27/20 Wed 1/29/20
1.3 finalise topic 2 days Thu 1/30/20 Fri 1/31/20
1.4 Propose research 10 days Mon 2/3/20 Fri 2/14/20
1.5 Get approval 3 days Mon 2/17/20 Wed 2/19/20
1.6 Milestone 1: Project approval
obtained 0 days Wed 2/19/20 Wed 2/19/20
2.0 Project Design 27 days Thu 2/20/20 Fri 3/27/20
2.1 Perform literature synthesis 10 days Thu 2/20/20 Wed 3/4/20
2.2 Identify key literature 5 days Thu 3/5/20 Wed 3/11/20
2.3 Developing conceptual framework 1 day Thu 3/12/20 Thu 3/12/20
2.4 Choose research methodology 4 days Fri 3/13/20 Wed 3/18/20
2.5 identify suitable design 3 days Thu 3/19/20 Mon 3/23/20
2.6 Design survey questionnaire 4 days Tue 3/24/20 Fri 3/27/20
2.7 Milestone 2: Project Designed 0 days Fri 3/27/20 Fri 3/27/20
3.0 Implementation phase 25 days Mon 3/30/20 Fri 5/1/20
3.1 Conduct survey 15 days Mon 3/30/20 Fri 4/17/20
3.2 Store data in excel 1 day Mon 4/20/20 Mon 4/20/20
3.3 Analyse data using SPSS 4 days Tue 4/21/20 Fri 4/24/20
3.4 Interpret results using descriptive
and inferential statistics 3 days Mon 4/27/20 Wed 4/29/20
3.5 Document results 2 days Thu 4/30/20 Fri 5/1/20
3.6 Milestone 3: implementation phase
completed 0 days Fri 5/1/20 Fri 5/1/20
4.0 Final phase 18 days Mon 5/4/20 Wed 5/27/20
4.1 Prepare draft report 10 days Mon 5/4/20 Fri 5/15/20
4.2 Consult with supervisor 4 days Mon 5/18/20 Thu 5/21/20
4.3 Make changes 2 days Fri 5/22/20 Mon 5/25/20
4.4 Submit final report 2 days Tue 5/26/20 Wed 5/27/20
4.5 Milestone 4: Project completed 0 days Wed 5/27/20 Wed 5/27/20
2.0 Research Methodology
2.1 Research philosophy and approach
Research philosophy defines the different assumptions made in the research regarding to
data collection and analysis. It consists of various assumptions necessary for data collection and
gathering knowledge. Numerous assumptions are made throughout the research process design
and these assumptions are essential for shaping the research questions (Da Veiga, 2016).
Epistemology, ontology and axiology are the three types of assumptions made in the research.
Epistemology includes all the assumptions necessary for gathering human knowledge whereas
ontology includes realities that have been identified while performing the research and finally,
5DATA MANAGEMENT FOR BUSINESS SUCCESS
axiology identifies the way personal values and beliefs affect the research. Research philosophy
should include consistent assumptions which increases the credibility of the research philosophy.
It describes the research strategy, data collection methods and the methodological choice. In this
study, positivism has been chosen as the research philosophy as it follows a scientific and
naturalistic approach which means that the data gathered can be easily quantified in the research
(Kennedy, 2017). It focuses on the theories already given or predefined in the research and uses a
scientific empiricist method to develop facts and data. In this scenario, objects and social entities
are observed in a similar way where measurement of facts and regularities results in the
development of meaningful data. It helps in developing universal laws and generalisations in the
research.
Research approach has been divided into two part, data collection and logical reasoning.
Data collection deals with method of gathering information which can be either quantitative or
qualitative in nature. On the other hand, the logical reasoning deals with the process of choosing
between inductive and deductive approach (Dougherty, Slevc & Grand, 2019). In this study,
quantitative data collection method will be used so deductive approach is the most suitable
approach of data collection. The deductive approach is used for testing the hypothesis developed
from the existing theories discussed in the literature review. In this study, deductive approach
will facilitate in validating hypothesises.
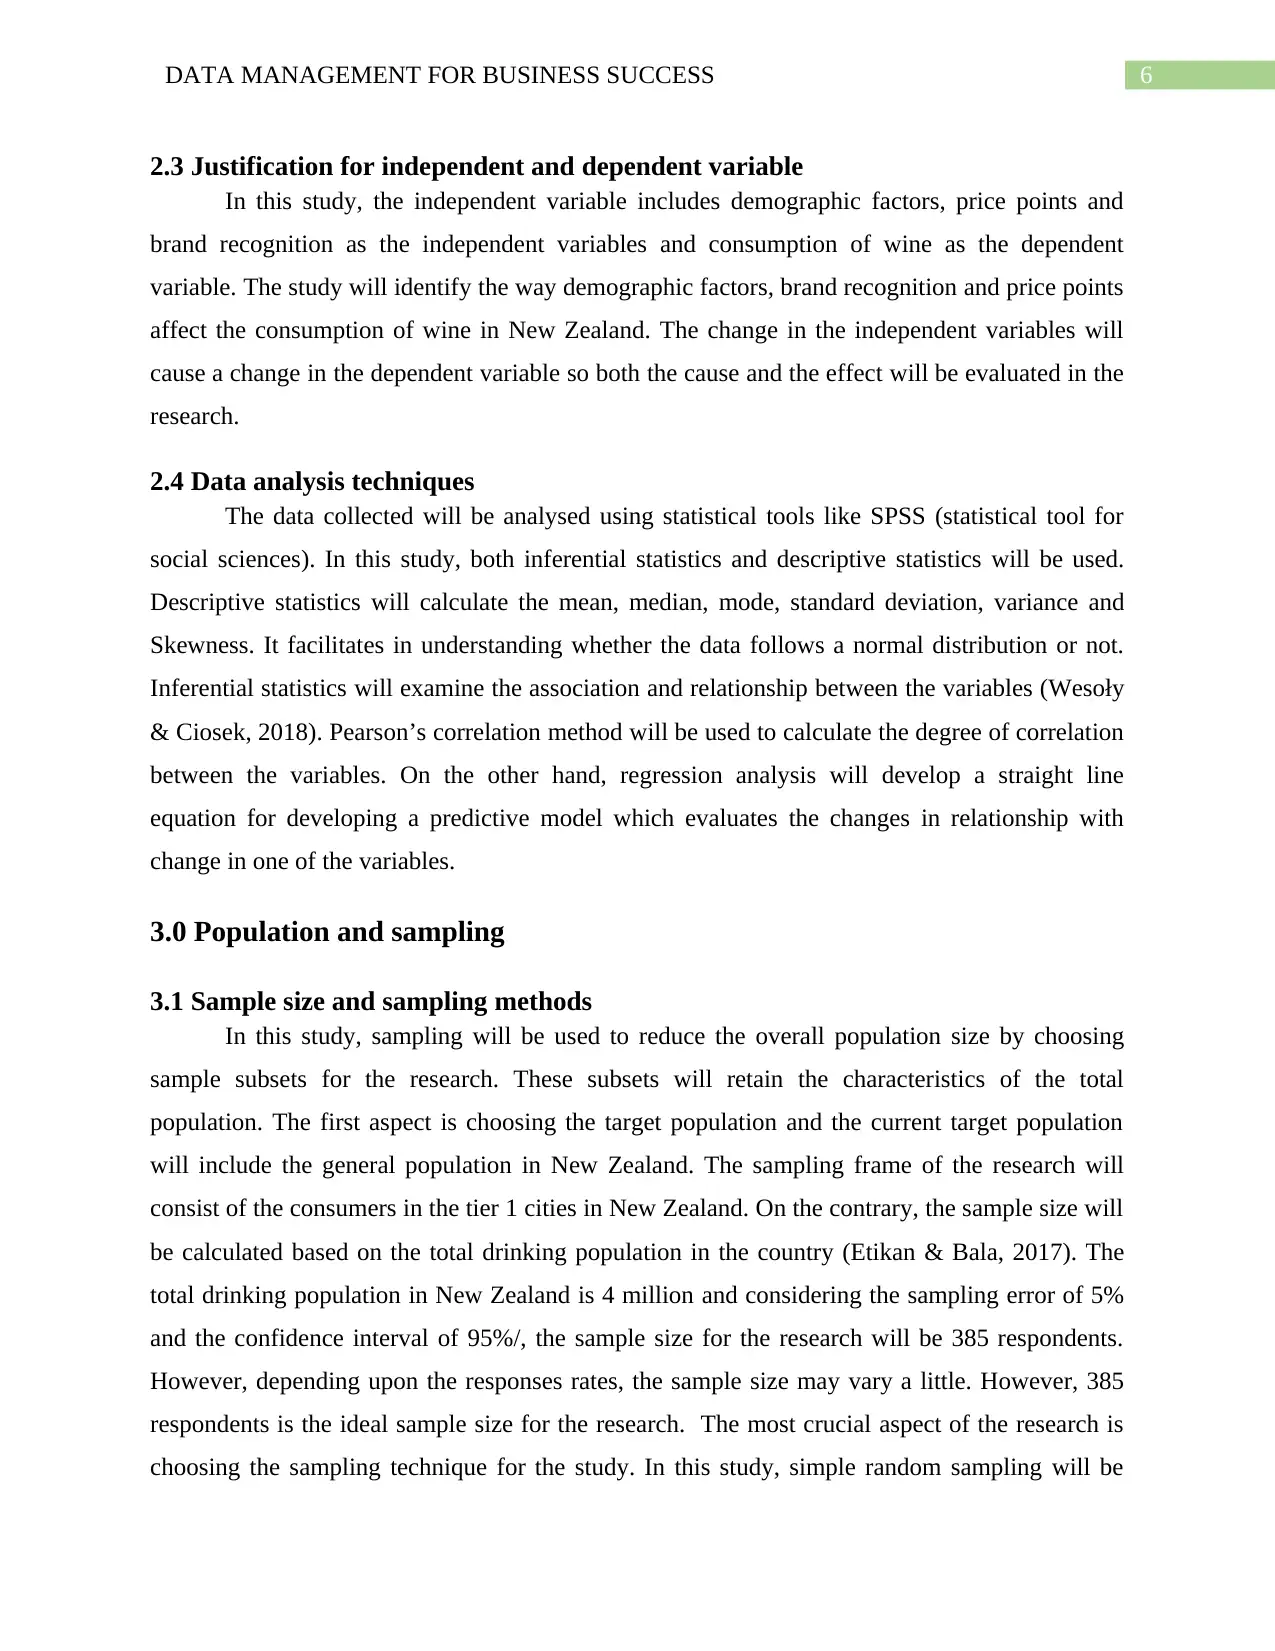
2.2 Research methods for data collection
In this study, primary data collection method will be followed where data will be
collected using a survey questionnaire. Google form will be used to develop a survey
questionnaire consisting of demographic questions and questions on the factors affecting the
purchase decision of the consumers. Primary data collection method will ensure the reliability
and validity of the data collected (Lowry et al., 2016). Moreover, it will facilitate in collecting
data which is recent but as the study uses a cross sectional study, there is a limitation of
identifying only the association and not the causation between the variables. The data collection
from primary sources are not subjected to any kind of manipulation. The research focuses on
using a Delphi technique where the data will be collected by sending the questionnaire to
experts. It helps in identifying the opinion of the people and a consolidated view to understand
the report in detail.
axiology identifies the way personal values and beliefs affect the research. Research philosophy
should include consistent assumptions which increases the credibility of the research philosophy.
It describes the research strategy, data collection methods and the methodological choice. In this
study, positivism has been chosen as the research philosophy as it follows a scientific and
naturalistic approach which means that the data gathered can be easily quantified in the research
(Kennedy, 2017). It focuses on the theories already given or predefined in the research and uses a
scientific empiricist method to develop facts and data. In this scenario, objects and social entities
are observed in a similar way where measurement of facts and regularities results in the
development of meaningful data. It helps in developing universal laws and generalisations in the
research.
Research approach has been divided into two part, data collection and logical reasoning.
Data collection deals with method of gathering information which can be either quantitative or
qualitative in nature. On the other hand, the logical reasoning deals with the process of choosing
between inductive and deductive approach (Dougherty, Slevc & Grand, 2019). In this study,
quantitative data collection method will be used so deductive approach is the most suitable
approach of data collection. The deductive approach is used for testing the hypothesis developed
from the existing theories discussed in the literature review. In this study, deductive approach
will facilitate in validating hypothesises.
2.2 Research methods for data collection
In this study, primary data collection method will be followed where data will be
collected using a survey questionnaire. Google form will be used to develop a survey
questionnaire consisting of demographic questions and questions on the factors affecting the
purchase decision of the consumers. Primary data collection method will ensure the reliability
and validity of the data collected (Lowry et al., 2016). Moreover, it will facilitate in collecting
data which is recent but as the study uses a cross sectional study, there is a limitation of
identifying only the association and not the causation between the variables. The data collection
from primary sources are not subjected to any kind of manipulation. The research focuses on
using a Delphi technique where the data will be collected by sending the questionnaire to
experts. It helps in identifying the opinion of the people and a consolidated view to understand
the report in detail.
⊘ This is a preview!⊘
Do you want full access?
Subscribe today to unlock all pages.
Trusted by 1+ million students worldwide
6DATA MANAGEMENT FOR BUSINESS SUCCESS
2.3 Justification for independent and dependent variable
In this study, the independent variable includes demographic factors, price points and
brand recognition as the independent variables and consumption of wine as the dependent
variable. The study will identify the way demographic factors, brand recognition and price points
affect the consumption of wine in New Zealand. The change in the independent variables will
cause a change in the dependent variable so both the cause and the effect will be evaluated in the
research.
2.4 Data analysis techniques
The data collected will be analysed using statistical tools like SPSS (statistical tool for
social sciences). In this study, both inferential statistics and descriptive statistics will be used.
Descriptive statistics will calculate the mean, median, mode, standard deviation, variance and
Skewness. It facilitates in understanding whether the data follows a normal distribution or not.
Inferential statistics will examine the association and relationship between the variables (Wesoły
& Ciosek, 2018). Pearson’s correlation method will be used to calculate the degree of correlation
between the variables. On the other hand, regression analysis will develop a straight line
equation for developing a predictive model which evaluates the changes in relationship with
change in one of the variables.
3.0 Population and sampling
3.1 Sample size and sampling methods
In this study, sampling will be used to reduce the overall population size by choosing
sample subsets for the research. These subsets will retain the characteristics of the total
population. The first aspect is choosing the target population and the current target population
will include the general population in New Zealand. The sampling frame of the research will
consist of the consumers in the tier 1 cities in New Zealand. On the contrary, the sample size will
be calculated based on the total drinking population in the country (Etikan & Bala, 2017). The
total drinking population in New Zealand is 4 million and considering the sampling error of 5%
and the confidence interval of 95%/, the sample size for the research will be 385 respondents.
However, depending upon the responses rates, the sample size may vary a little. However, 385
respondents is the ideal sample size for the research. The most crucial aspect of the research is
choosing the sampling technique for the study. In this study, simple random sampling will be
Paraphrase This Document
Need a fresh take? Get an instant paraphrase of this document with our AI Paraphraser
7DATA MANAGEMENT FOR BUSINESS SUCCESS
used to choose respondents randomly. The survey forms will be randomly sent via emails to
consumers for providing equal opportunity to all the respondents.
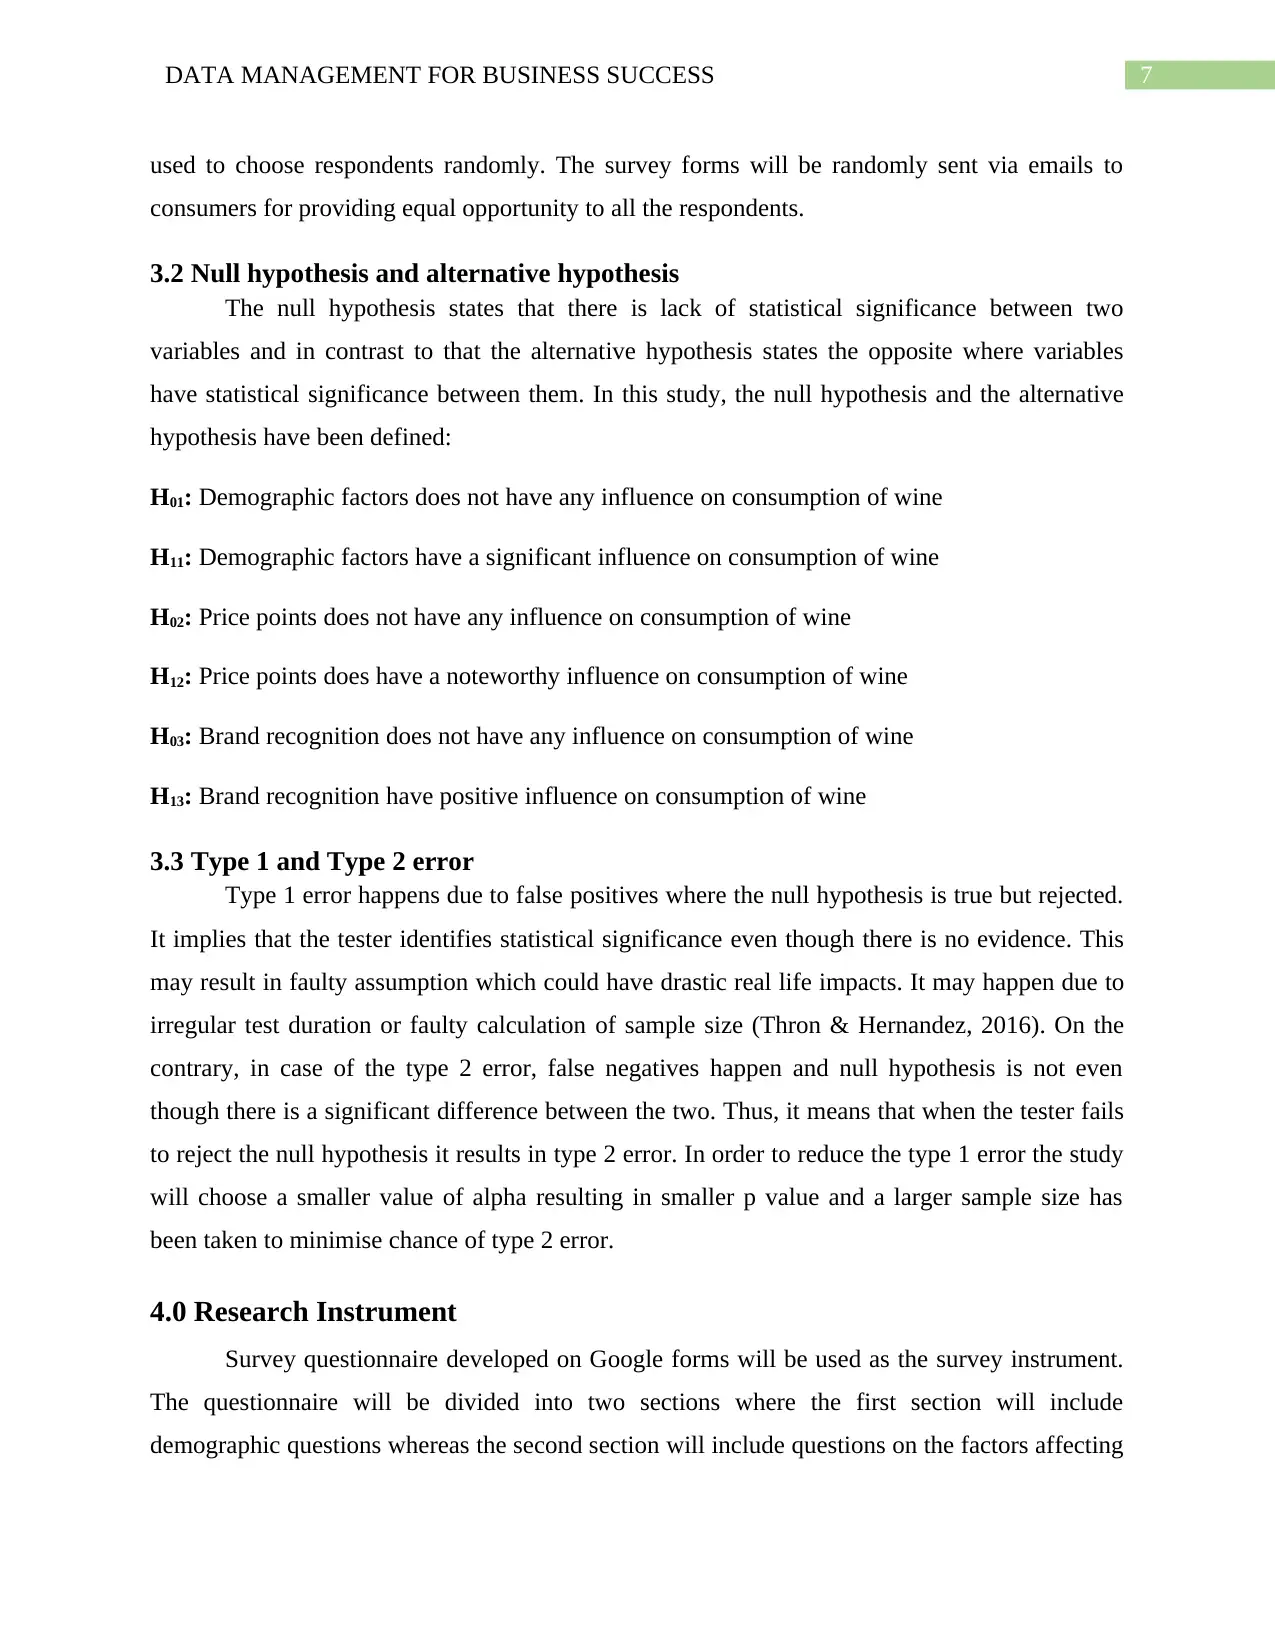
3.2 Null hypothesis and alternative hypothesis
The null hypothesis states that there is lack of statistical significance between two
variables and in contrast to that the alternative hypothesis states the opposite where variables
have statistical significance between them. In this study, the null hypothesis and the alternative
hypothesis have been defined:
H01: Demographic factors does not have any influence on consumption of wine
H11: Demographic factors have a significant influence on consumption of wine
H02: Price points does not have any influence on consumption of wine
H12: Price points does have a noteworthy influence on consumption of wine
H03: Brand recognition does not have any influence on consumption of wine
H13: Brand recognition have positive influence on consumption of wine
3.3 Type 1 and Type 2 error
Type 1 error happens due to false positives where the null hypothesis is true but rejected.
It implies that the tester identifies statistical significance even though there is no evidence. This
may result in faulty assumption which could have drastic real life impacts. It may happen due to
irregular test duration or faulty calculation of sample size (Thron & Hernandez, 2016). On the
contrary, in case of the type 2 error, false negatives happen and null hypothesis is not even
though there is a significant difference between the two. Thus, it means that when the tester fails
to reject the null hypothesis it results in type 2 error. In order to reduce the type 1 error the study
will choose a smaller value of alpha resulting in smaller p value and a larger sample size has
been taken to minimise chance of type 2 error.
4.0 Research Instrument
Survey questionnaire developed on Google forms will be used as the survey instrument.
The questionnaire will be divided into two sections where the first section will include
demographic questions whereas the second section will include questions on the factors affecting
used to choose respondents randomly. The survey forms will be randomly sent via emails to
consumers for providing equal opportunity to all the respondents.
3.2 Null hypothesis and alternative hypothesis
The null hypothesis states that there is lack of statistical significance between two
variables and in contrast to that the alternative hypothesis states the opposite where variables
have statistical significance between them. In this study, the null hypothesis and the alternative
hypothesis have been defined:
H01: Demographic factors does not have any influence on consumption of wine
H11: Demographic factors have a significant influence on consumption of wine
H02: Price points does not have any influence on consumption of wine
H12: Price points does have a noteworthy influence on consumption of wine
H03: Brand recognition does not have any influence on consumption of wine
H13: Brand recognition have positive influence on consumption of wine
3.3 Type 1 and Type 2 error
Type 1 error happens due to false positives where the null hypothesis is true but rejected.
It implies that the tester identifies statistical significance even though there is no evidence. This
may result in faulty assumption which could have drastic real life impacts. It may happen due to
irregular test duration or faulty calculation of sample size (Thron & Hernandez, 2016). On the
contrary, in case of the type 2 error, false negatives happen and null hypothesis is not even
though there is a significant difference between the two. Thus, it means that when the tester fails
to reject the null hypothesis it results in type 2 error. In order to reduce the type 1 error the study
will choose a smaller value of alpha resulting in smaller p value and a larger sample size has
been taken to minimise chance of type 2 error.
4.0 Research Instrument
Survey questionnaire developed on Google forms will be used as the survey instrument.
The questionnaire will be divided into two sections where the first section will include
demographic questions whereas the second section will include questions on the factors affecting
8DATA MANAGEMENT FOR BUSINESS SUCCESS
wine consumption (Mattsson et al., 2017). These questions will be developed on nominal,
ordinal, ratio and interval scale. A 5 point Likert scale will be used to develop a questionnaire
will high internal consistency. Questions like gender and marital status will be developed on
nominal scale, questions will age will be developed on interval scale and factors will be
developed on ratio scale.
5.0 Ethical consideration
The research will adhere to all the ethical guidelines prescribed by the university.
Anonymity and privacy of the respondents will be maintained by keeping confidentiality of their
personal data. Informed consent will be developed which will ensure that consumers participate
voluntarily (Hemming, 2019). These consumers will be provided knowledge regarding the
purpose and scope of the study to maintain the objectivity.
⊘ This is a preview!⊘
Do you want full access?
Subscribe today to unlock all pages.
Trusted by 1+ million students worldwide
9DATA MANAGEMENT FOR BUSINESS SUCCESS
6.0 References
actionpoint.org.nz. (2019). The alcohol industry in New Zealand. Retrieved 7 February 2020,
from https://www.actionpoint.org.nz/the-alcohol-industry-in-new-zealand
Da Veiga, A. (2016, July). A cybersecurity culture research philosophy and approach to develop
a valid and reliable measuring instrument. In 2016 SAI Computing Conference (SAI) (pp.
1006-1015). IEEE.
Dougherty, M. R., Slevc, L. R., & Grand, J. A. (2019). Making research evaluation more
transparent: Aligning research philosophy, institutional values, and
reporting. Perspectives on Psychological Science, 14(3), 361-375.
Etikan, I., & Bala, K. (2017). Sampling and sampling methods. Biometrics & Biostatistics
International Journal, 5(6), 00149.
Hemming, K. (2019). External validity is also an ethical consideration in cluster-randomised
trials of policy changes: the author’s reply. BMJ quality & safety, 28(2), 168-168.
Kennedy, A. M. (2017). Macro-social marketing research: philosophy, methodology and
methods. Journal of Macromarketing, 37(4), 347-355.
Lowry, P. B., D’Arcy, J., Hammer, B., & Moody, G. D. (2016). “Cargo Cult” science in
traditional organization and information systems survey research: A case for using
nontraditional methods of data collection, including Mechanical Turk and online
panels. The Journal of Strategic Information Systems, 25(3), 232-240.
Mattsson, J., Sørensen, F., Jensen, J. F., & Barnes, S. (2017). A Survey Instrument for Measuring
the Experiential Value of Employee-Tourist Encounters. In RESER Annual Conference
in Bilbao, Spain: The crucial role of services in business and cities competitiveness.
Scoop.co.nz. (2018). Decline in wine consumption impacting NZ industry | Scoop News.
Retrieved 7 February 2020, from
https://www.scoop.co.nz/stories/BU1811/S00474/decline-in-wine-consumption-
impacting-nz-industry.htm
Paraphrase This Document
Need a fresh take? Get an instant paraphrase of this document with our AI Paraphraser
10DATA MANAGEMENT FOR BUSINESS SUCCESS
Thron, C., & Hernandez, N. (2016). An Ongoing Contradiction: Inconsistent Definitions of Type
I Error in Practical References on Hypothesis Testing. Available at SSRN 2817863.
Wesoły, M., & Ciosek, P. (2018). Comparison of various data analysis techniques applied for the
classification of pharmaceutical samples by electronic tongue. Sensors and Actuators B:
Chemical, 267, 570-580.
Wilkins, A. (2018). Industry could suffer as New Zealanders cut down on wine. Retrieved 7
February 2020, from https://www.newshub.co.nz/home/rural/2018/11/industry-could-
suffer-as-new-zealanders-cut-down-on-wine.html
1 out of 11
Related Documents


Your All-in-One AI-Powered Toolkit for Academic Success.
+13062052269
info@desklib.com
Available 24*7 on WhatsApp / Email
![[object Object]](/_next/static/media/star-bottom.7253800d.svg)
Unlock your academic potential
Copyright © 2020–2026 A2Z Services. All Rights Reserved. Developed and managed by ZUCOL.