Business Analysis Project: Wingstop Inc. Competitive Analysis
VerifiedAdded on 2020/04/15
|27
|4840
|112
Project
AI Summary
This business analysis project provides an in-depth appraisal of Wingstop Inc.'s competitive position, benchmarking its performance against KFC and McDonald's. The analysis covers key issues, including the company's growth and competitive strategies within the fast-food industry. It incorporates financial analysis using ratio analysis, assessing profitability (ROIC, net profit margin, ROA), liquidity (current and quick ratios), financial health, and solvency (cash flow per sale). Strategic analysis includes PESTLE and Porter's Five Forces analysis to understand the business environment and competitive forces. The project also explores operational and organizational aspects, identifies key success factors, and utilizes a Balance Scorecard and Ansoff's Matrix to identify potential strategies. Finally, it presents recommendations and scenario forecasting to address the challenges faced by Wingstop Inc. The document highlights limitations of financial models and conventional analysis to provide a complete perspective. This assignment is contributed by a student and is published on Desklib.
Running head: BUSINESS ANALYSIS PROJECT
Business Analysis Project
Name of the Student
Name of the University
Authors Note
Course ID
Business Analysis Project
Name of the Student
Name of the University
Authors Note
Course ID
Paraphrase This Document
Need a fresh take? Get an instant paraphrase of this document with our AI Paraphraser
1BUSINESS ANALYSIS PROJECT
Table of Contents
Introduction:...............................................................................................................................2
Case context of analysis:............................................................................................................2
Company Background:...............................................................................................................2
Key Issues:.................................................................................................................................3
Comparative Value Proposition:................................................................................................3
Rationale of My Choice of Company:.......................................................................................4
Financial Analysis;.....................................................................................................................4
Ratio Analysis:...........................................................................................................................5
Profitability: Return on Invested Capital:..................................................................................5
Net Profit Margin:......................................................................................................................6
Return on Assets:.......................................................................................................................7
Liquidity: Current Ratio.............................................................................................................8
Quick ratio:.................................................................................................................................9
Financial Health: Financial Leverage......................................................................................10
Solvency: Cash flow per sale:..................................................................................................11
Strategic Analysis:...................................................................................................................12
Business Environment Analysis:..............................................................................................12
PESTLE Analysis:...................................................................................................................12
Competitive forces Analysis:...................................................................................................13
Porter’s Five Forces:................................................................................................................13
2BUSINESS ANALYSIS PROJECT
New forces in Restaurant Industry:..........................................................................................16
Operations and Organisational Analysis:.................................................................................16
Key Success Factors:................................................................................................................17
Balance Scorecard:...................................................................................................................17
Identifying Strategies:..............................................................................................................18
Ansoff’s Matrix:.......................................................................................................................18
Diversification:.........................................................................................................................19
Limitations of Financials models and Conventional Analysis:................................................19
Limitations of Financials models in Analysing Performance:.................................................19
Conclusion:..............................................................................................................................19
Recommendations:...................................................................................................................20
Recommendations Modelling:.................................................................................................20
Modelling:................................................................................................................................21
Scenario Forecasting:...............................................................................................................21
Scenario Description:...............................................................................................................21
Outcome:..................................................................................................................................22
Scenario Forecast Graph:.........................................................................................................22
Reference List:.........................................................................................................................24
⊘ This is a preview!⊘
Do you want full access?
Subscribe today to unlock all pages.
Trusted by 1+ million students worldwide
3BUSINESS ANALYSIS PROJECT
Introduction:
The report will provide an in depth critical appraisal of the competitive position of the
Wing Stop Inc and will benchmark the performance of the company with KFC and
McDonald. The present study will take into the considerations the several management and
business competitive issues that is faced by the Wing Stop Inc as a comparison is performed
to benchmark the performance with companies such as KFC and McDonald. The analysis is
considered to be holding significant relevance since it would offer an in depth understanding
of the central issues surrounding the company and its senior managers. Apart from this
appropriate recommendation will provided to address the issues faced by Wing Stop Inc so
that it can boost its productivity.
Case context of analysis:
The WingStop Inc is a chain of nostalgic aviation-themed restaurants where the
ultimate amount of focus is placed on the chicken wings. The company has grown in a chain
having more than 1,000 restaurants either in the form of open or development. Over the span
of years, the company has developed into the retail expansion of the outlets chains in the
industry. The growth and sustainability of the organization has been facilitated by the
important developments in terms of the consumer likeness towards the food products along
with the market growth that have helped in the growth of the business.
Company Background:
Wing stop restaurant Inc is a chain of nostalgic aviation themed restaurants that
entirely focuses on the chicken wings. Wingstop locations is located are decorated with the
theme of aviation. The restaurant chain was first founded in the year 1944 in the state of
Texas and started offering franchises in the year 1998. Ever since then Wingstop Inc
developed into the chain of restaurants having more than 1000 restaurants that are either open
Paraphrase This Document
Need a fresh take? Get an instant paraphrase of this document with our AI Paraphraser
4BUSINESS ANALYSIS PROJECT
or have developed. The chain of restaurant has been headquartered in the Dallas, Texas. Over
the period of time the business has continued to experience growth by opening new outlets
and offering quality food to its customers.
Key Issues:
The primary issue that is surrounding the discussion of the company is the
competitive position of the Wing Stop Inc in respect of the benchmark companies. Wing Stop
Inc faces direct competition from other players in the market that are present both
domestically and internationally. The present top competing firms that Wing Stop Inc
combats with in comprises of KFC and McDonald. In spite of facing aggressive competition
from such firms the company is constantly implementing new and competitive strategy,
which would enable the company to expand significantly across the world with over 1000
store and outlets that are operated by the company (Osterwalder et al. 2014). Ever since the
inception of the company Wing Stop Inc has opened number of outlets as the company has
reported to have opened more than 1000 outlets across the world.
Comparative Value Proposition:
Wing Stop Inc KFC McDonalds
Target Customer Local customers that
prefer
Medium to high
class customers
having preference
for premium food
products
Consumers with
speedy and
convenient purchase
priority
Benefits Offers domestic
taste products under
the tidy dining setup
Offers relaxed and
soothing
environment with
The quality of food
is average however
offers variety of
5BUSINESS ANALYSIS PROJECT
high quality fresh
food
products in its menu
Price Offers price
discounts on
premium products
15 percent premium 10 percent premium
Customer Value Local taste chicken
wings with lower
price premium
Higher quality food
at a significant price
premium
Medium to average
price premium
quality food
products.
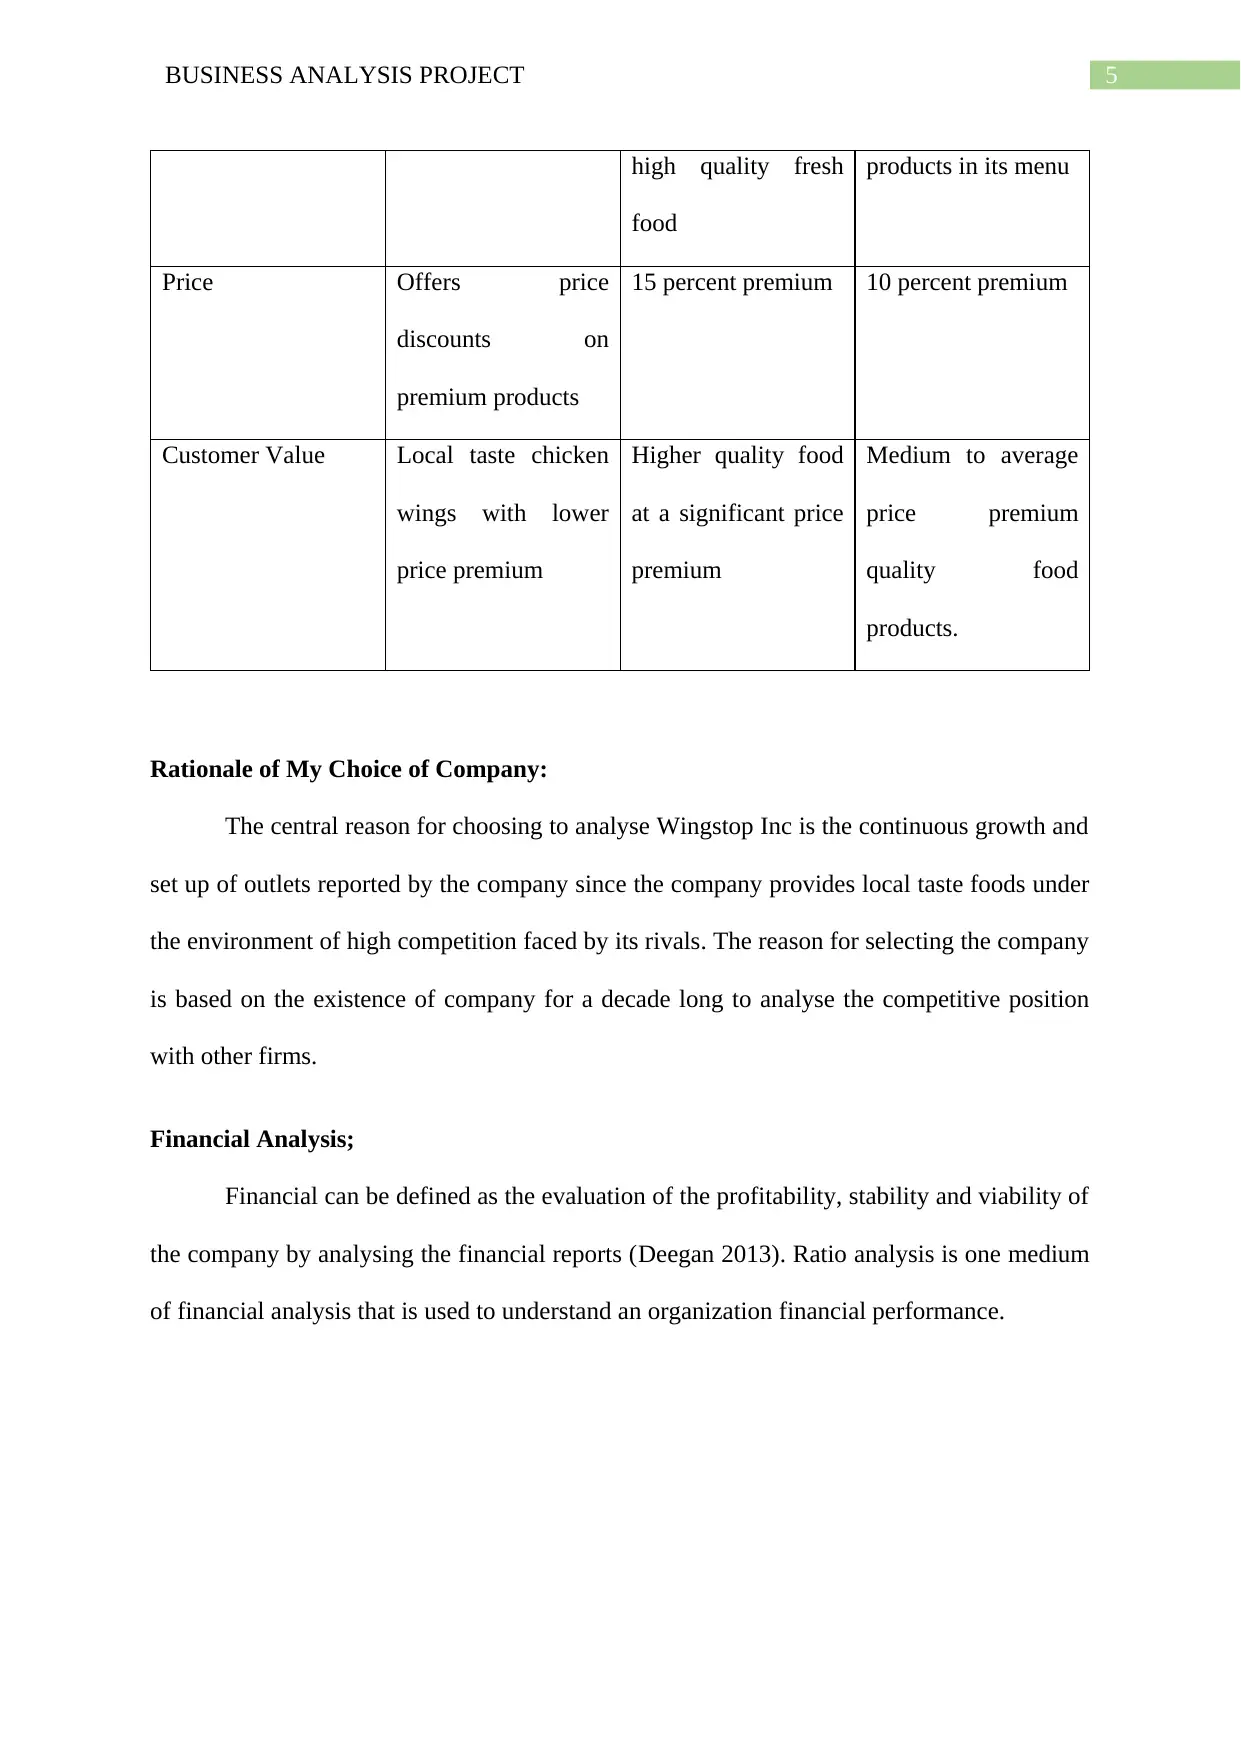
Rationale of My Choice of Company:
The central reason for choosing to analyse Wingstop Inc is the continuous growth and
set up of outlets reported by the company since the company provides local taste foods under
the environment of high competition faced by its rivals. The reason for selecting the company
is based on the existence of company for a decade long to analyse the competitive position
with other firms.
Financial Analysis;
Financial can be defined as the evaluation of the profitability, stability and viability of
the company by analysing the financial reports (Deegan 2013). Ratio analysis is one medium
of financial analysis that is used to understand an organization financial performance.
high quality fresh
food
products in its menu
Price Offers price
discounts on
premium products
15 percent premium 10 percent premium
Customer Value Local taste chicken
wings with lower
price premium
Higher quality food
at a significant price
premium
Medium to average
price premium
quality food
products.
Rationale of My Choice of Company:
The central reason for choosing to analyse Wingstop Inc is the continuous growth and
set up of outlets reported by the company since the company provides local taste foods under
the environment of high competition faced by its rivals. The reason for selecting the company
is based on the existence of company for a decade long to analyse the competitive position
with other firms.
Financial Analysis;
Financial can be defined as the evaluation of the profitability, stability and viability of
the company by analysing the financial reports (Deegan 2013). Ratio analysis is one medium
of financial analysis that is used to understand an organization financial performance.
⊘ This is a preview!⊘
Do you want full access?
Subscribe today to unlock all pages.
Trusted by 1+ million students worldwide
6BUSINESS ANALYSIS PROJECT
Ratio Analysis:
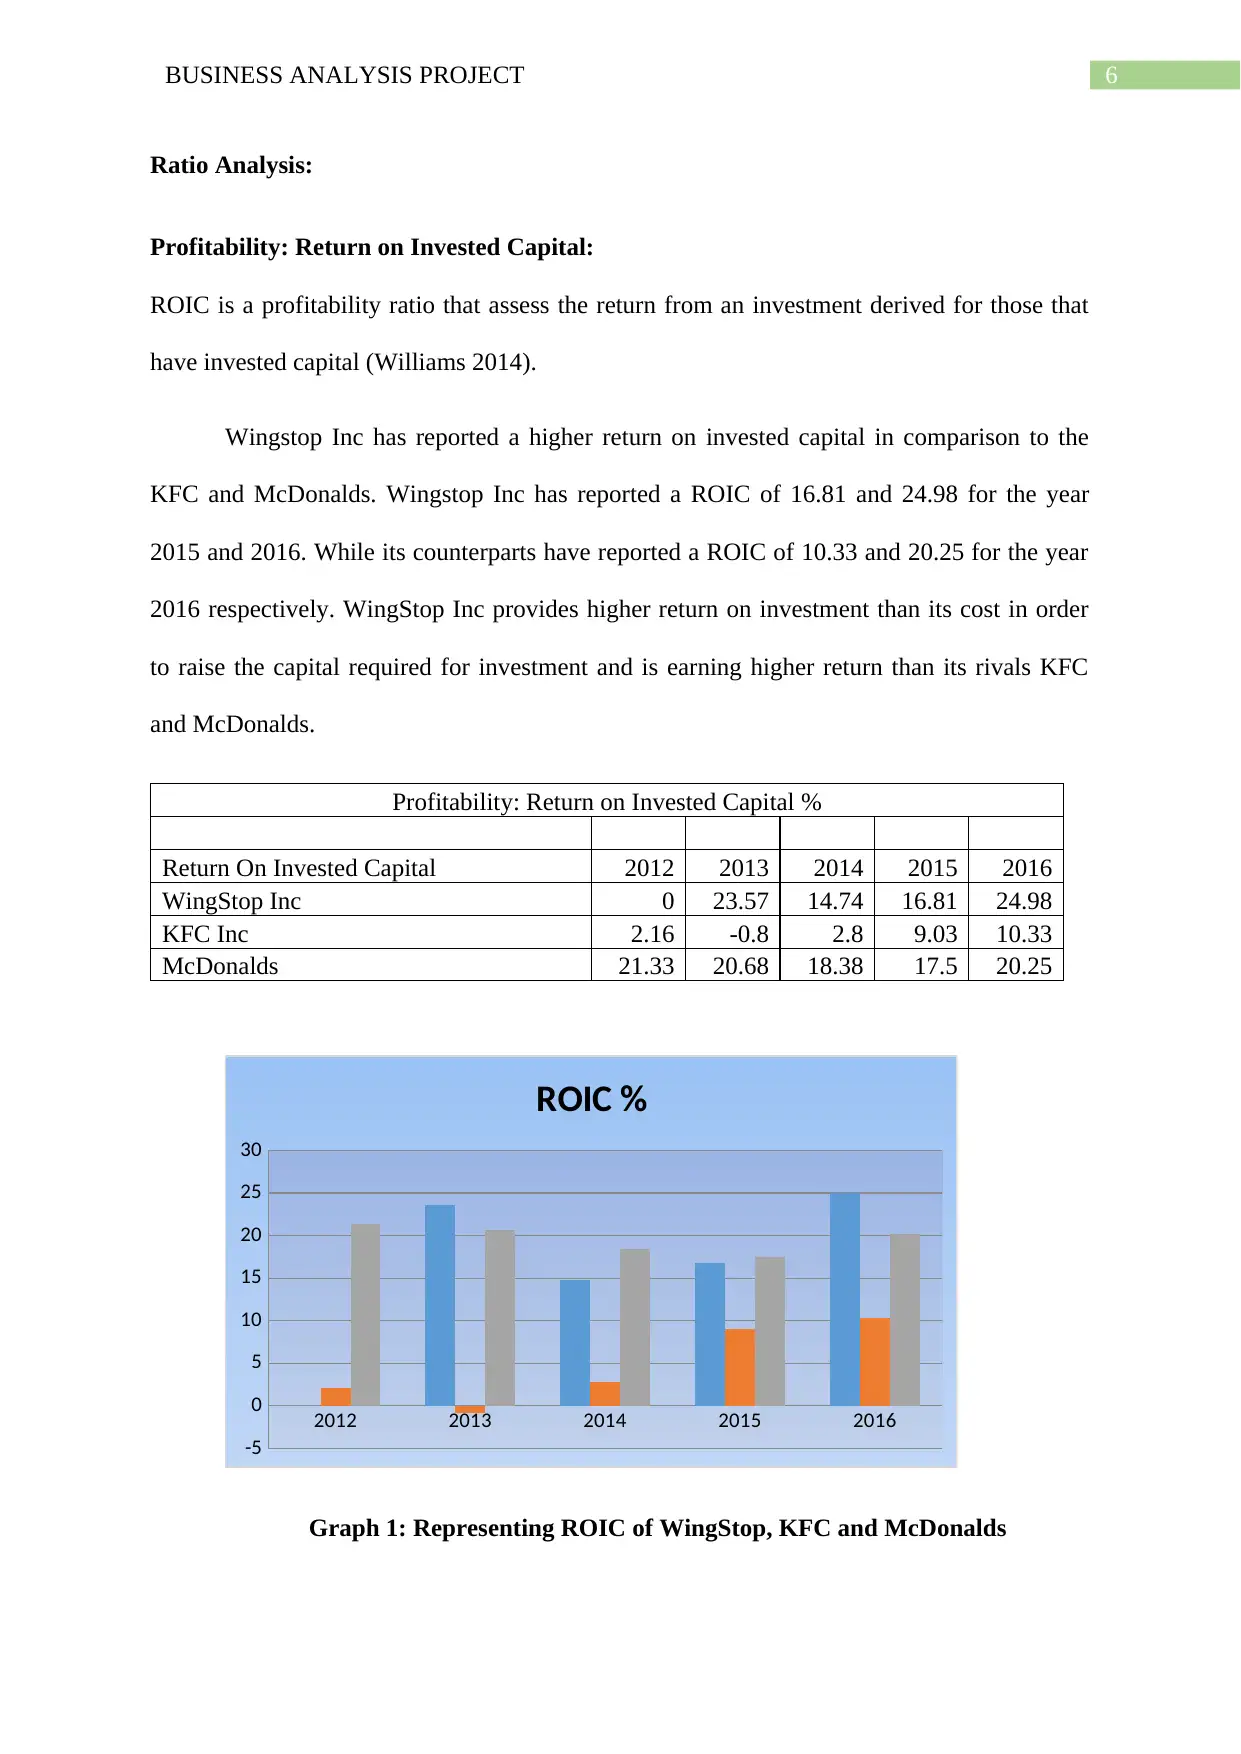
Profitability: Return on Invested Capital:
ROIC is a profitability ratio that assess the return from an investment derived for those that
have invested capital (Williams 2014).
Wingstop Inc has reported a higher return on invested capital in comparison to the
KFC and McDonalds. Wingstop Inc has reported a ROIC of 16.81 and 24.98 for the year
2015 and 2016. While its counterparts have reported a ROIC of 10.33 and 20.25 for the year
2016 respectively. WingStop Inc provides higher return on investment than its cost in order
to raise the capital required for investment and is earning higher return than its rivals KFC
and McDonalds.
Profitability: Return on Invested Capital %
Return On Invested Capital 2012 2013 2014 2015 2016
WingStop Inc 0 23.57 14.74 16.81 24.98
KFC Inc 2.16 -0.8 2.8 9.03 10.33
McDonalds 21.33 20.68 18.38 17.5 20.25
2012 2013 2014 2015 2016
-5
0
5
10
15
20
25
30
ROIC %
Graph 1: Representing ROIC of WingStop, KFC and McDonalds
Ratio Analysis:
Profitability: Return on Invested Capital:
ROIC is a profitability ratio that assess the return from an investment derived for those that
have invested capital (Williams 2014).
Wingstop Inc has reported a higher return on invested capital in comparison to the
KFC and McDonalds. Wingstop Inc has reported a ROIC of 16.81 and 24.98 for the year
2015 and 2016. While its counterparts have reported a ROIC of 10.33 and 20.25 for the year
2016 respectively. WingStop Inc provides higher return on investment than its cost in order
to raise the capital required for investment and is earning higher return than its rivals KFC
and McDonalds.
Profitability: Return on Invested Capital %
Return On Invested Capital 2012 2013 2014 2015 2016
WingStop Inc 0 23.57 14.74 16.81 24.98
KFC Inc 2.16 -0.8 2.8 9.03 10.33
McDonalds 21.33 20.68 18.38 17.5 20.25
2012 2013 2014 2015 2016
-5
0
5
10
15
20
25
30
ROIC %
Graph 1: Representing ROIC of WingStop, KFC and McDonalds
Paraphrase This Document
Need a fresh take? Get an instant paraphrase of this document with our AI Paraphraser
7BUSINESS ANALYSIS PROJECT
(Source: As Created by Author)
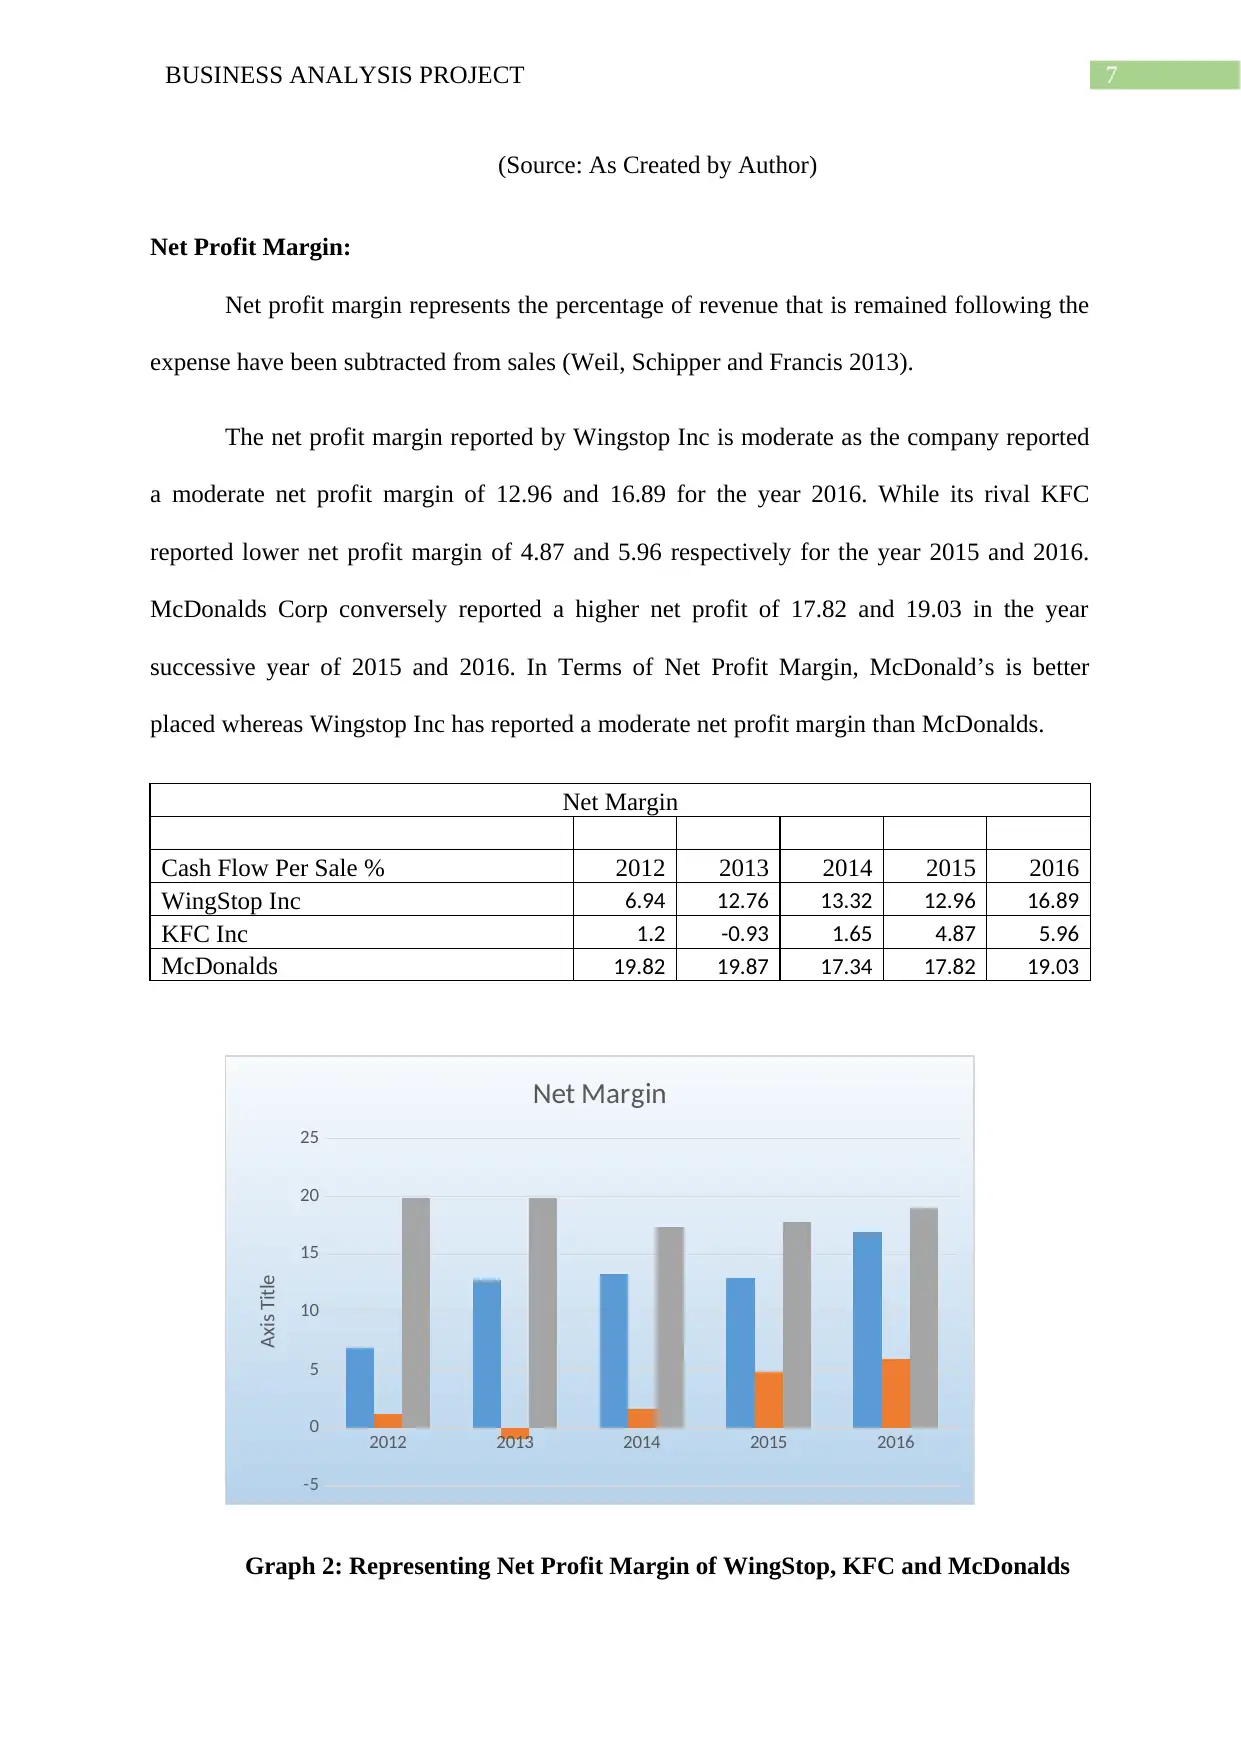
Net Profit Margin:
Net profit margin represents the percentage of revenue that is remained following the
expense have been subtracted from sales (Weil, Schipper and Francis 2013).
The net profit margin reported by Wingstop Inc is moderate as the company reported
a moderate net profit margin of 12.96 and 16.89 for the year 2016. While its rival KFC
reported lower net profit margin of 4.87 and 5.96 respectively for the year 2015 and 2016.
McDonalds Corp conversely reported a higher net profit of 17.82 and 19.03 in the year
successive year of 2015 and 2016. In Terms of Net Profit Margin, McDonald’s is better
placed whereas Wingstop Inc has reported a moderate net profit margin than McDonalds.
Net Margin
Cash Flow Per Sale % 2012 2013 2014 2015 2016
WingStop Inc 6.94 12.76 13.32 12.96 16.89
KFC Inc 1.2 -0.93 1.65 4.87 5.96
McDonalds 19.82 19.87 17.34 17.82 19.03
2012 2013 2014 2015 2016
-5
0
5
10
15
20
25
Net Margin
Axis Title
Graph 2: Representing Net Profit Margin of WingStop, KFC and McDonalds
(Source: As Created by Author)
Net Profit Margin:
Net profit margin represents the percentage of revenue that is remained following the
expense have been subtracted from sales (Weil, Schipper and Francis 2013).
The net profit margin reported by Wingstop Inc is moderate as the company reported
a moderate net profit margin of 12.96 and 16.89 for the year 2016. While its rival KFC
reported lower net profit margin of 4.87 and 5.96 respectively for the year 2015 and 2016.
McDonalds Corp conversely reported a higher net profit of 17.82 and 19.03 in the year
successive year of 2015 and 2016. In Terms of Net Profit Margin, McDonald’s is better
placed whereas Wingstop Inc has reported a moderate net profit margin than McDonalds.
Net Margin
Cash Flow Per Sale % 2012 2013 2014 2015 2016
WingStop Inc 6.94 12.76 13.32 12.96 16.89
KFC Inc 1.2 -0.93 1.65 4.87 5.96
McDonalds 19.82 19.87 17.34 17.82 19.03
2012 2013 2014 2015 2016
-5
0
5
10
15
20
25
Net Margin
Axis Title
Graph 2: Representing Net Profit Margin of WingStop, KFC and McDonalds
8BUSINESS ANALYSIS PROJECT
(Source: As Created by Author)
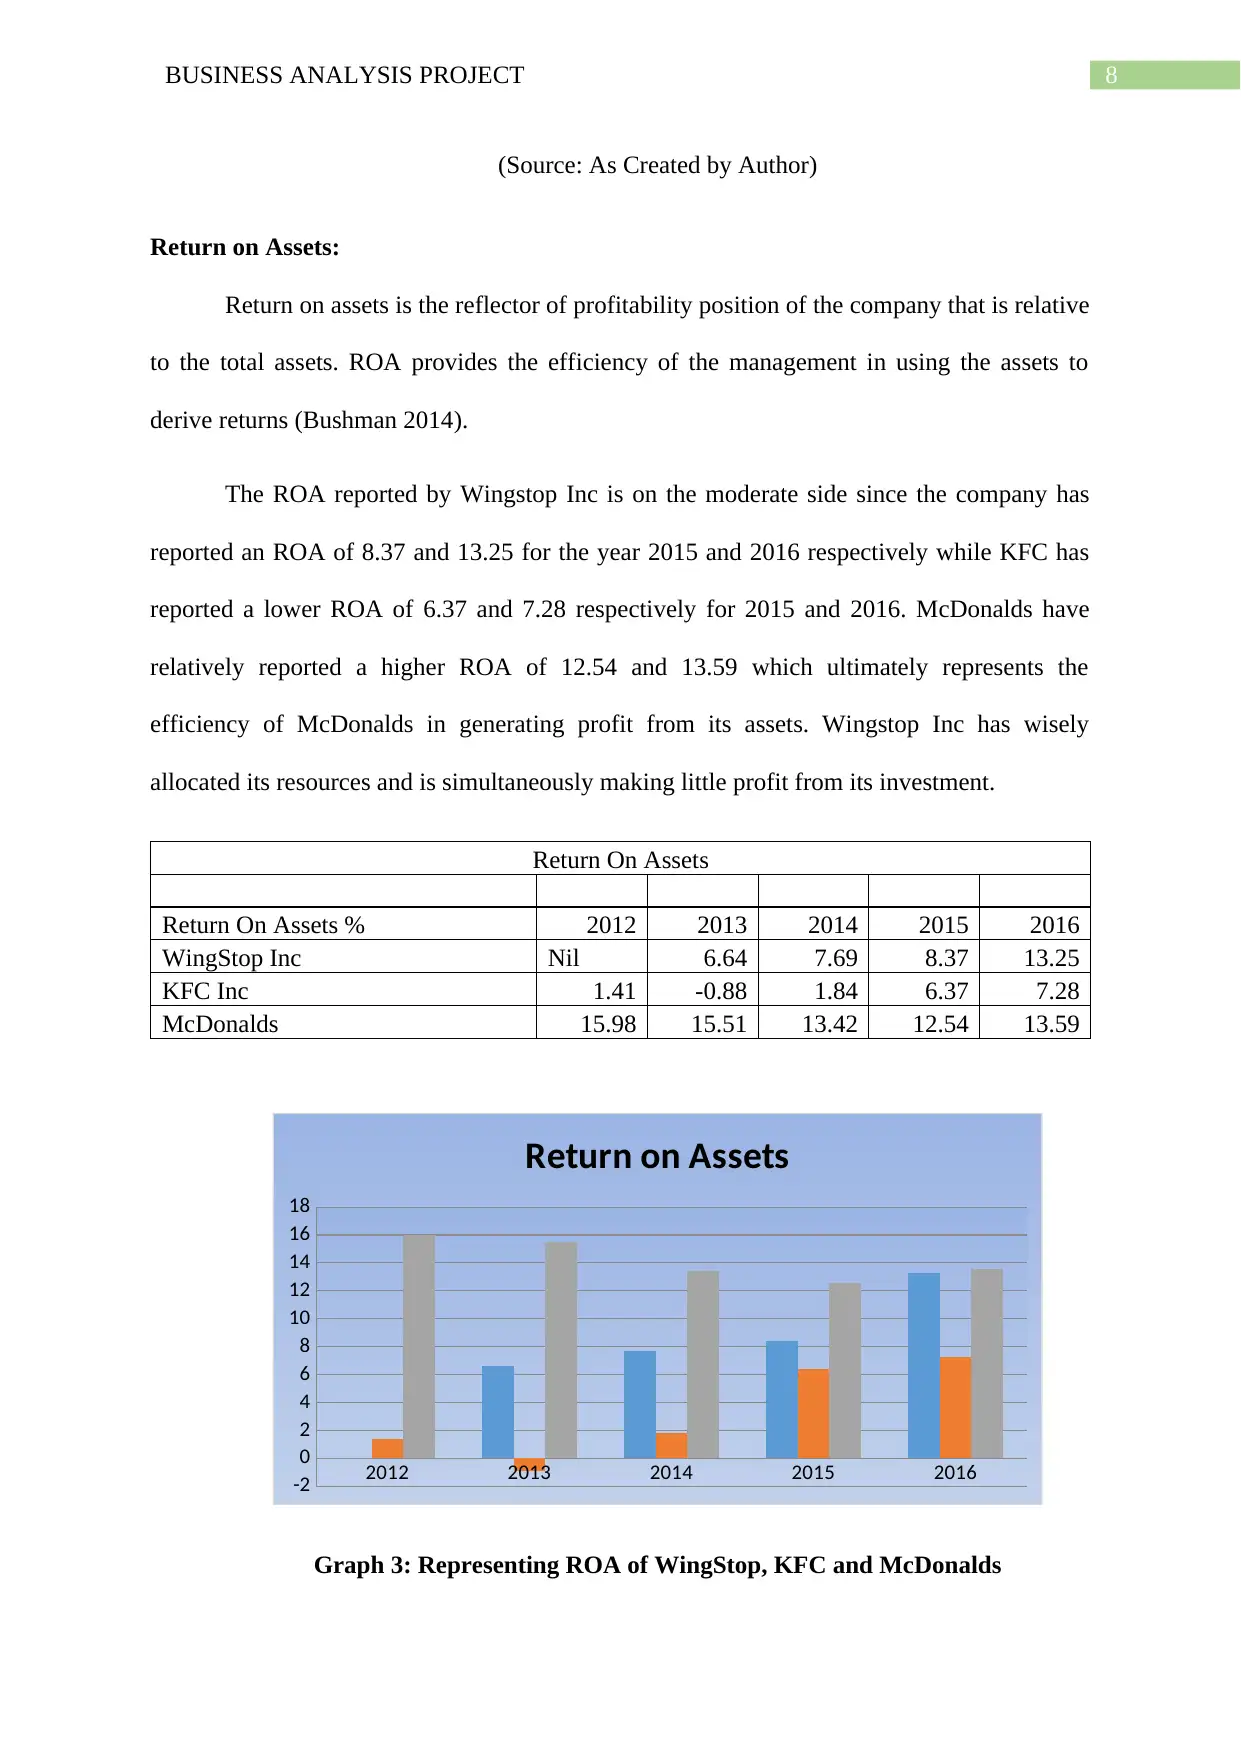
Return on Assets:
Return on assets is the reflector of profitability position of the company that is relative
to the total assets. ROA provides the efficiency of the management in using the assets to
derive returns (Bushman 2014).
The ROA reported by Wingstop Inc is on the moderate side since the company has
reported an ROA of 8.37 and 13.25 for the year 2015 and 2016 respectively while KFC has
reported a lower ROA of 6.37 and 7.28 respectively for 2015 and 2016. McDonalds have
relatively reported a higher ROA of 12.54 and 13.59 which ultimately represents the
efficiency of McDonalds in generating profit from its assets. Wingstop Inc has wisely
allocated its resources and is simultaneously making little profit from its investment.
Return On Assets
Return On Assets % 2012 2013 2014 2015 2016
WingStop Inc Nil 6.64 7.69 8.37 13.25
KFC Inc 1.41 -0.88 1.84 6.37 7.28
McDonalds 15.98 15.51 13.42 12.54 13.59
2012 2013 2014 2015 2016
-2
0
2
4
6
8
10
12
14
16
18
Return on Assets
Graph 3: Representing ROA of WingStop, KFC and McDonalds
(Source: As Created by Author)
Return on Assets:
Return on assets is the reflector of profitability position of the company that is relative
to the total assets. ROA provides the efficiency of the management in using the assets to
derive returns (Bushman 2014).
The ROA reported by Wingstop Inc is on the moderate side since the company has
reported an ROA of 8.37 and 13.25 for the year 2015 and 2016 respectively while KFC has
reported a lower ROA of 6.37 and 7.28 respectively for 2015 and 2016. McDonalds have
relatively reported a higher ROA of 12.54 and 13.59 which ultimately represents the
efficiency of McDonalds in generating profit from its assets. Wingstop Inc has wisely
allocated its resources and is simultaneously making little profit from its investment.
Return On Assets
Return On Assets % 2012 2013 2014 2015 2016
WingStop Inc Nil 6.64 7.69 8.37 13.25
KFC Inc 1.41 -0.88 1.84 6.37 7.28
McDonalds 15.98 15.51 13.42 12.54 13.59
2012 2013 2014 2015 2016
-2
0
2
4
6
8
10
12
14
16
18
Return on Assets
Graph 3: Representing ROA of WingStop, KFC and McDonalds
⊘ This is a preview!⊘
Do you want full access?
Subscribe today to unlock all pages.
Trusted by 1+ million students worldwide
9BUSINESS ANALYSIS PROJECT
(Source: As Created by Author)
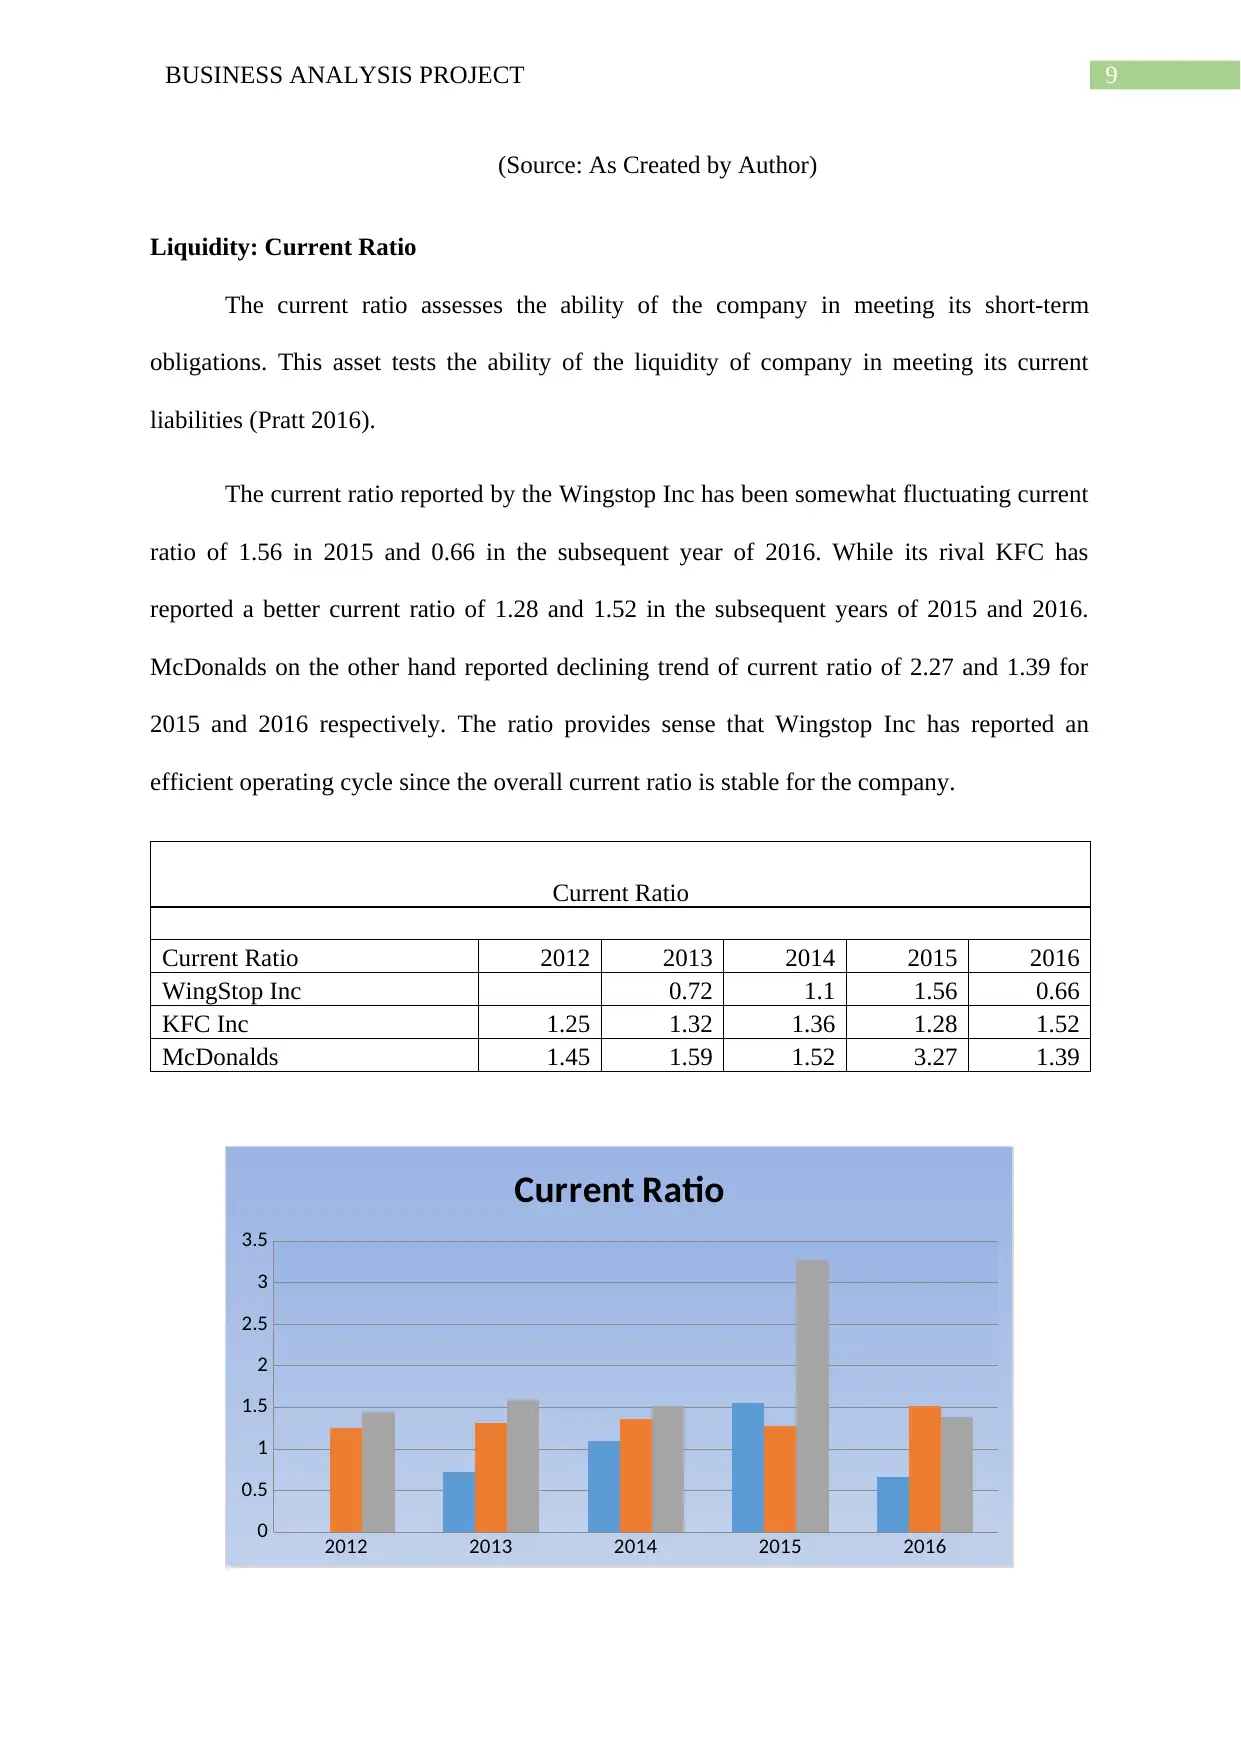
Liquidity: Current Ratio
The current ratio assesses the ability of the company in meeting its short-term
obligations. This asset tests the ability of the liquidity of company in meeting its current
liabilities (Pratt 2016).
The current ratio reported by the Wingstop Inc has been somewhat fluctuating current
ratio of 1.56 in 2015 and 0.66 in the subsequent year of 2016. While its rival KFC has
reported a better current ratio of 1.28 and 1.52 in the subsequent years of 2015 and 2016.
McDonalds on the other hand reported declining trend of current ratio of 2.27 and 1.39 for
2015 and 2016 respectively. The ratio provides sense that Wingstop Inc has reported an
efficient operating cycle since the overall current ratio is stable for the company.
Current Ratio
Current Ratio 2012 2013 2014 2015 2016
WingStop Inc 0.72 1.1 1.56 0.66
KFC Inc 1.25 1.32 1.36 1.28 1.52
McDonalds 1.45 1.59 1.52 3.27 1.39
2012 2013 2014 2015 2016
0
0.5
1
1.5
2
2.5
3
3.5
Current Ratio
(Source: As Created by Author)
Liquidity: Current Ratio
The current ratio assesses the ability of the company in meeting its short-term
obligations. This asset tests the ability of the liquidity of company in meeting its current
liabilities (Pratt 2016).
The current ratio reported by the Wingstop Inc has been somewhat fluctuating current
ratio of 1.56 in 2015 and 0.66 in the subsequent year of 2016. While its rival KFC has
reported a better current ratio of 1.28 and 1.52 in the subsequent years of 2015 and 2016.
McDonalds on the other hand reported declining trend of current ratio of 2.27 and 1.39 for
2015 and 2016 respectively. The ratio provides sense that Wingstop Inc has reported an
efficient operating cycle since the overall current ratio is stable for the company.
Current Ratio
Current Ratio 2012 2013 2014 2015 2016
WingStop Inc 0.72 1.1 1.56 0.66
KFC Inc 1.25 1.32 1.36 1.28 1.52
McDonalds 1.45 1.59 1.52 3.27 1.39
2012 2013 2014 2015 2016
0
0.5
1
1.5
2
2.5
3
3.5
Current Ratio
Paraphrase This Document
Need a fresh take? Get an instant paraphrase of this document with our AI Paraphraser
10BUSINESS ANALYSIS PROJECT
Graph 4: Representing Current Ratio of WingStop, KFC and McDonalds
(Source: As Created by Author)
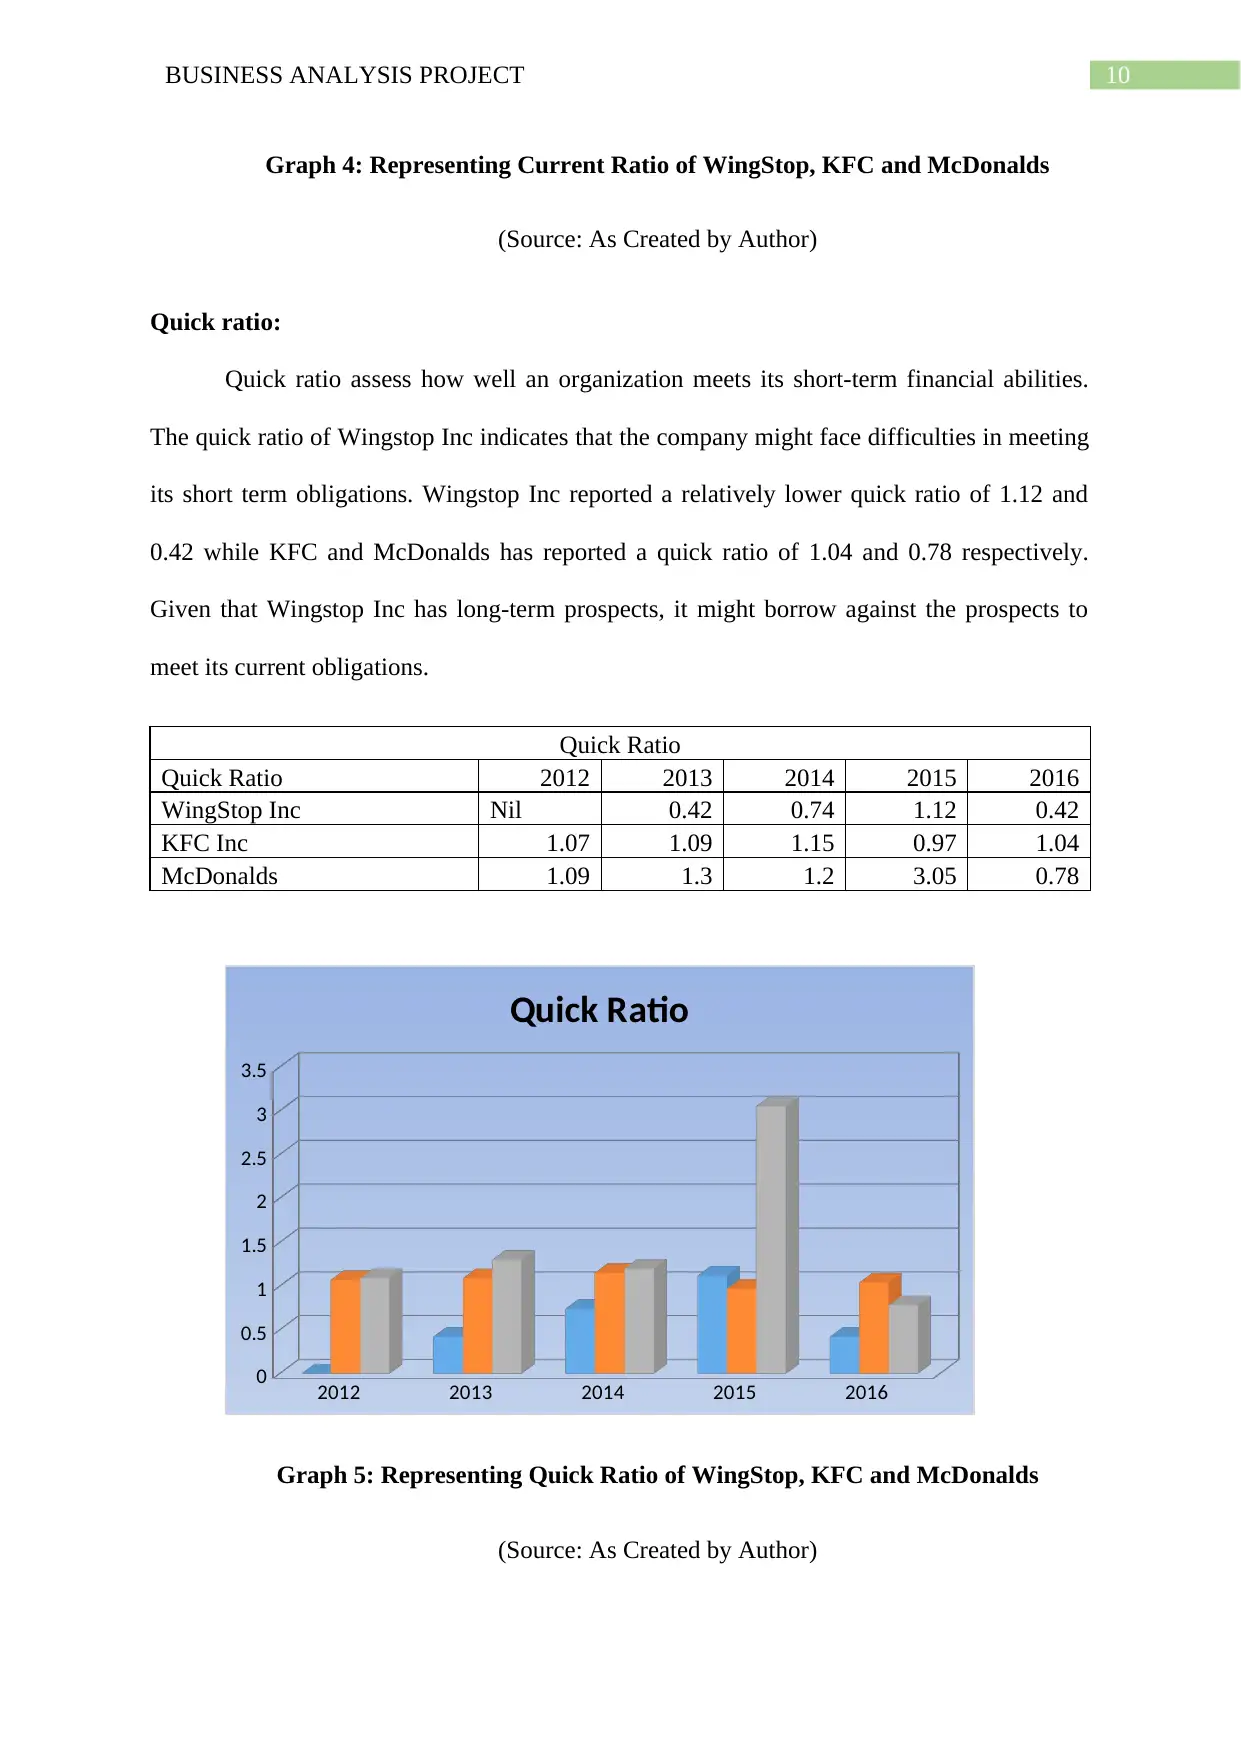
Quick ratio:
Quick ratio assess how well an organization meets its short-term financial abilities.
The quick ratio of Wingstop Inc indicates that the company might face difficulties in meeting
its short term obligations. Wingstop Inc reported a relatively lower quick ratio of 1.12 and
0.42 while KFC and McDonalds has reported a quick ratio of 1.04 and 0.78 respectively.
Given that Wingstop Inc has long-term prospects, it might borrow against the prospects to
meet its current obligations.
Quick Ratio
Quick Ratio 2012 2013 2014 2015 2016
WingStop Inc Nil 0.42 0.74 1.12 0.42
KFC Inc 1.07 1.09 1.15 0.97 1.04
McDonalds 1.09 1.3 1.2 3.05 0.78
2012 2013 2014 2015 2016
0
0.5
1
1.5
2
2.5
3
3.5
Quick Ratio
Graph 5: Representing Quick Ratio of WingStop, KFC and McDonalds
(Source: As Created by Author)
Graph 4: Representing Current Ratio of WingStop, KFC and McDonalds
(Source: As Created by Author)
Quick ratio:
Quick ratio assess how well an organization meets its short-term financial abilities.
The quick ratio of Wingstop Inc indicates that the company might face difficulties in meeting
its short term obligations. Wingstop Inc reported a relatively lower quick ratio of 1.12 and
0.42 while KFC and McDonalds has reported a quick ratio of 1.04 and 0.78 respectively.
Given that Wingstop Inc has long-term prospects, it might borrow against the prospects to
meet its current obligations.
Quick Ratio
Quick Ratio 2012 2013 2014 2015 2016
WingStop Inc Nil 0.42 0.74 1.12 0.42
KFC Inc 1.07 1.09 1.15 0.97 1.04
McDonalds 1.09 1.3 1.2 3.05 0.78
2012 2013 2014 2015 2016
0
0.5
1
1.5
2
2.5
3
3.5
Quick Ratio
Graph 5: Representing Quick Ratio of WingStop, KFC and McDonalds
(Source: As Created by Author)
11BUSINESS ANALYSIS PROJECT
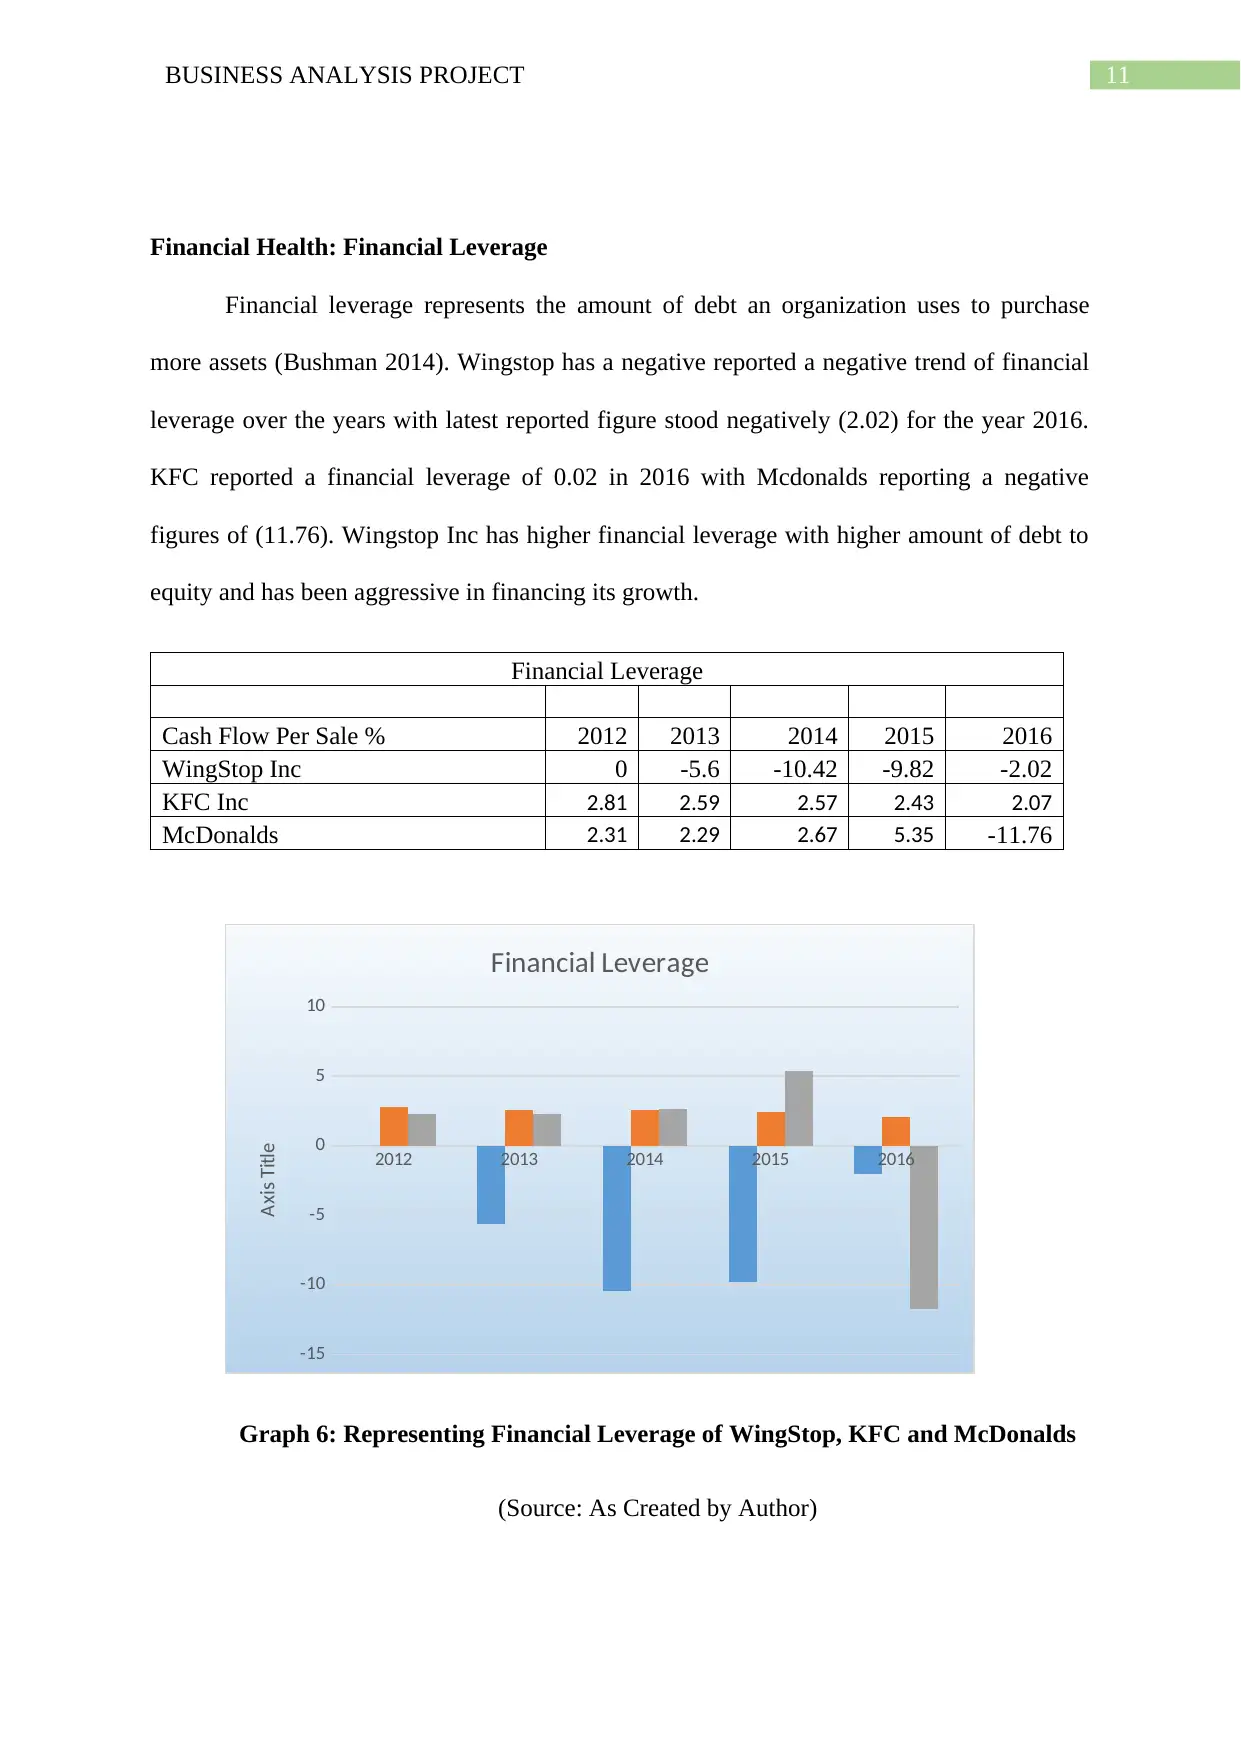
Financial Health: Financial Leverage
Financial leverage represents the amount of debt an organization uses to purchase
more assets (Bushman 2014). Wingstop has a negative reported a negative trend of financial
leverage over the years with latest reported figure stood negatively (2.02) for the year 2016.
KFC reported a financial leverage of 0.02 in 2016 with Mcdonalds reporting a negative
figures of (11.76). Wingstop Inc has higher financial leverage with higher amount of debt to
equity and has been aggressive in financing its growth.
Financial Leverage
Cash Flow Per Sale % 2012 2013 2014 2015 2016
WingStop Inc 0 -5.6 -10.42 -9.82 -2.02
KFC Inc 2.81 2.59 2.57 2.43 2.07
McDonalds 2.31 2.29 2.67 5.35 -11.76
2012 2013 2014 2015 2016
-15
-10
-5
0
5
10
Financial Leverage
Axis Title
Graph 6: Representing Financial Leverage of WingStop, KFC and McDonalds
(Source: As Created by Author)
⊘ This is a preview!⊘
Do you want full access?
Subscribe today to unlock all pages.
Trusted by 1+ million students worldwide
1 out of 27
Related Documents


Your All-in-One AI-Powered Toolkit for Academic Success.
+13062052269
info@desklib.com
Available 24*7 on WhatsApp / Email
![[object Object]](/_next/static/media/star-bottom.7253800d.svg)
Unlock your academic potential
Copyright © 2020–2026 A2Z Services. All Rights Reserved. Developed and managed by ZUCOL.