Wireless Network Design and Path Loss Analysis: Assessment 2 Project
VerifiedAdded on 2022/12/12
|14
|2012
|17
Project
AI Summary
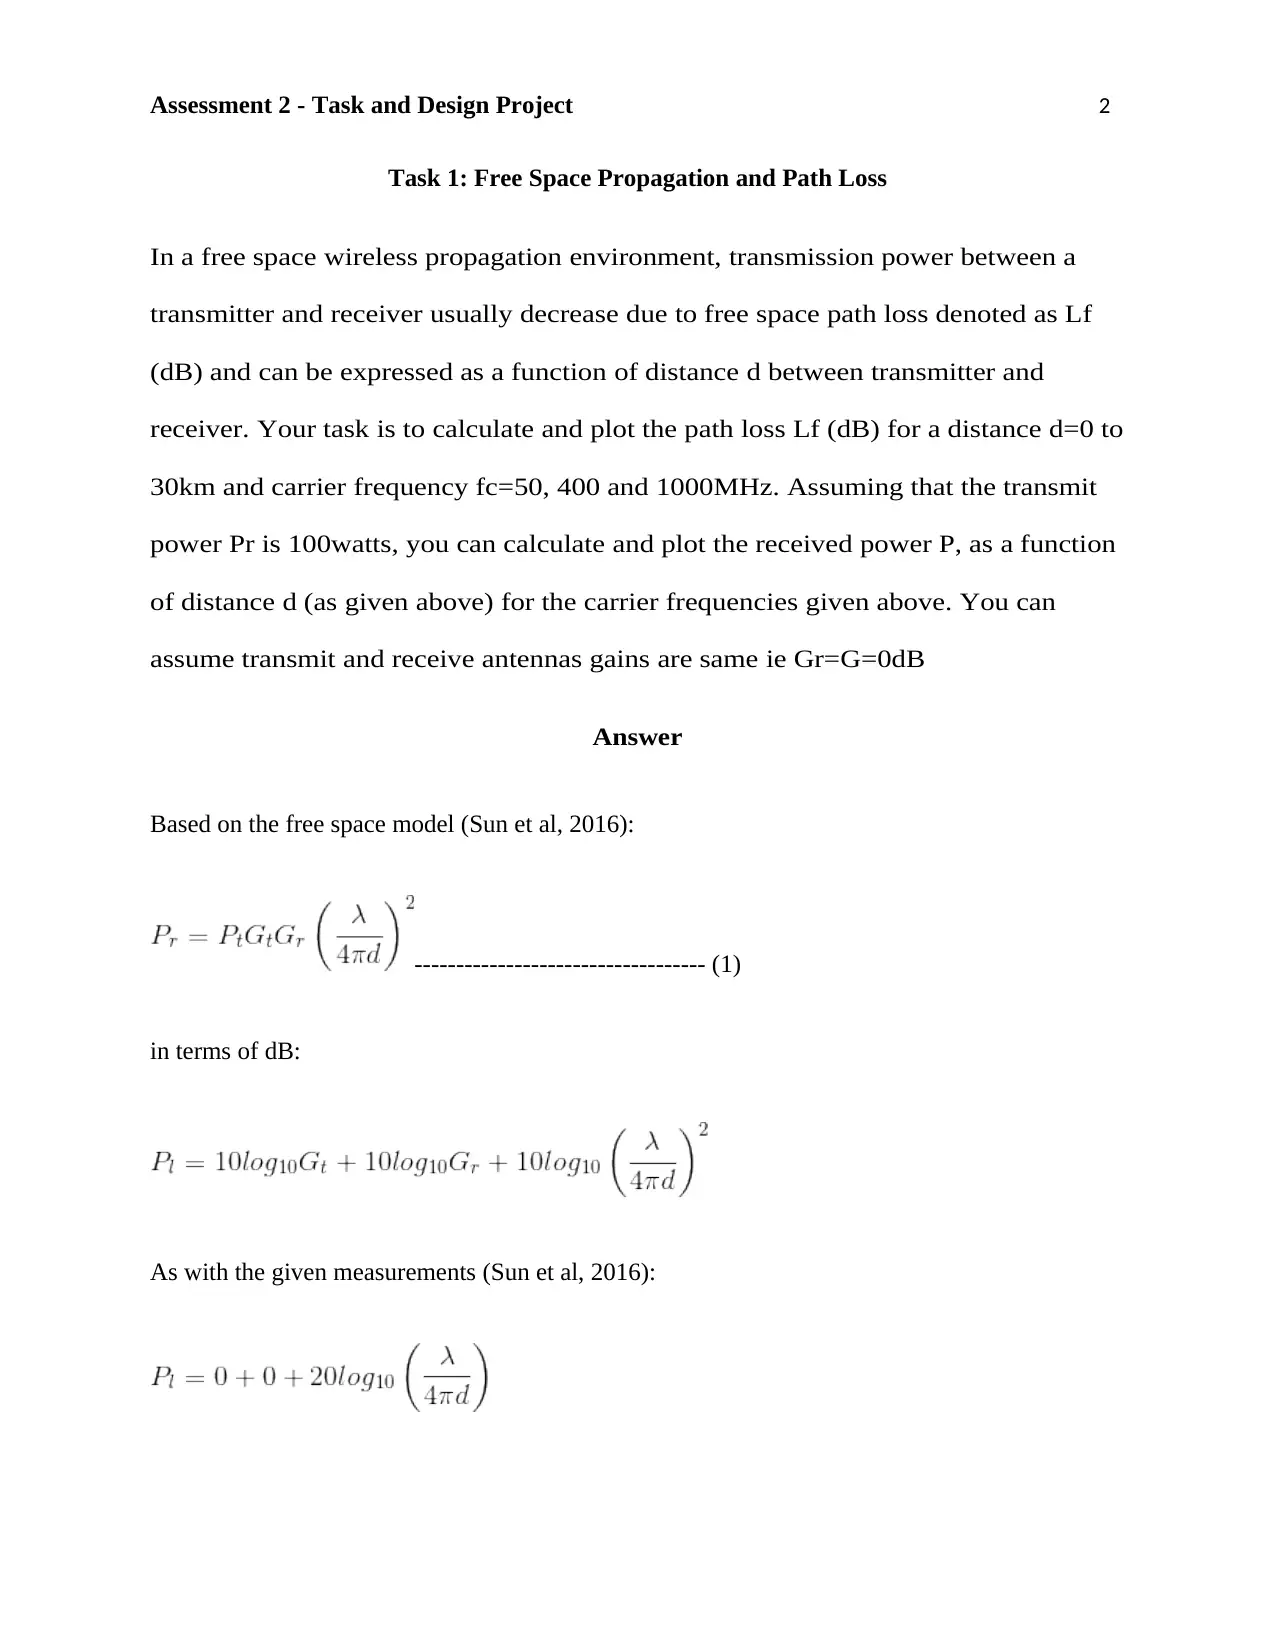
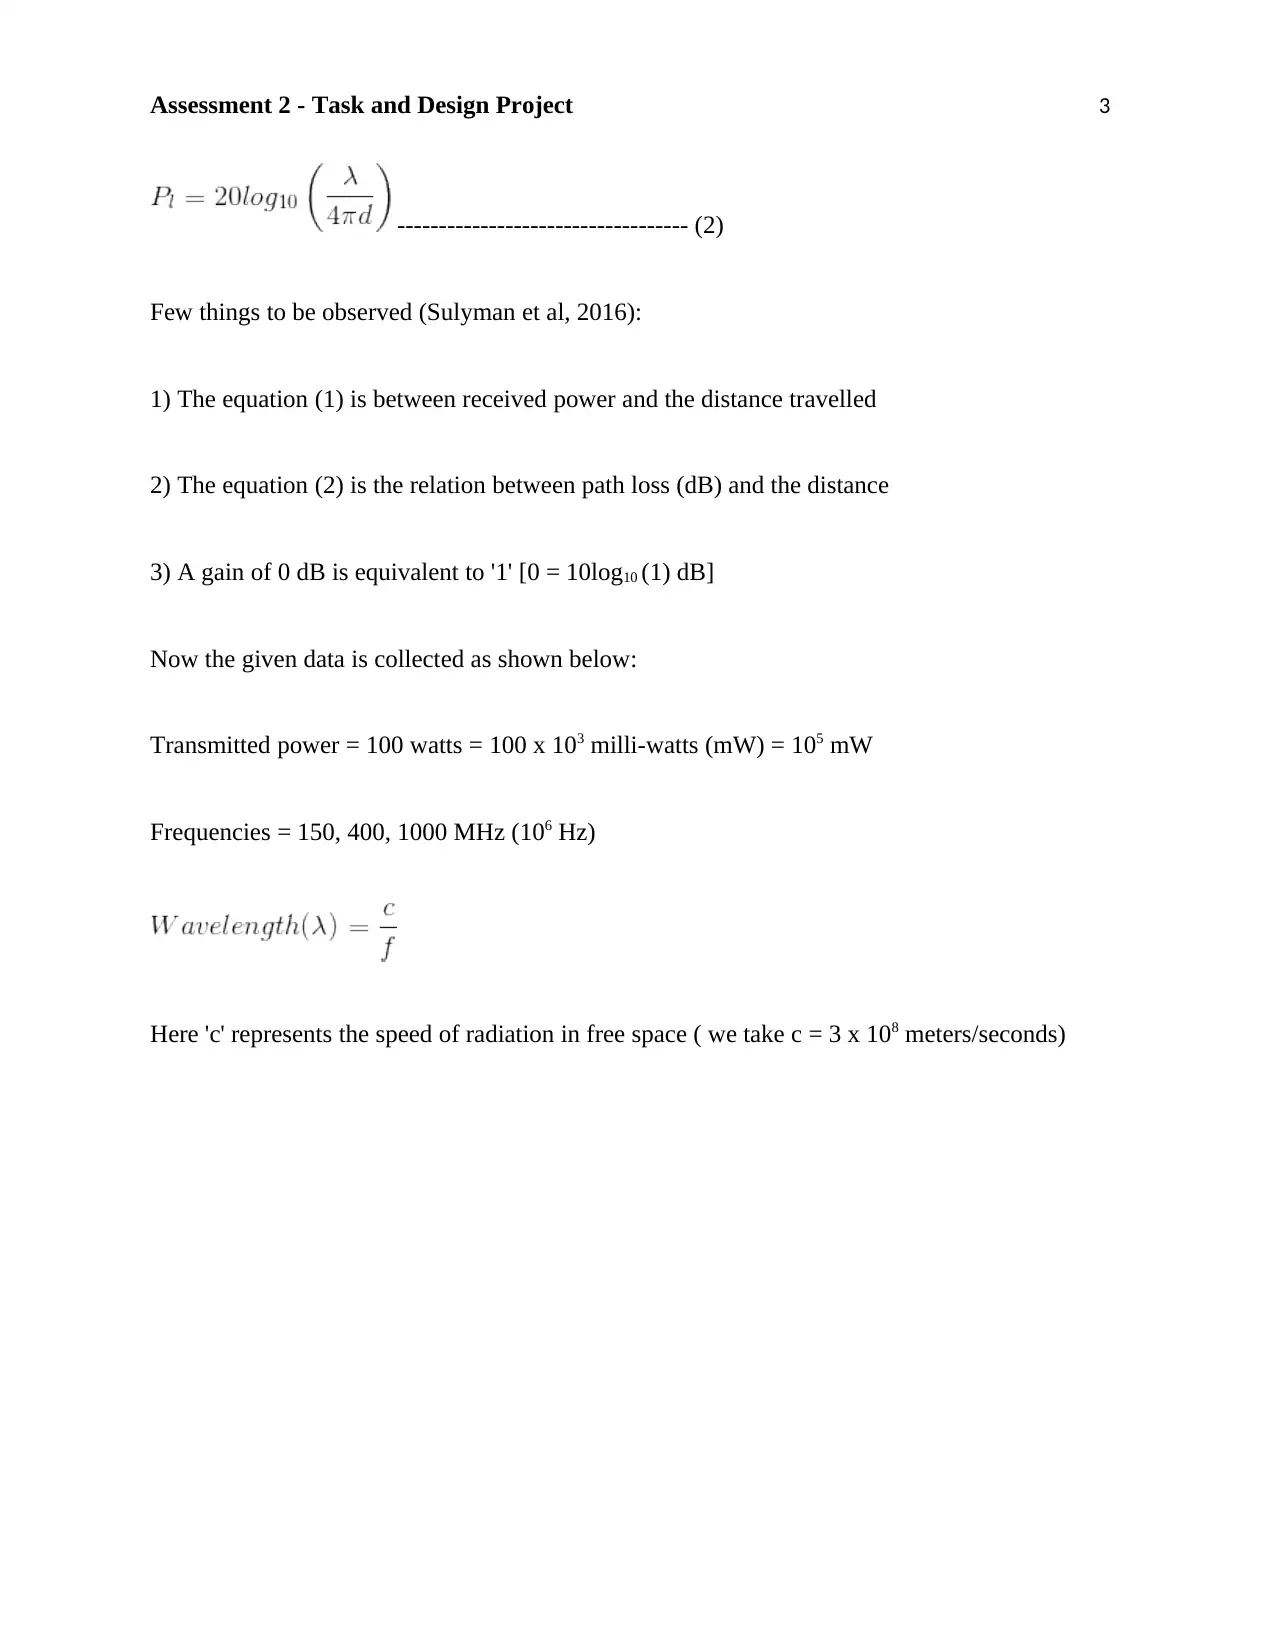
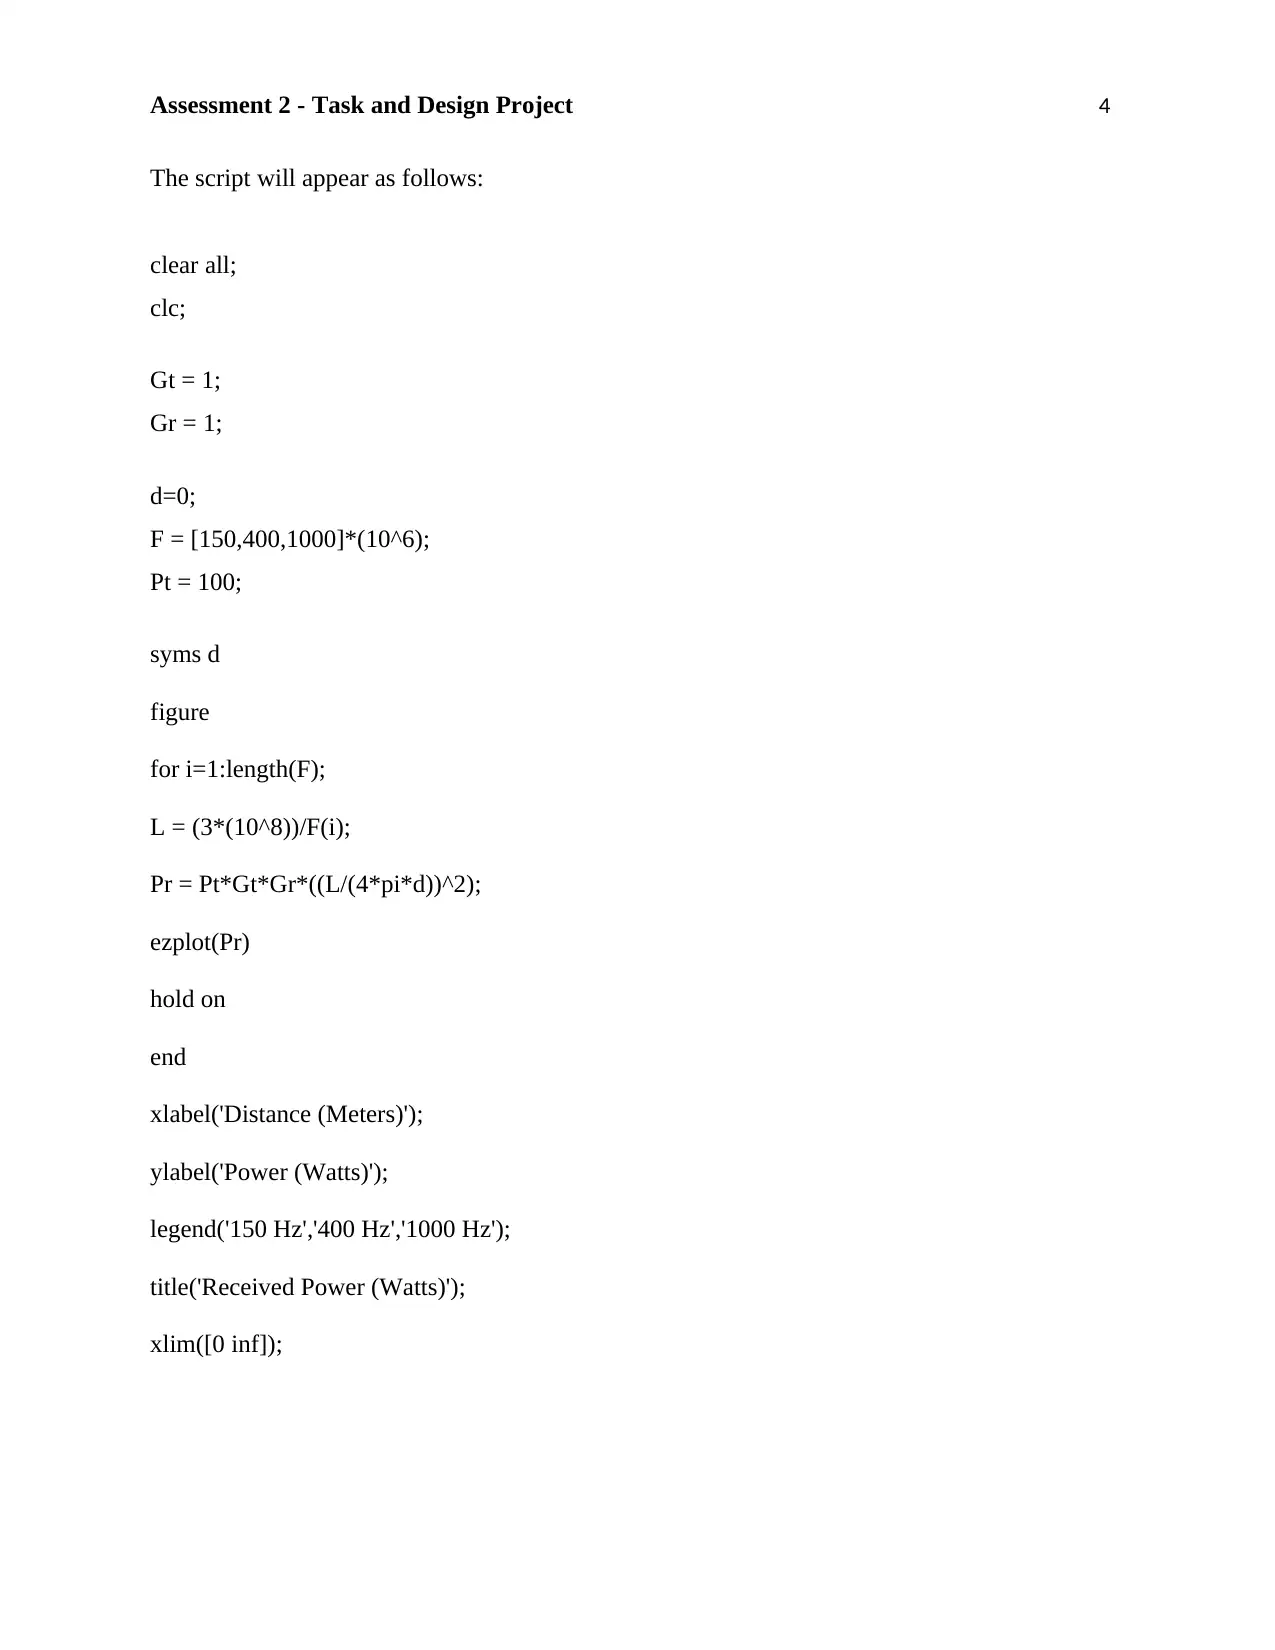
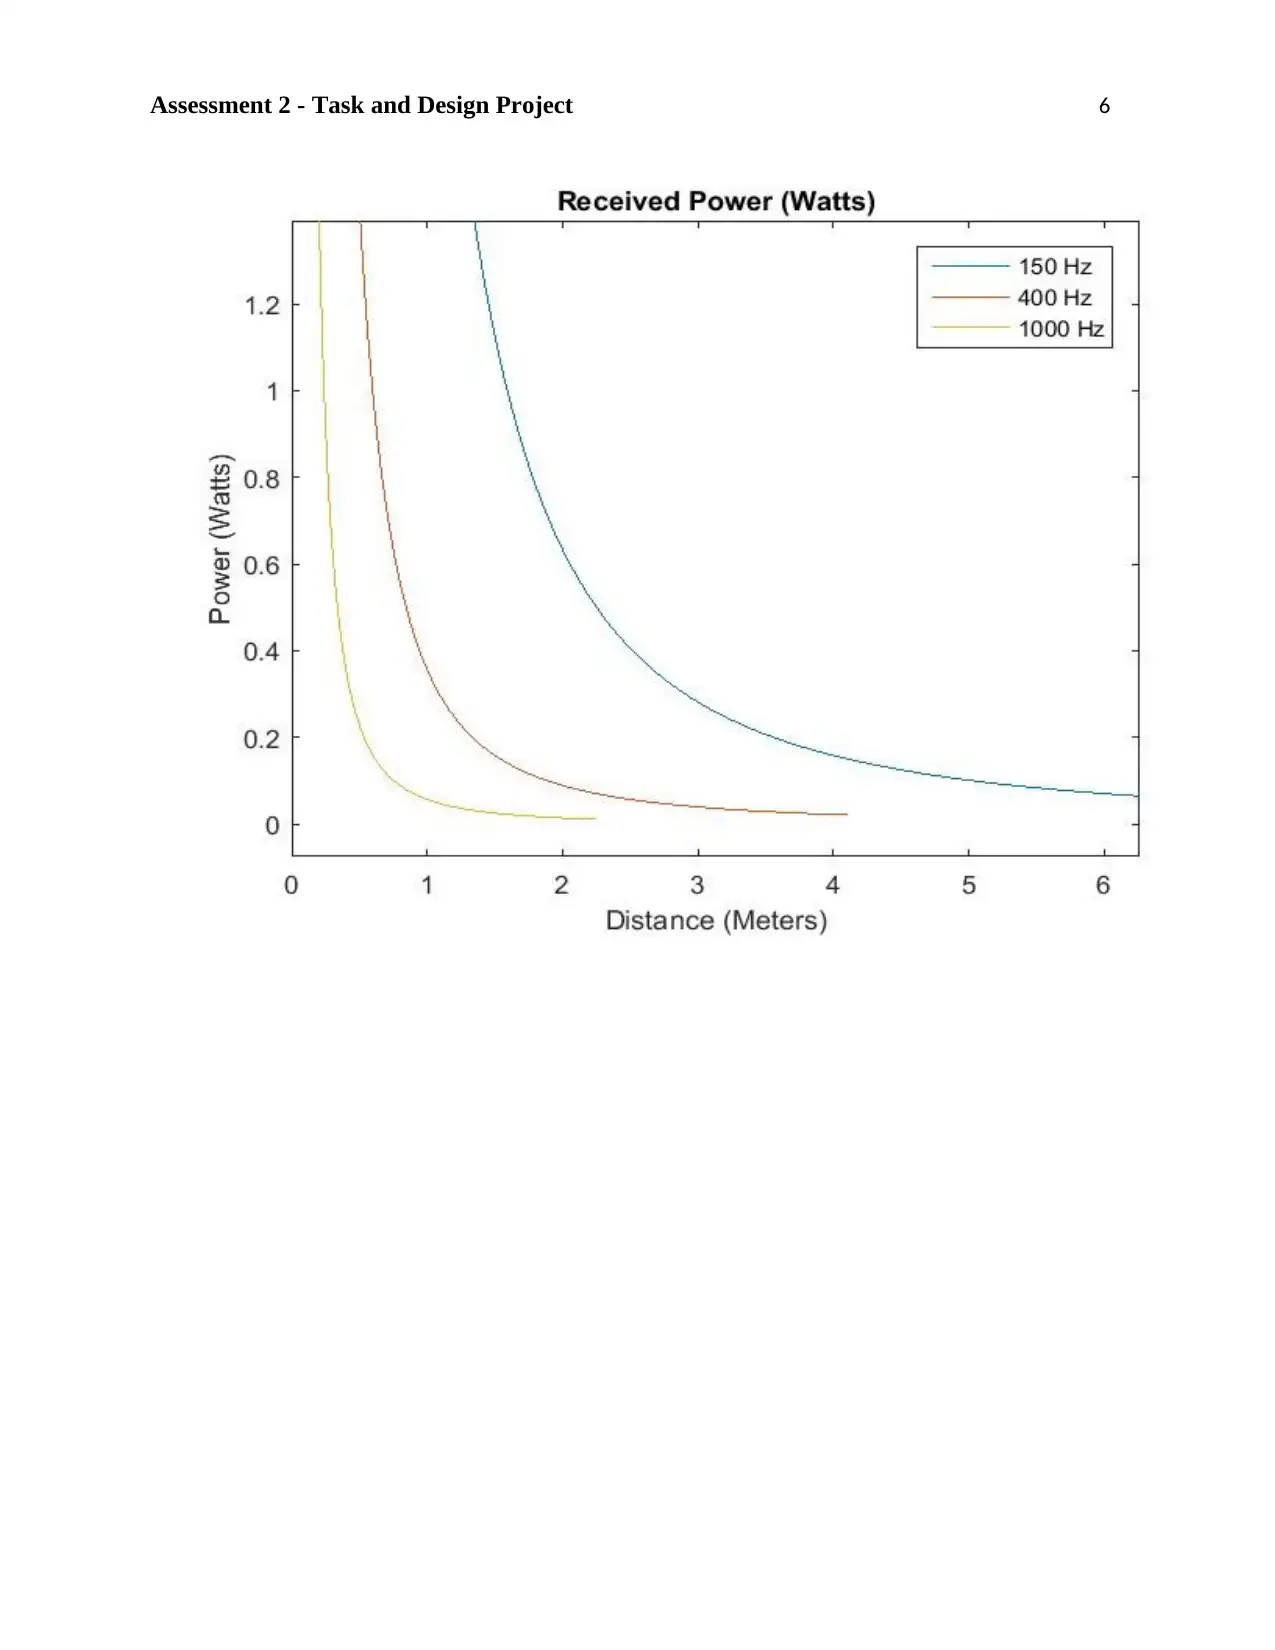
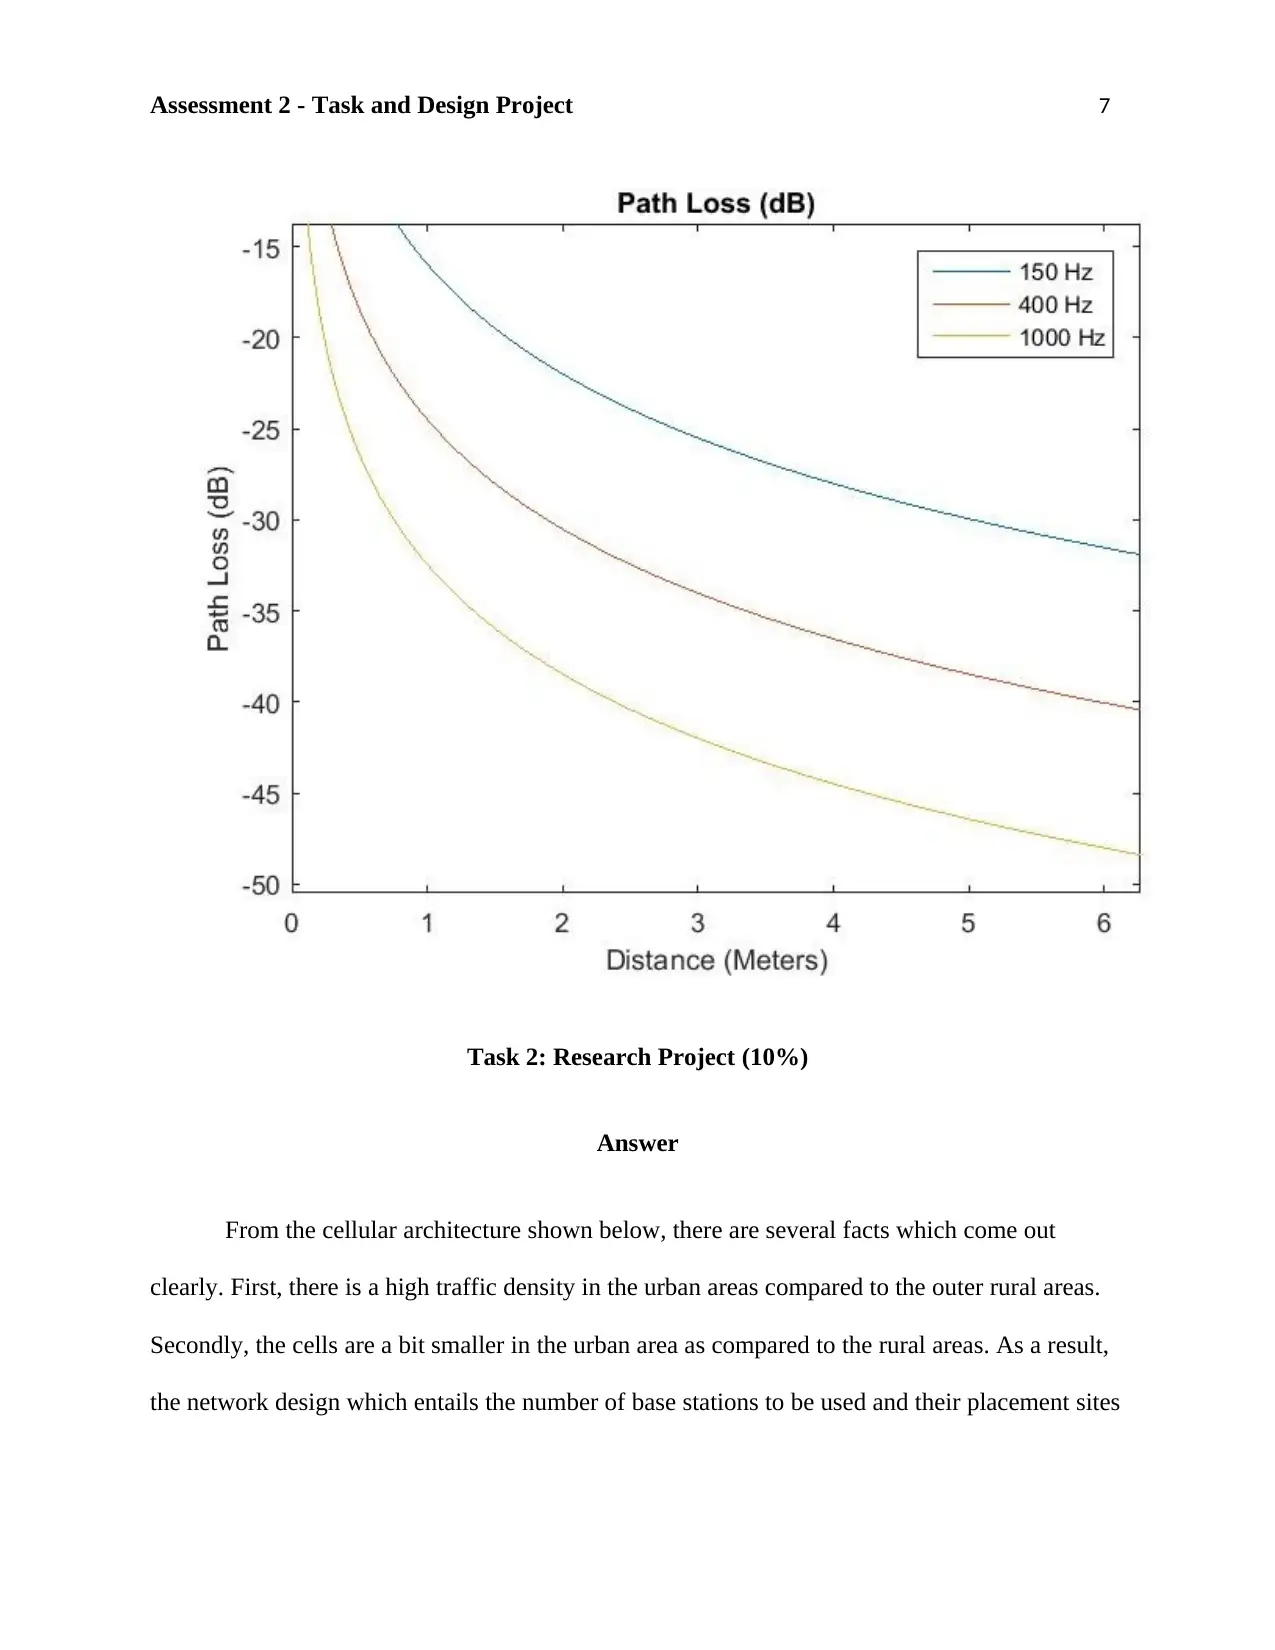
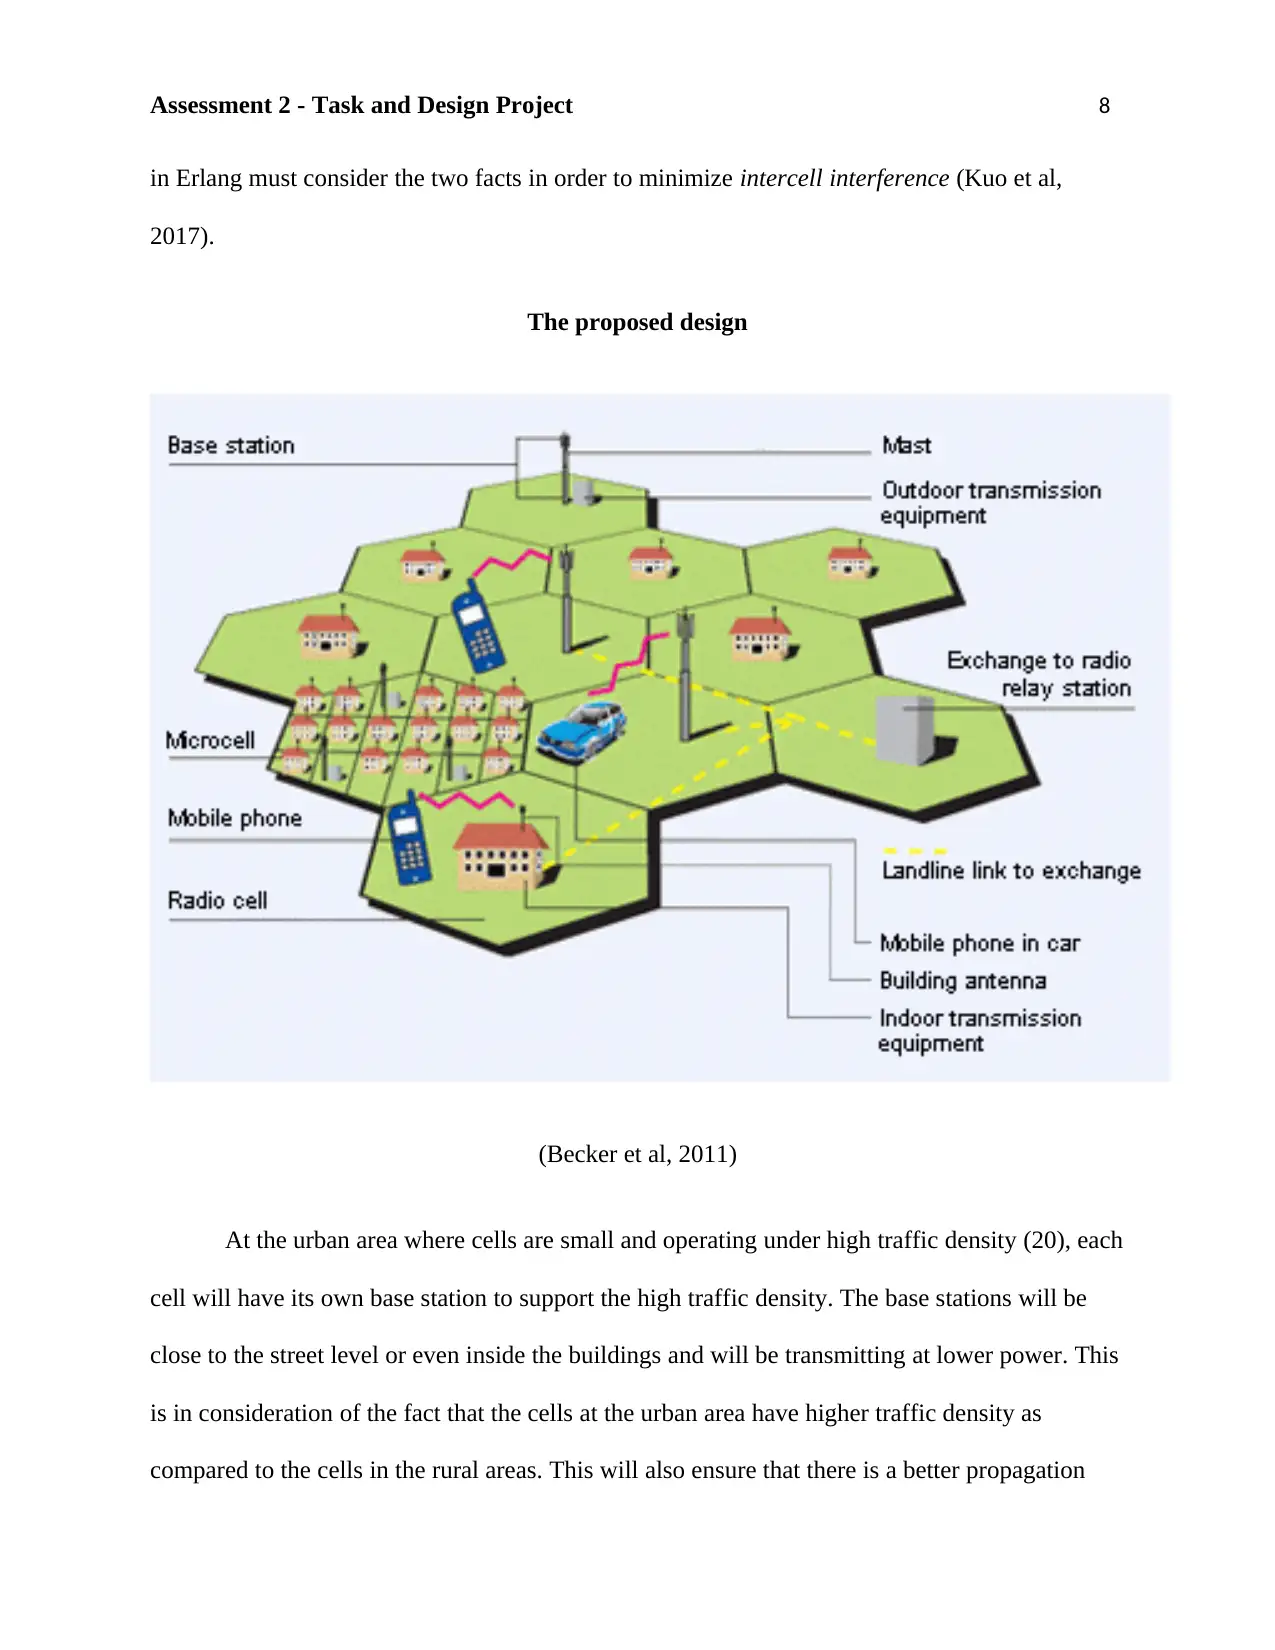
This assignment presents a comprehensive solution to a wireless network design project, addressing both theoretical and practical aspects. Task 1 focuses on calculating and plotting path loss in a free space propagation environment for different carrier frequencies (50, 400, and 1000 MHz) and rec...
Read More
Contribute Materials
Your contribution can guide someone’s learning journey. Share your
documents today.

Running Head: Assessment 2 - Task and Design Project 1
Assessment 2 - Task and Design Project
Student Name
Institution
Course
Date
Assessment 2 - Task and Design Project
Student Name
Institution
Course
Date
Secure Best Marks with AI Grader
Need help grading? Try our AI Grader for instant feedback on your assignments.

Assessment 2 - Task and Design Project 2
Task 1: Free Space Propagation and Path Loss
In a free space wireless propagation environment, transmission power between a
transmitter and receiver usually decrease due to free space path loss denoted as Lf
(dB) and can be expressed as a function of distance d between transmitter and
receiver. Your task is to calculate and plot the path loss Lf (dB) for a distance d=0 to
30km and carrier frequency fc=50, 400 and 1000MHz. Assuming that the transmit
power Pr is 100watts, you can calculate and plot the received power P, as a function
of distance d (as given above) for the carrier frequencies given above. You can
assume transmit and receive antennas gains are same ie Gr=G=0dB
Answer
Based on the free space model (Sun et al, 2016):
----------------------------------- (1)
in terms of dB:
As with the given measurements (Sun et al, 2016):

Assessment 2 - Task and Design Project 3
----------------------------------- (2)
Few things to be observed (Sulyman et al, 2016):
1) The equation (1) is between received power and the distance travelled
2) The equation (2) is the relation between path loss (dB) and the distance
3) A gain of 0 dB is equivalent to '1' [0 = 10log10 (1) dB]
Now the given data is collected as shown below:
Transmitted power = 100 watts = 100 x 103 milli-watts (mW) = 105 mW
Frequencies = 150, 400, 1000 MHz (106 Hz)
Here 'c' represents the speed of radiation in free space ( we take c = 3 x 10⁸ meters/seconds)

Assessment 2 - Task and Design Project 4
The script will appear as follows:
clear all;
clc;
Gt = 1;
Gr = 1;
d=0;
F = [150,400,1000]*(10^6);
Pt = 100;
syms d
figure
for i=1:length(F);
L = (3*(10^8))/F(i);
Pr = Pt*Gt*Gr*((L/(4*pi*d))^2);
ezplot(Pr)
hold on
end
xlabel('Distance (Meters)');
ylabel('Power (Watts)');
legend('150 Hz','400 Hz','1000 Hz');
title('Received Power (Watts)');
xlim([0 inf]);
Secure Best Marks with AI Grader
Need help grading? Try our AI Grader for instant feedback on your assignments.

Assessment 2 - Task and Design Project 5
figure
for i=1:length(F);
L = (3*(10^8))/F(i);
Pl = 20*log10(L/(4*pi*d));
ezplot(Pl)
hold on
end
xlabel('Distance (Meters)');
ylabel('Path Loss (dB)');
legend('150 Hz','400 Hz','1000 Hz');
title('Path Loss (dB)');
xlim([0 inf]);
figure
for i=1:length(F);
L = (3*(10^8))/F(i);
Pl = 20*log10(L/(4*pi*d));
ezplot(Pl)
hold on
end
xlabel('Distance (Meters)');
ylabel('Path Loss (dB)');
legend('150 Hz','400 Hz','1000 Hz');
title('Path Loss (dB)');
xlim([0 inf]);

Assessment 2 - Task and Design Project 6

Assessment 2 - Task and Design Project 7
Task 2: Research Project (10%)
Answer
From the cellular architecture shown below, there are several facts which come out
clearly. First, there is a high traffic density in the urban areas compared to the outer rural areas.
Secondly, the cells are a bit smaller in the urban area as compared to the rural areas. As a result,
the network design which entails the number of base stations to be used and their placement sites
Paraphrase This Document
Need a fresh take? Get an instant paraphrase of this document with our AI Paraphraser

Assessment 2 - Task and Design Project 8
in Erlang must consider the two facts in order to minimize intercell interference (Kuo et al,
2017).
The proposed design
(Becker et al, 2011)
At the urban area where cells are small and operating under high traffic density (20), each
cell will have its own base station to support the high traffic density. The base stations will be
close to the street level or even inside the buildings and will be transmitting at lower power. This
is in consideration of the fact that the cells at the urban area have higher traffic density as
compared to the cells in the rural areas. This will also ensure that there is a better propagation

Assessment 2 - Task and Design Project 9
condition in the area since lower base stations have reduced shadowing and multipath (Kuo et al,
2017).
Out of the urban core, there is a suburban area where the cells are a bit larger than the
cells in the urban core but smaller than the cells in the rural areas. Also, the user density or traffic
density (14) is less than the urban core but greater than the rural area. The proposed design will
first consider the spatial separation of the cells at this area to determine whether reuse of the
same channel set (base station) can be applied. Where the reuse distance is small, the cells will
be set to share one base station. Evaluating the reuse distance to ensure it is as small as possible
will be done to maximize the spectral efficiency which is obtained by frequency reuse (Kuo et al,
2017).
On the other hand, based on the principle of frequency reuse which exploits the path loss
to reuse frequency spectrum at spatially separated locations, at the rural areas where the cell size
is very big the base stations will be placed on tall buildings or tall structures and will be
transmitting at very high power in order to have cell coverage of several squire miles. Signals
from these base stations will be propagated uniformly in all directions to allow mobile users
moving around the base stations to approximately receive power constantly (Wang et al, 2017).
Rectangular Antennas will be used in rural areas. Basically, rectangular antennas are
directional antennas which are used to serve the areas outside the vicinity of the tower (Wang et
al, 2017).

Assessment 2 - Task and Design Project 10
(Becker et al, 2011)
In the proposed design, these antennas will be connected to the BTS through coaxial
cables to facilitate receiving and transmitting data from nearby users. The reason behind using
the antennas at the rural areas rather than the urban areas of Erlang is because the base stations at
the rural areas of this town will be shared between different cells (Wang et al, 2017).
However, to facilitate communication between different BTSs, circular antennas will also
be used in this proposed design (Wang et al, 2017).
Secure Best Marks with AI Grader
Need help grading? Try our AI Grader for instant feedback on your assignments.

Assessment 2 - Task and Design Project 11
(Becker et al, 2011)
For this design, these antennas will be operating at microwave frequencies having point
to point transmission and reception points. They will be connected to the BTSs using the
waveguides. The waveguides, on the other hand, will be terminating at the BTSs from which
information will be disbursed to the surrounding areas through the outdoor antenna units
(Rectangular Antennas) (Wang et al, 2017)
In order to come up with effective antennas, and minimize intercell interference as much
as possible, the proposed design will use lower gain antennas at the core urban area. This is
because in the core urban area of Erlang where traffic density is high and each cell has its own
base station; if the antenna gain is high the intercell interference will be very high as well.
However, at the rural areas of Erlang where the cells are large, traffic density is low and base
stations are shared between cells. Antennas of higher gain will be used. This is because higher
gain antennas are more effective in their radiation patterns (Kuo et al, 2017)

Assessment 2 - Task and Design Project 12
(2) Looking at Figure 1 below, justify the design of this cellular network with appropriate
reasoning? (2 marks)
The central part represents the urban area. It is full of towers because urban connections
usually work under high speed. Because of high-speed requirements, it has been equipped with
many towers to support and facilitate that. Particularly, the city has been represented by the
towers marked with letter 20. The next area after the urban area is the suburban area which is
slightly less dense than the urban area but denser than the rural area. From the diagram, this area
has towers marked by letter 12. Right from the suburban area is the rural area where the towers
are sparsely populated. Specifically, towers in this area are marked by letter 8. The optimized

Assessment 2 - Task and Design Project 13
shape of the base station considering all the possible outcomes is hexagon. It has optimized area
utilization with network users at every part compared to other shapes. So, hexagon is chosen in
this case.
References
Becker, R. A., Caceres, R., Hanson, K., Loh, J. M., Urbanek, S., Varshavsky, A., & Volinsky, C.
(2011). A tale of one city: Using cellular network data for urban planning. IEEE
Pervasive Computing, 10(4), 18-26.
Kuo, J. J., Shen, S. H., Kang, H. Y., Yang, D. N., Tsai, M. J., & Chen, W. T. (2017, May).
Service chain embedding with maximum flow in software defined network and
application to the next-generation cellular network architecture. In IEEE INFOCOM
2017-IEEE Conference on Computer Communications (pp. 1-9). IEEE.
Sulyman, A. I., Alwarafy, A., MacCartney, G. R., Rappaport, T. S., & Alsanie, A. (2016).
Directional radio propagation path loss models for millimeter-wave wireless networks in
the 28-, 60-, and 73-GHz bands. IEEE Transactions on Wireless
Communications, 15(10), 6939-6947.
Sun, S., Rappaport, T. S., Rangan, S., Thomas, T. A., Ghosh, A., Kovacs, I. Z., ... & Jarvelainen,
J. (2016, May). Propagation path loss models for 5G urban micro-and macro-cellular
scenarios. In 2016 IEEE 83rd Vehicular Technology Conference (VTC Spring) (pp. 1-6).
IEEE.
Wang, J., Ji, L., Liu, X. Y. A., & Shafiq, M. Z. (2017). U.S. Patent No. 9,693,237. Washington,
DC: U.S. Patent and Trademark Office.
Paraphrase This Document
Need a fresh take? Get an instant paraphrase of this document with our AI Paraphraser

Assessment 2 - Task and Design Project 14
1 out of 14
Related Documents

Your All-in-One AI-Powered Toolkit for Academic Success.
+13062052269
info@desklib.com
Available 24*7 on WhatsApp / Email
Unlock your academic potential
© 2024 | Zucol Services PVT LTD | All rights reserved.