Wireless Networking Assignment: Free Space Propagation and Design

Verified

Added on  2022/11/23

|8
|1078
|286
Homework Assignment
AI Summary
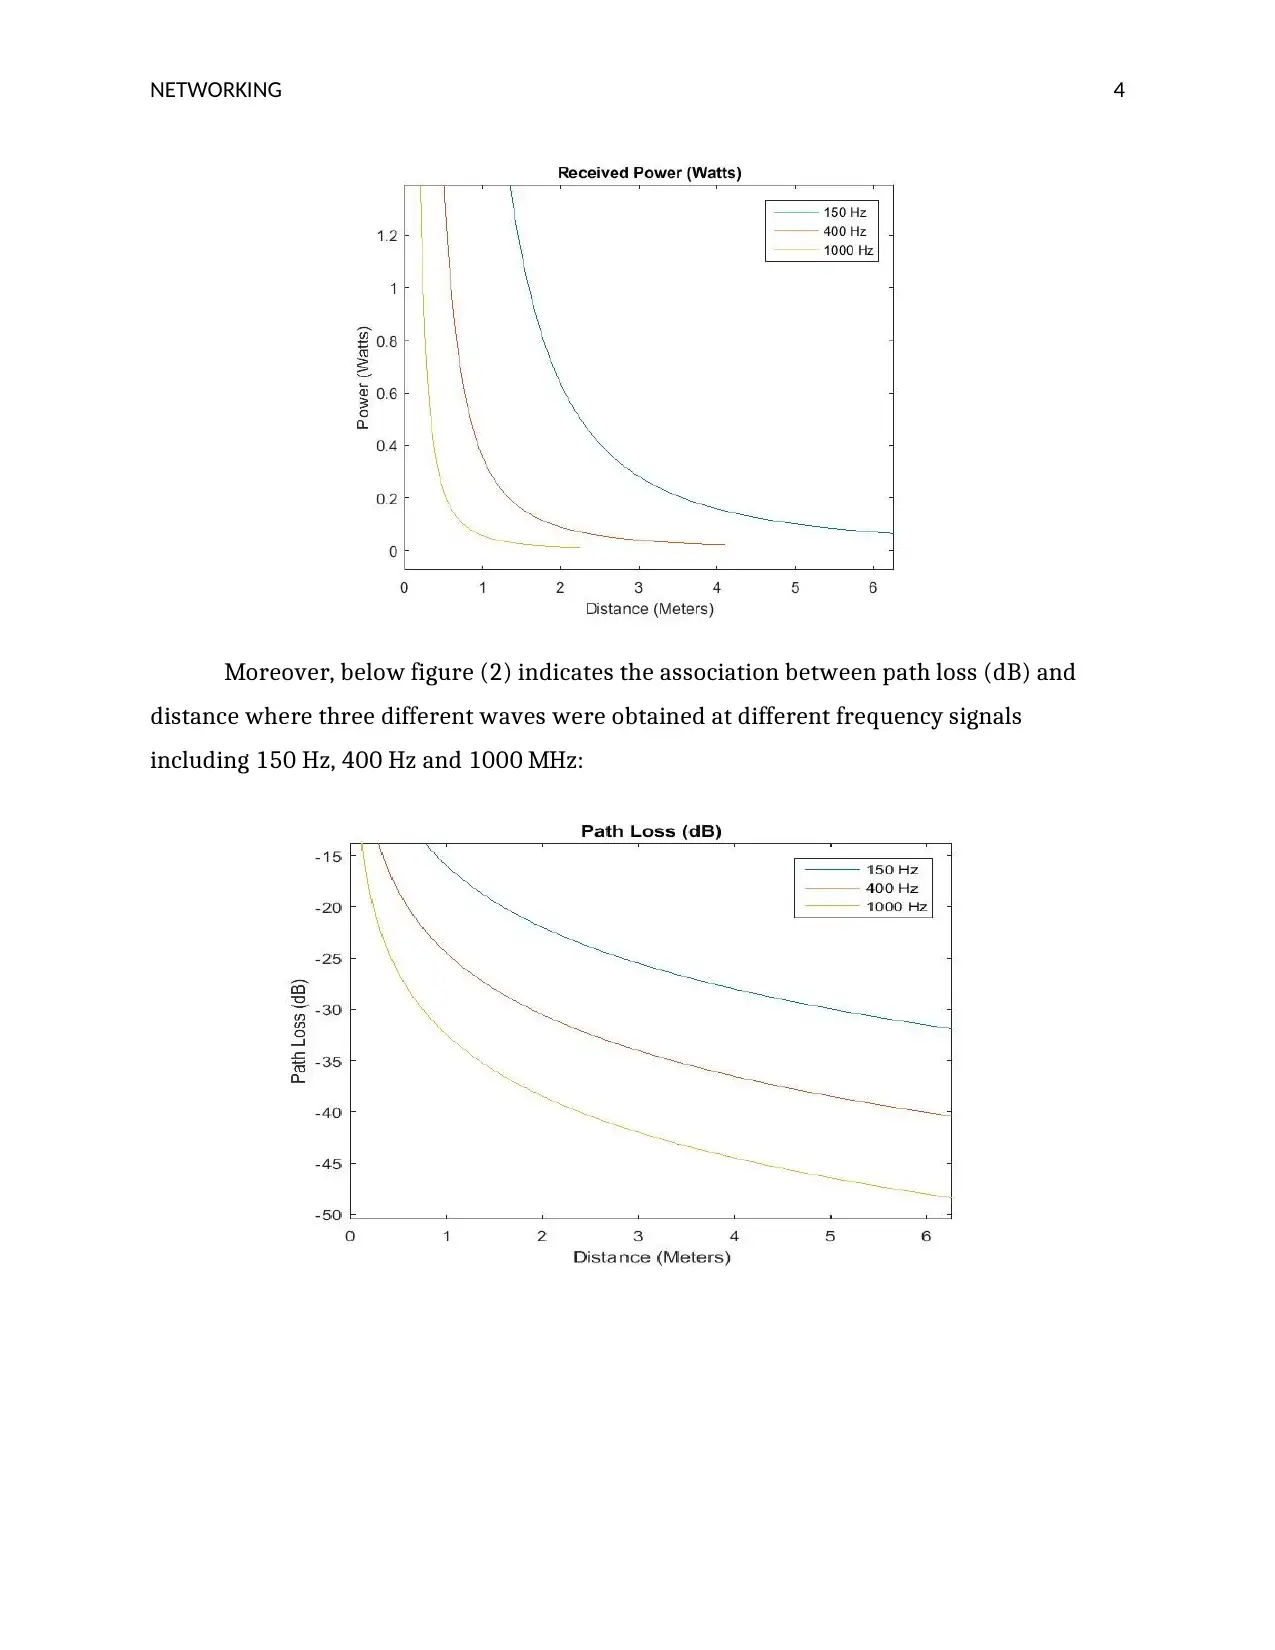
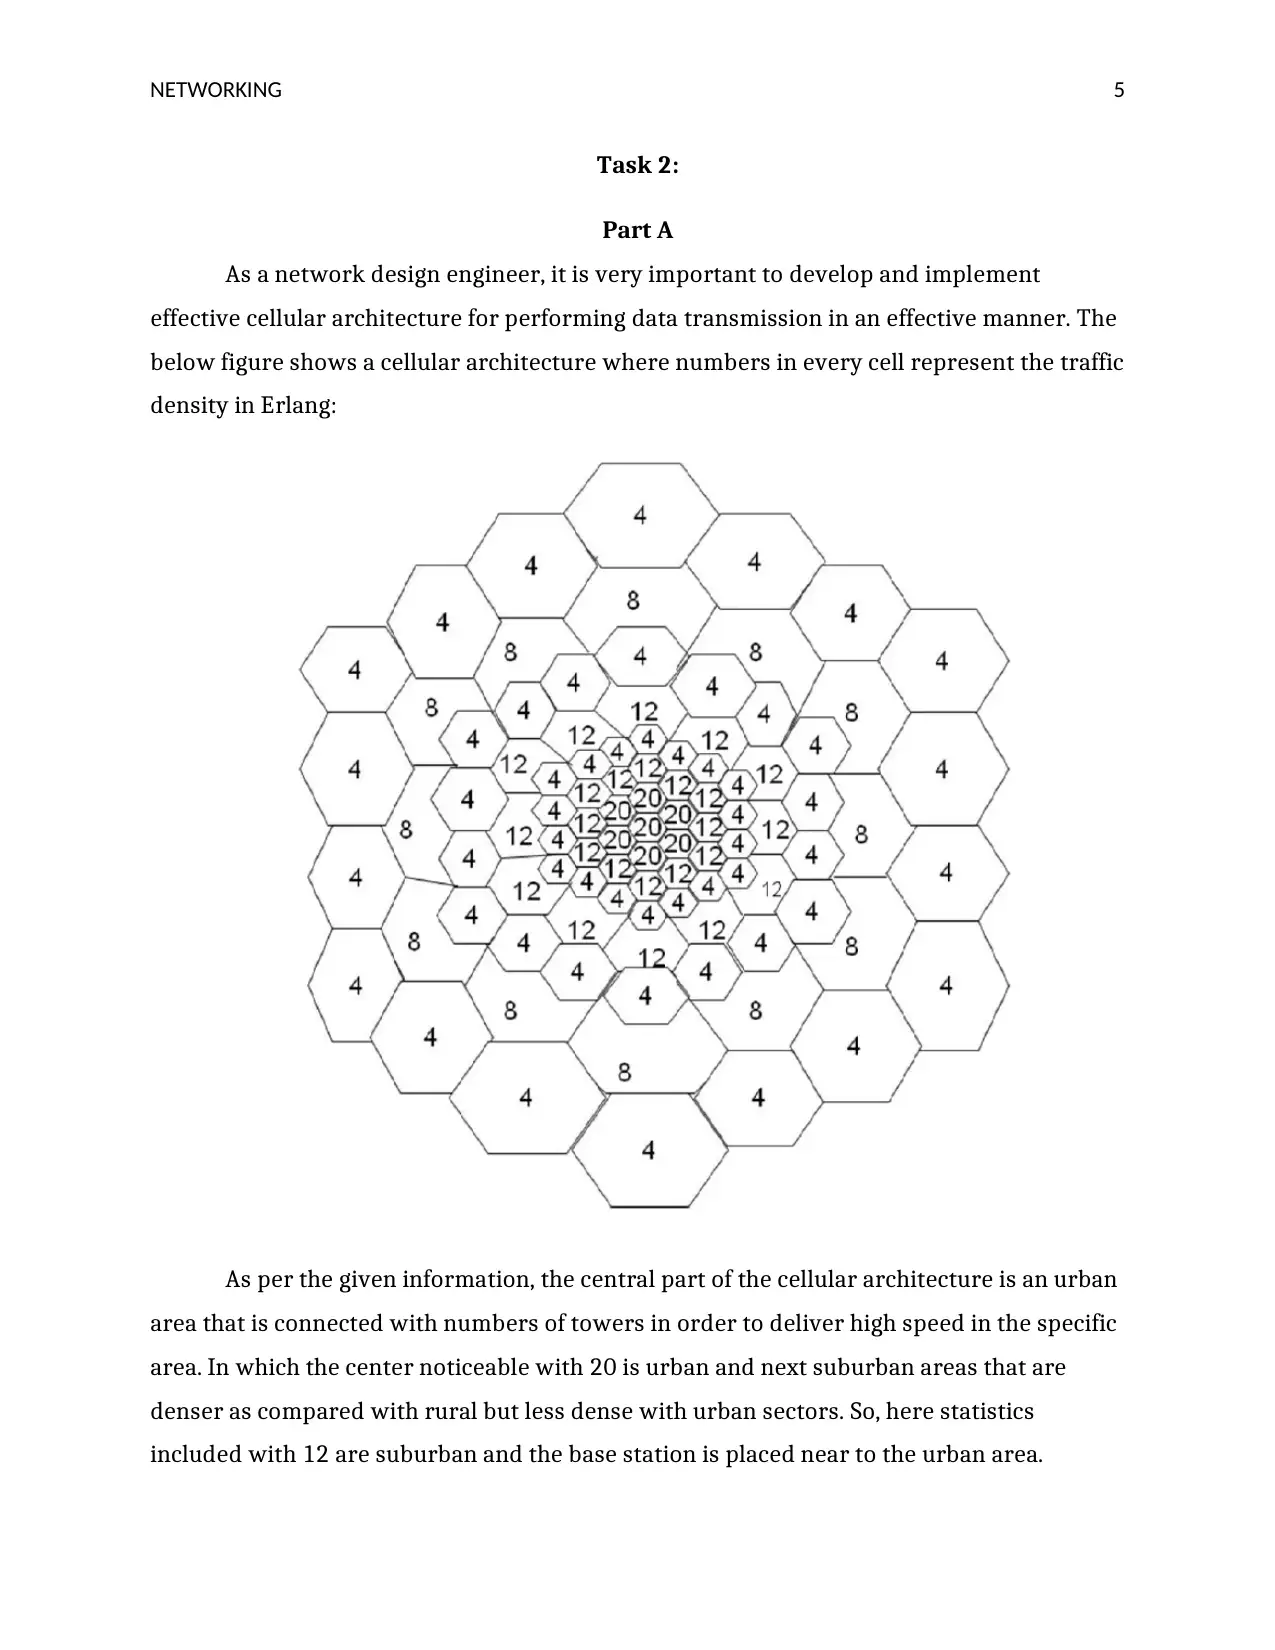
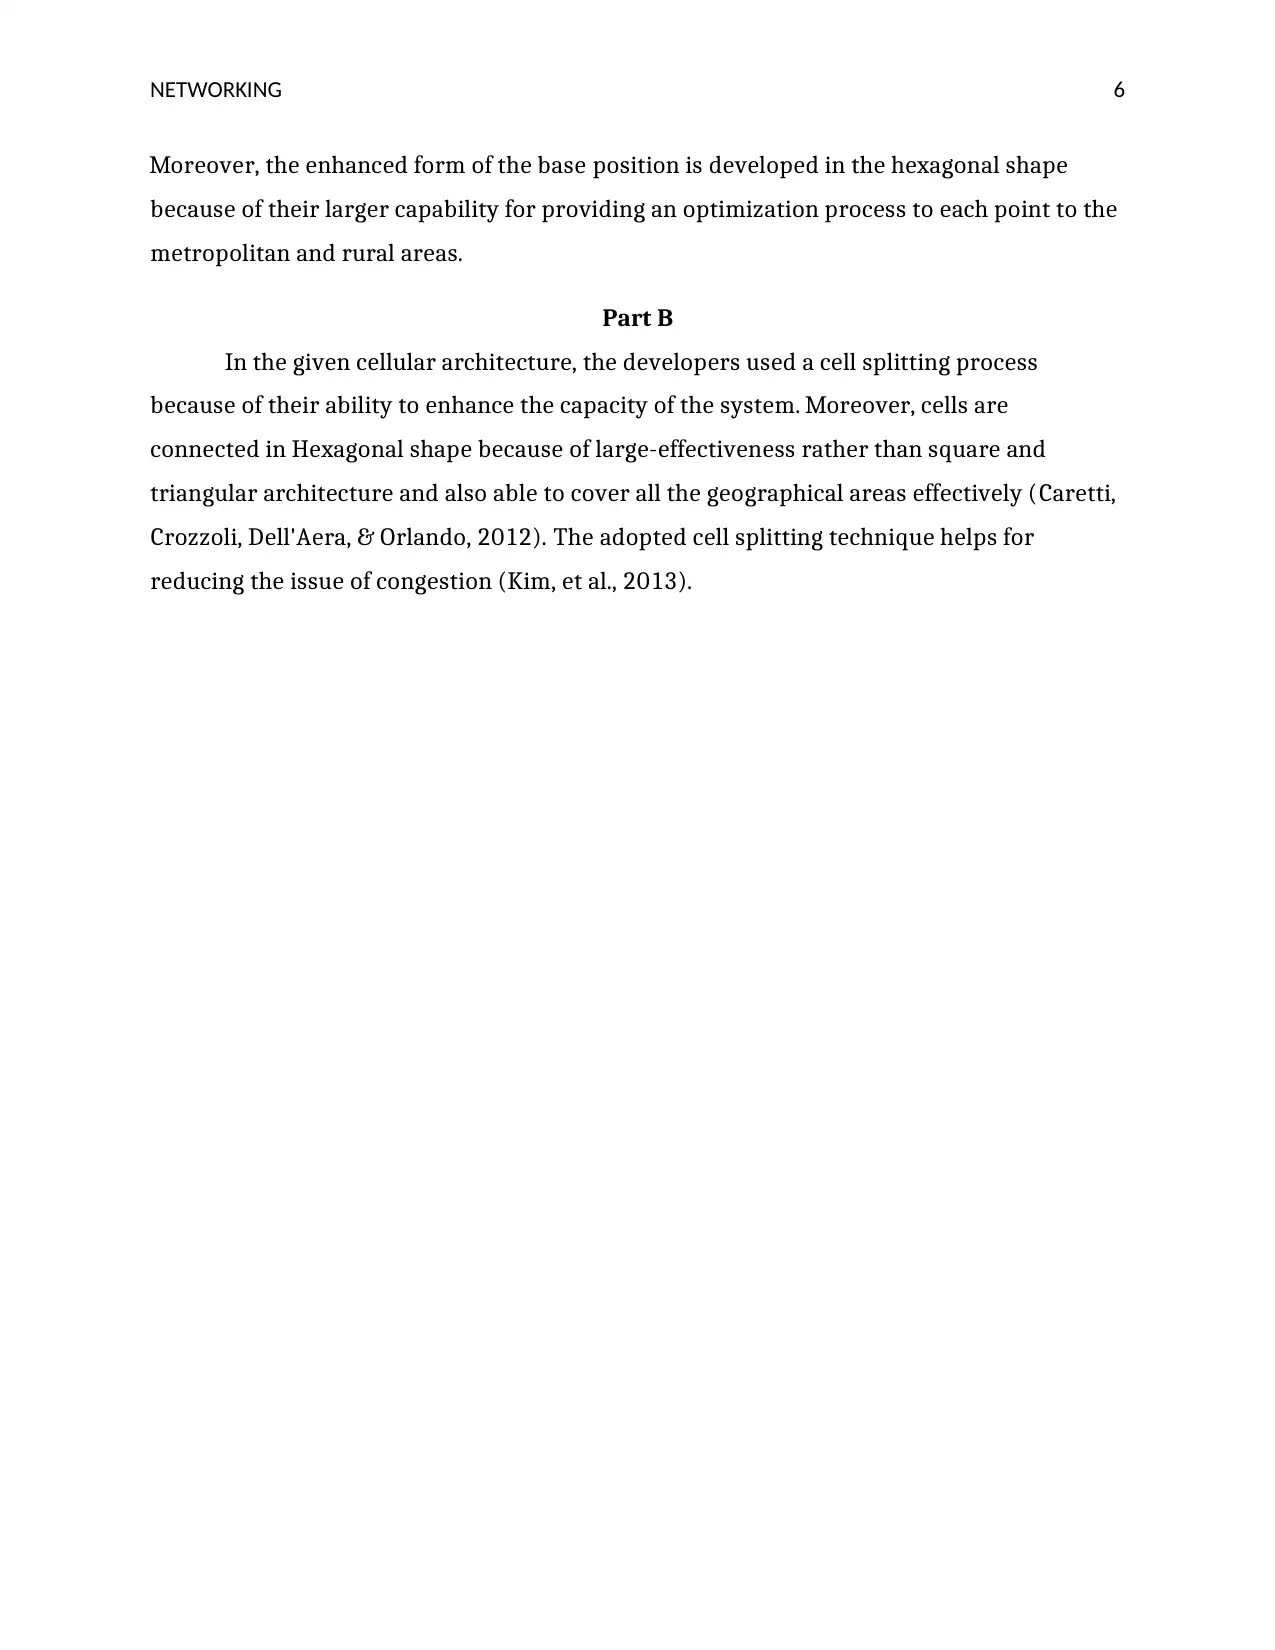
This assignment solution addresses two main tasks in wireless networking. Task 1 focuses on calculating and plotting path loss in a free space propagation environment. It involves determining path loss (dB) and received power as a function of distance for carrier frequencies of 150, 400, and 1000 MHz, assuming a transmit power of 100 watts. The solution includes the relevant formulas, calculations, and GNU Octave code for generating the required plots. Task 2 involves a research project where the student acts as a network design engineer, focusing on designing a cellular architecture. This includes describing the layout of cells, traffic density, and cell splitting techniques. The solution explains the cellular architecture, the rationale behind cell splitting, and the hexagonal cell shape, referencing relevant literature to support the design choices. The assignment highlights the importance of effective cellular architecture for efficient data transmission.
tabler-icon-diamond-filled.svg

Contribute Materials

Your contribution can guide someone’s learning journey. Share your documents today.
Document Page
NETWORKING 0
Wireless Networking
tabler-icon-diamond-filled.svg

Secure Best Marks with AI Grader

Need help grading? Try our AI Grader for instant feedback on your assignments.
Document Page
NETWORKING 1
Task 1:
Calculation
From the given question it is observed that in free space communication, transmit
power between the source and destination is represented as Lf(dB) and distance is
represented as (d). There are the following values given in the question:
d= 0 to 30 kilometer
Fc= 150, 400 and 1000 MHz
Pt= 100 watts
Gt= Gr= 0 dB
Path Loss (Lf) =?
After reviewing the free space model it is found that the total received power is
given as:
---------------------- (Sulyman, et al., 2014) (1)
Solving the above equation in dB total path loss can be determined which is given
below:
---------------------- (2)
(Phillips, Sicker, & Grunwald, 2012).
Therefore, by putting the given values in the above formula total path loss can be
calculated which is highlighted below:
Document Page
NETWORKING 2
Or,
Now, it is observed that the wavelength of a signal can be determined using the
below formula:
Here, c = 3 x 10⁸ meters/seconds
Moreover, transmitted power= 100 watts
Or, Pt= 100 x 103 milli-watts (mW) = 105 mW
Therefore, it is stated that equation number (1) shows received the power of the
signal in terms of distance and equation (2) indicates total path loss in terms of distance
and frequency.
GNU Octave Code
The below GNU code can be used for plotting graph between the path loss and
distance along with the received power in which path loss and received power both
contains variable distance.
clear all;
clc;
Gt = 1;
Gr = 1;
F = [150,400,1000]*(10^6);
Pt = 100;
Document Page
NETWORKING 3
syms d
figure
for i=1:length(F)
L = (3*(10^8))/F(i);
Pr = Pt*Gt*Gr*((L/(4*pi*d))^2);
ezplot(Pr)
hold on
end
xlabel('Distance (Meters)');
ylabel('Power (Watts)');
legend('150 Hz','400 Hz','1000 Hz');
title('Received Power (Watts)');
xlim([0 inf]);
figure
for i=1:length(F)
L = (3*(10^8))/F(i);
Pl = 20*log10(L/(4*pi*d));
ezplot(Pl)
hold on
end
xlabel('Distance (Meters)');
ylabel('Path Loss (dB)');
legend('150 Hz','400 Hz','1000 Hz');
title('Path Loss (dB)');
xlim([0 inf]);
The output of the GNU code:
Below figure (1) indicates the relative between the established power and distance
at different frequency signals (150, 400 and 1000 MHz):
tabler-icon-diamond-filled.svg

Secure Best Marks with AI Grader

Need help grading? Try our AI Grader for instant feedback on your assignments.
Document Page
NETWORKING 4
Moreover, below figure (2) indicates the association between path loss (dB) and
distance where three different waves were obtained at different frequency signals
including 150 Hz, 400 Hz and 1000 MHz:
Document Page
NETWORKING 5
Task 2:
Part A
As a network design engineer, it is very important to develop and implement
effective cellular architecture for performing data transmission in an effective manner. The
below figure shows a cellular architecture where numbers in every cell represent the traffic
density in Erlang:
As per the given information, the central part of the cellular architecture is an urban
area that is connected with numbers of towers in order to deliver high speed in the specific
area. In which the center noticeable with 20 is urban and next suburban areas that are
denser as compared with rural but less dense with urban sectors. So, here statistics
included with 12 are suburban and the base station is placed near to the urban area.
Document Page
NETWORKING 6
Moreover, the enhanced form of the base position is developed in the hexagonal shape
because of their larger capability for providing an optimization process to each point to the
metropolitan and rural areas.
Part B
In the given cellular architecture, the developers used a cell splitting process
because of their ability to enhance the capacity of the system. Moreover, cells are
connected in Hexagonal shape because of large-effectiveness rather than square and
triangular architecture and also able to cover all the geographical areas effectively (Caretti,
Crozzoli, Dell'Aera, & Orlando, 2012). The adopted cell splitting technique helps for
reducing the issue of congestion (Kim, et al., 2013).
tabler-icon-diamond-filled.svg

Paraphrase This Document

Need a fresh take? Get an instant paraphrase of this document with our AI Paraphraser
Document Page
NETWORKING 7
References
Caretti, M., Crozzoli, M., Dell'Aera, G. M., & Orlando, A. (2012, April). Cell splitting based on
active antennas: Performance assessment for the LTE system. In WAMICON 2012
IEEE Wireless & Microwave Technology Conference, 12(7), 1-5.
Kim, S., Kasashima, S., Sichanugrist, P., Kobayashi, T., Nakada, T., & Konagai, M. (2013).
Development of thin-film solar cells using solar spectrum splitting technique. Solar
Energy Materials and Solar Cells, 119(12), 214-218.
Phillips, C., Sicker, D., & Grunwald, D. (2012). A survey of wireless path loss prediction and
coverage mapping methods. IEEE Communications Surveys & Tutorials, 15(1), 255-
270.
Sulyman, A. I., Nassar, A. T., Samimi, M. K., MacCartney, G. R., Rappaport, T. S., & Alsanie, A.
(2014). Radio propagation path loss models for 5G cellular networks in the 28 GHz
and 38 GHz millimetre-wave bands. IEEE Communications Magazine, 52(9), 78-86.
chevron_up_icon
1 out of 8
circle_padding
hide_on_mobile
zoom_out_icon
logo.png

Your All-in-One AI-Powered Toolkit for Academic Success.

Available 24*7 on WhatsApp / Email

[object Object]