MN603 Wireless Networks: Simulation, Analysis, and Performance Report
VerifiedAdded on  2023/01/23
|37
|5073
|94
Report
AI Summary
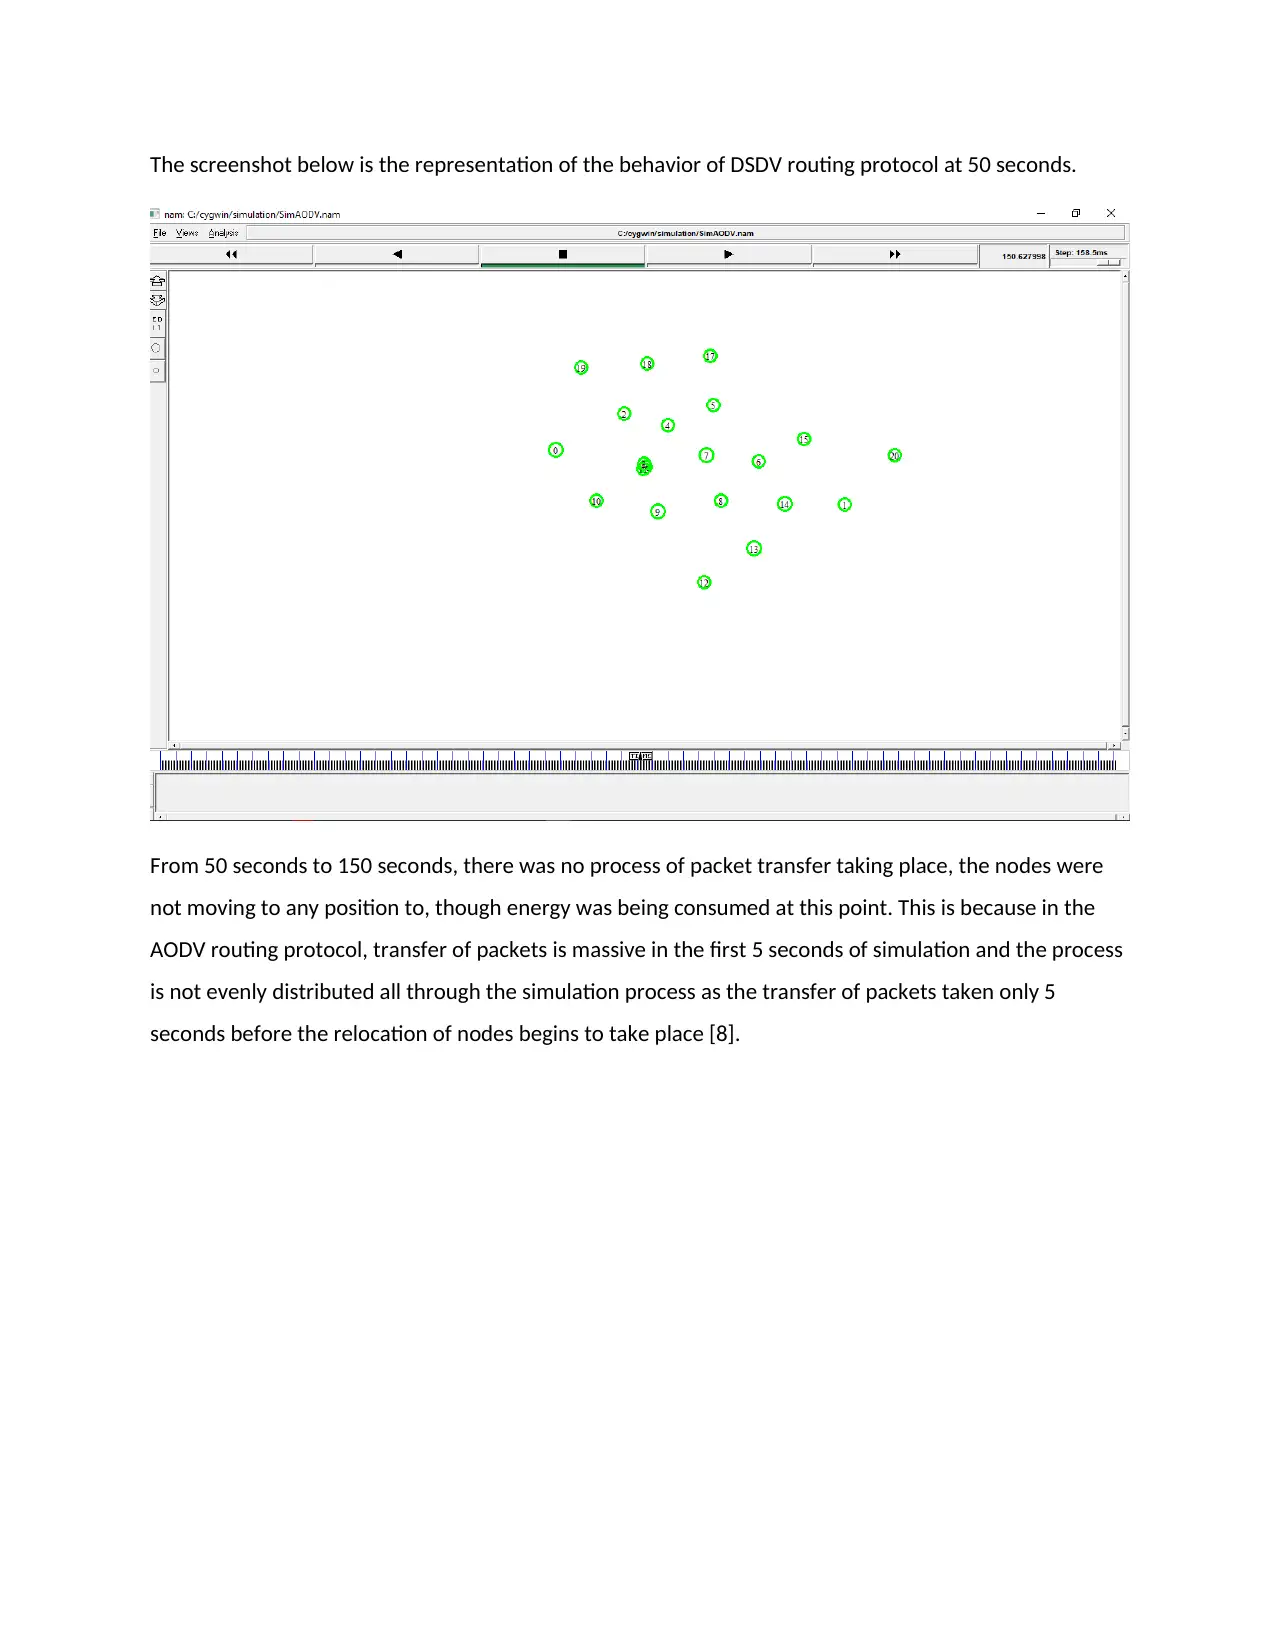
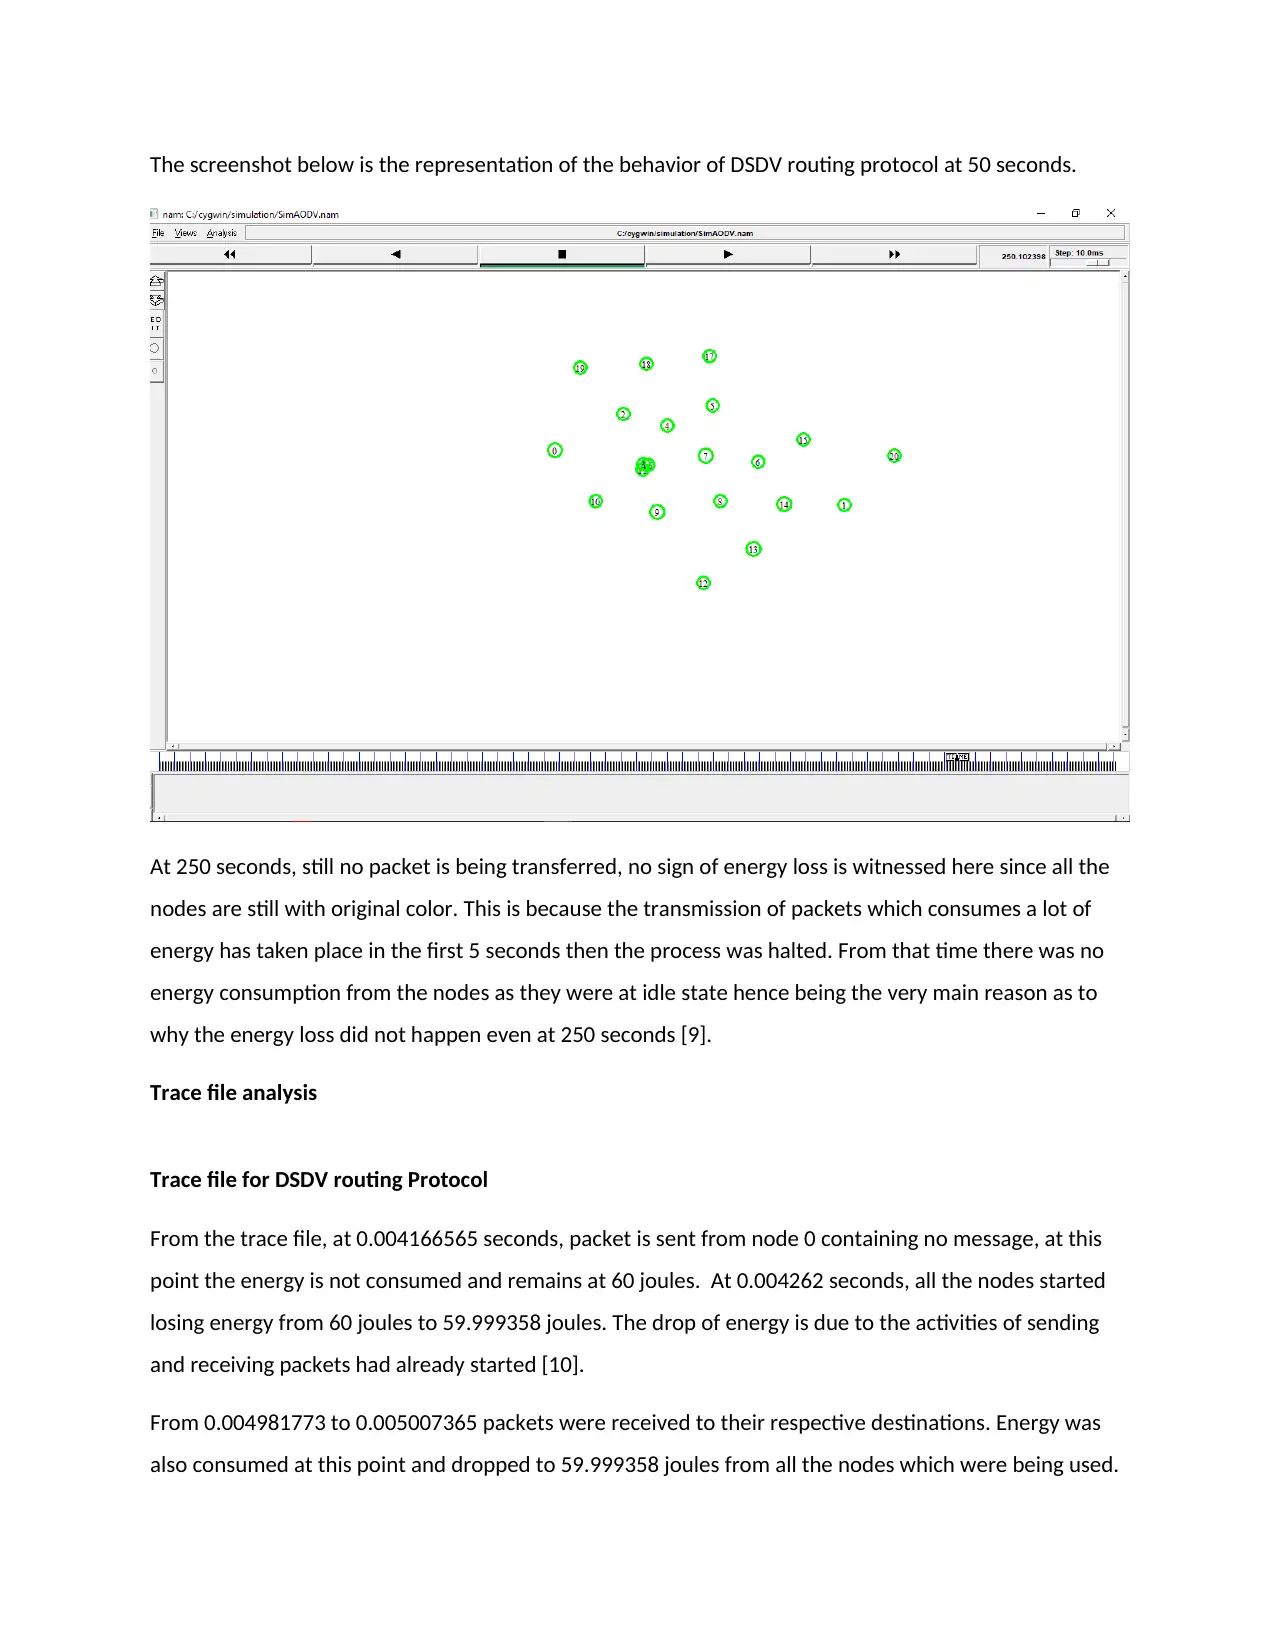
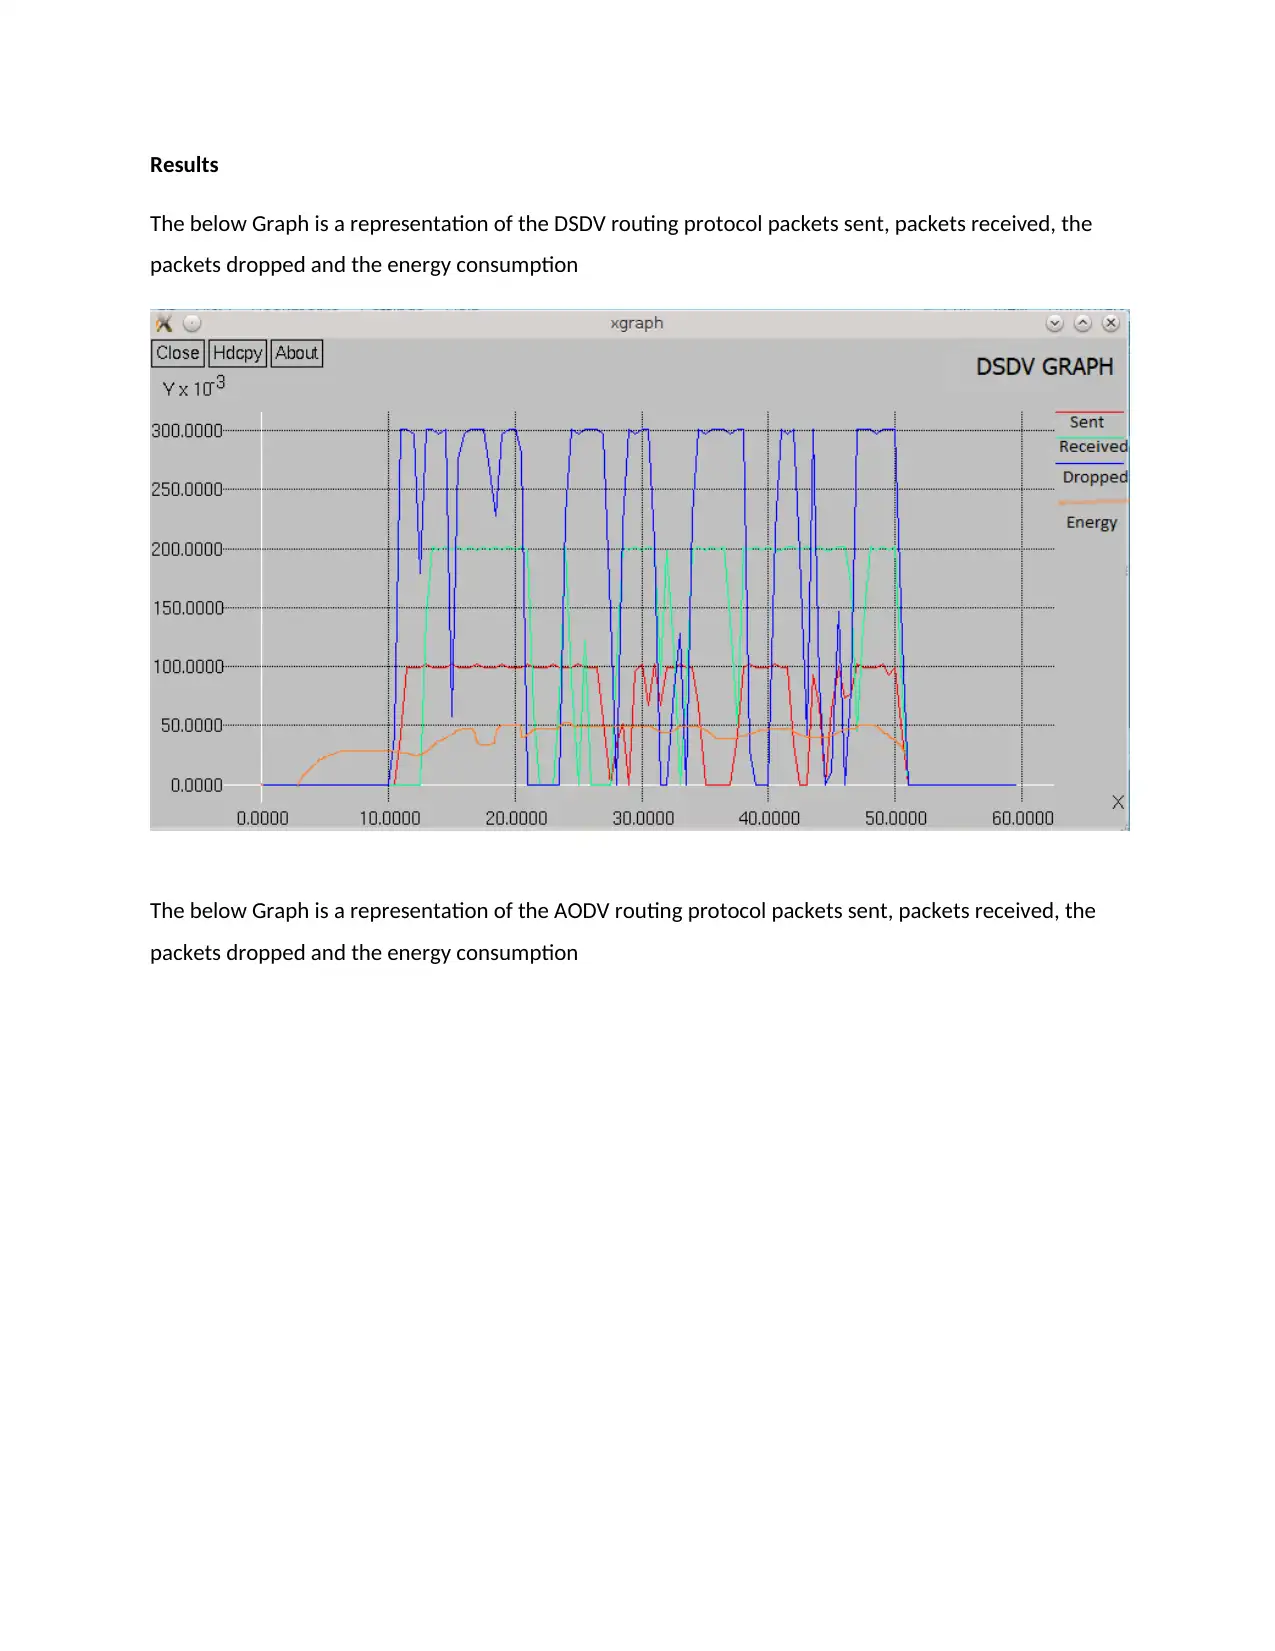
This report presents a detailed analysis of a wireless sensor network simulation, focusing on the performance evaluation of DSDV and AODV routing protocols. The simulation, conducted using NS-2 and NAM, involved 20 nodes and UDP/CBR traffic. The report examines the behavior of the network under both routing protocols, analyzing packet transfer, energy consumption, and node movements at various time intervals (50, 150, and 250 seconds). Trace file analysis provides insights into packet sending, receiving, dropping, and energy depletion. The results are presented through graphs illustrating packet statistics and energy consumption for each protocol. The report concludes by comparing the two protocols, highlighting the even packet transfer and potential energy limitations of DSDV, and the energy-efficient design of AODV, recommending its use in energy-constrained scenarios.

Wireless Sensor Network
Student Name
College
Student Name
College
Paraphrase This Document
Need a fresh take? Get an instant paraphrase of this document with our AI Paraphraser

Introduction
A wireless network is named so because of its unguided medium. This is a computer network which
makes use of wireless connection of data in between the nodes of its network. By the use of wireless
network, most of the telecommunication network companies, homes as well as business reduces the
cost of cable installations into the buildings for the connections between two network locations due to
the introduction of wireless networks. Wireless network as be designed and simulated just like the wired
network before it is deployed into real world scenario by the use of the Network Simulation -2 software
alias NetSim-2 or NS-2 which runs on both Linux and windows operating systems [1].
Network Design
The Network Animation tool alias NAM, is a tool which is used by the network Simulator software for
the core purpose of viewing the simulation of the network traces which were designed and its related
real world traces of packets. The NAM supports the layout topology, the animation of the packet level as
well as tools for data inspection and analysis [2].
The network simulation was done in NAM for both the DSDV and AODV routing protocol. Before the
network is simulated in the NAM tool, it is first designed in the NetSim software as shown in the
screenshot below.

The screenshots below shows topology designs as depicted by the NAM tool just after the design from
the NetSim software.
The below screenshot shows topology with a circle which indicates packets which are being sent to the
destined node at the start of simulation.
the NetSim software.
The below screenshot shows topology with a circle which indicates packets which are being sent to the
destined node at the start of simulation.
⊘ This is a preview!⊘
Do you want full access?
Subscribe today to unlock all pages.

Trusted by 1+ million students worldwide

The below screenshot shows how packets are being transferred to the destined nodes from several
nodes as designed. At this point when the packets are being transferred, energy is being consumed
slows from the nodes affected.
Simulation
When the simulation begins, packets are sent from one node to another, energy is consumed at this
point. The behavior of the nodes during simulation depends on the routing protocol chosen. For this
case, protocol chosen are DSDV and AODV [3].
In a nutshell, the design consists of 20 nodes with two agents of type UDP and CBR traffic attached to
the UDP. The simulation is designed to run for 300 seconds.
For the simulation of DSDV at 50 seconds, 150 seconds and 250 seconds, the screenshots explain as
below.
Paraphrase This Document
Need a fresh take? Get an instant paraphrase of this document with our AI Paraphraser

DSDV routing protocol Simulation
The screenshot below is the representation of the behavior of DSDV routing protocol at 50 seconds.
From the beginning of simulation at zero seconds to 50 seconds, there was some relation of nodes from
one point to another and transfer of packets from one node to another. Node 20 which was attached to
the udp0 moved to its destination at null4 which. This is because node udp0 which was connected to
node 20 was pointed to null 4 [4]. Energy is lost during the process. There was also some movement and
collision of nodes; node 03 and node 11 collided since they were positioned on the same x axis at 499.
From 0-50, the energy of nodes was at the pick hence the transfer of packets was very high and faster.

The screenshot below is the representation of the behavior of DSDV routing protocol at 150 seconds.
From 50 seconds all along to 150 seconds, there was decrease in the rate at which packets are being
transferred. The decrease in packet transfer is a result of increase in energy consumption from one node
to another. The consumption of energy is dependable in the initial total energy and power allocated to
each node. There was no movement of nodes at this stage since the all the nodes which were moving
from one position to another had already reached their respective destination [5].
⊘ This is a preview!⊘
Do you want full access?
Subscribe today to unlock all pages.

Trusted by 1+ million students worldwide

The screenshot below is the representation of the behavior of DSDV routing protocol at 250 seconds.
From 150 seconds to 250 seconds, the transfer of protocol reduced more further and there were also
some changes in the color of the nodes which was an indication of the decrease in the energy which is
used for protocol transfer. Almost all the nodes had given energy depletion warning that once turned
red, there would be no energy transfer at all [6].
Paraphrase This Document
Need a fresh take? Get an instant paraphrase of this document with our AI Paraphraser

AODV routing protocol simulation
The screenshot below is the representation of the behavior of DSDV routing protocol at 50 seconds.
From 0 towards 50, there was massive packet transfer in the first 5 seconds of simulation, the transfer
stopped after 5 seconds of transfer and then relocation of nodes began, node 20 moved towards null3
and node 1 moved towards node 14 since those are the positions at which the nodes were pointed
during design. Node 16 and node 11 moved towards node 3 since that is where they were pointed to.
From 5 seconds to 50, there was no single packet which was being transferred [7].

The screenshot below is the representation of the behavior of DSDV routing protocol at 50 seconds.
From 50 seconds to 150 seconds, there was no process of packet transfer taking place, the nodes were
not moving to any position to, though energy was being consumed at this point. This is because in the
AODV routing protocol, transfer of packets is massive in the first 5 seconds of simulation and the process
is not evenly distributed all through the simulation process as the transfer of packets taken only 5
seconds before the relocation of nodes begins to take place [8].
⊘ This is a preview!⊘
Do you want full access?
Subscribe today to unlock all pages.

Trusted by 1+ million students worldwide

The screenshot below is the representation of the behavior of DSDV routing protocol at 50 seconds.
At 250 seconds, still no packet is being transferred, no sign of energy loss is witnessed here since all the
nodes are still with original color. This is because the transmission of packets which consumes a lot of
energy has taken place in the first 5 seconds then the process was halted. From that time there was no
energy consumption from the nodes as they were at idle state hence being the very main reason as to
why the energy loss did not happen even at 250 seconds [9].
Trace file analysis
Trace file for DSDV routing Protocol
From the trace file, at 0.004166565 seconds, packet is sent from node 0 containing no message, at this
point the energy is not consumed and remains at 60 joules. At 0.004262 seconds, all the nodes started
losing energy from 60 joules to 59.999358 joules. The drop of energy is due to the activities of sending
and receiving packets had already started [10].
From 0.004981773 to 0.005007365 packets were received to their respective destinations. Energy was
also consumed at this point and dropped to 59.999358 joules from all the nodes which were being used.
Paraphrase This Document
Need a fresh take? Get an instant paraphrase of this document with our AI Paraphraser

The process of sending and receiving packets continued from 0.005007365 seconds with consecutive
reduction of energy due to the packets sending and receiving activities [11].
The first two data packets send were dropped at 0.087875710 seconds from node 13, at 0.088595998
Seconds, all the data packets received were dropped while forwarding.
The simulation ended at 300 seconds with the energy consumed from 60 joules to 29.900644 joules at
the end. Only 4 nodes were still having more energy with other nodes dropped its energy below 30
joules. There was no node which had finished its energy. A total of 846 packets of data had been sent
and received in 300 seconds of simulation [12].
Trace file for AODV routing Protocol
For this routing protocol, packet sending began at 1.000000000 seconds which each node having initial
energy which was 60 joules. In the first 5 seconds of simulation, it is seen that there was massive packet
sending and receiving which attracted further massive data dropping within this time period.
Energy dropped from 60 joules to 58.809064 within 5 seconds. After words all packets had already been
send hence there was no data packet sending at this from this point [12].
M 6.00000 11 (449.00, 260.00, 0.00), (499.00, 400.00), 40.00
M 6.00000 16 (693.00, 526.00, 0.00), (499.00, 400.00), 40.00
From the 6th second to 10th, node 11 and node 16 relocated and collided with node 3 at 499 position as
seen in the above trace lines.
There was packet dropping at 1.009455238 seconds , which was packet forwarded by node 19 to node
12. This was due to the collision by node 0 forwarding AODV MAC level 106. All packet dropping have
been happening at node 0.
Simulation ended at 300 seconds when all nodes had their energy still 58.809064 there very little energy
was consumed in the process.

Results
The below Graph is a representation of the DSDV routing protocol packets sent, packets received, the
packets dropped and the energy consumption
The below Graph is a representation of the AODV routing protocol packets sent, packets received, the
packets dropped and the energy consumption
The below Graph is a representation of the DSDV routing protocol packets sent, packets received, the
packets dropped and the energy consumption
The below Graph is a representation of the AODV routing protocol packets sent, packets received, the
packets dropped and the energy consumption
⊘ This is a preview!⊘
Do you want full access?
Subscribe today to unlock all pages.

Trusted by 1+ million students worldwide
1 out of 37
Related Documents
Your All-in-One AI-Powered Toolkit for Academic Success.
 +13062052269
info@desklib.com
Available 24*7 on WhatsApp / Email
Unlock your academic potential
Copyright © 2020–2025 A2Z Services. All Rights Reserved. Developed and managed by ZUCOL.


