Wireshark Analysis of Networked Applications: MN504 Assignment

Verified

Added on  2023/04/24

|21
|2279
|461
Report
AI Summary
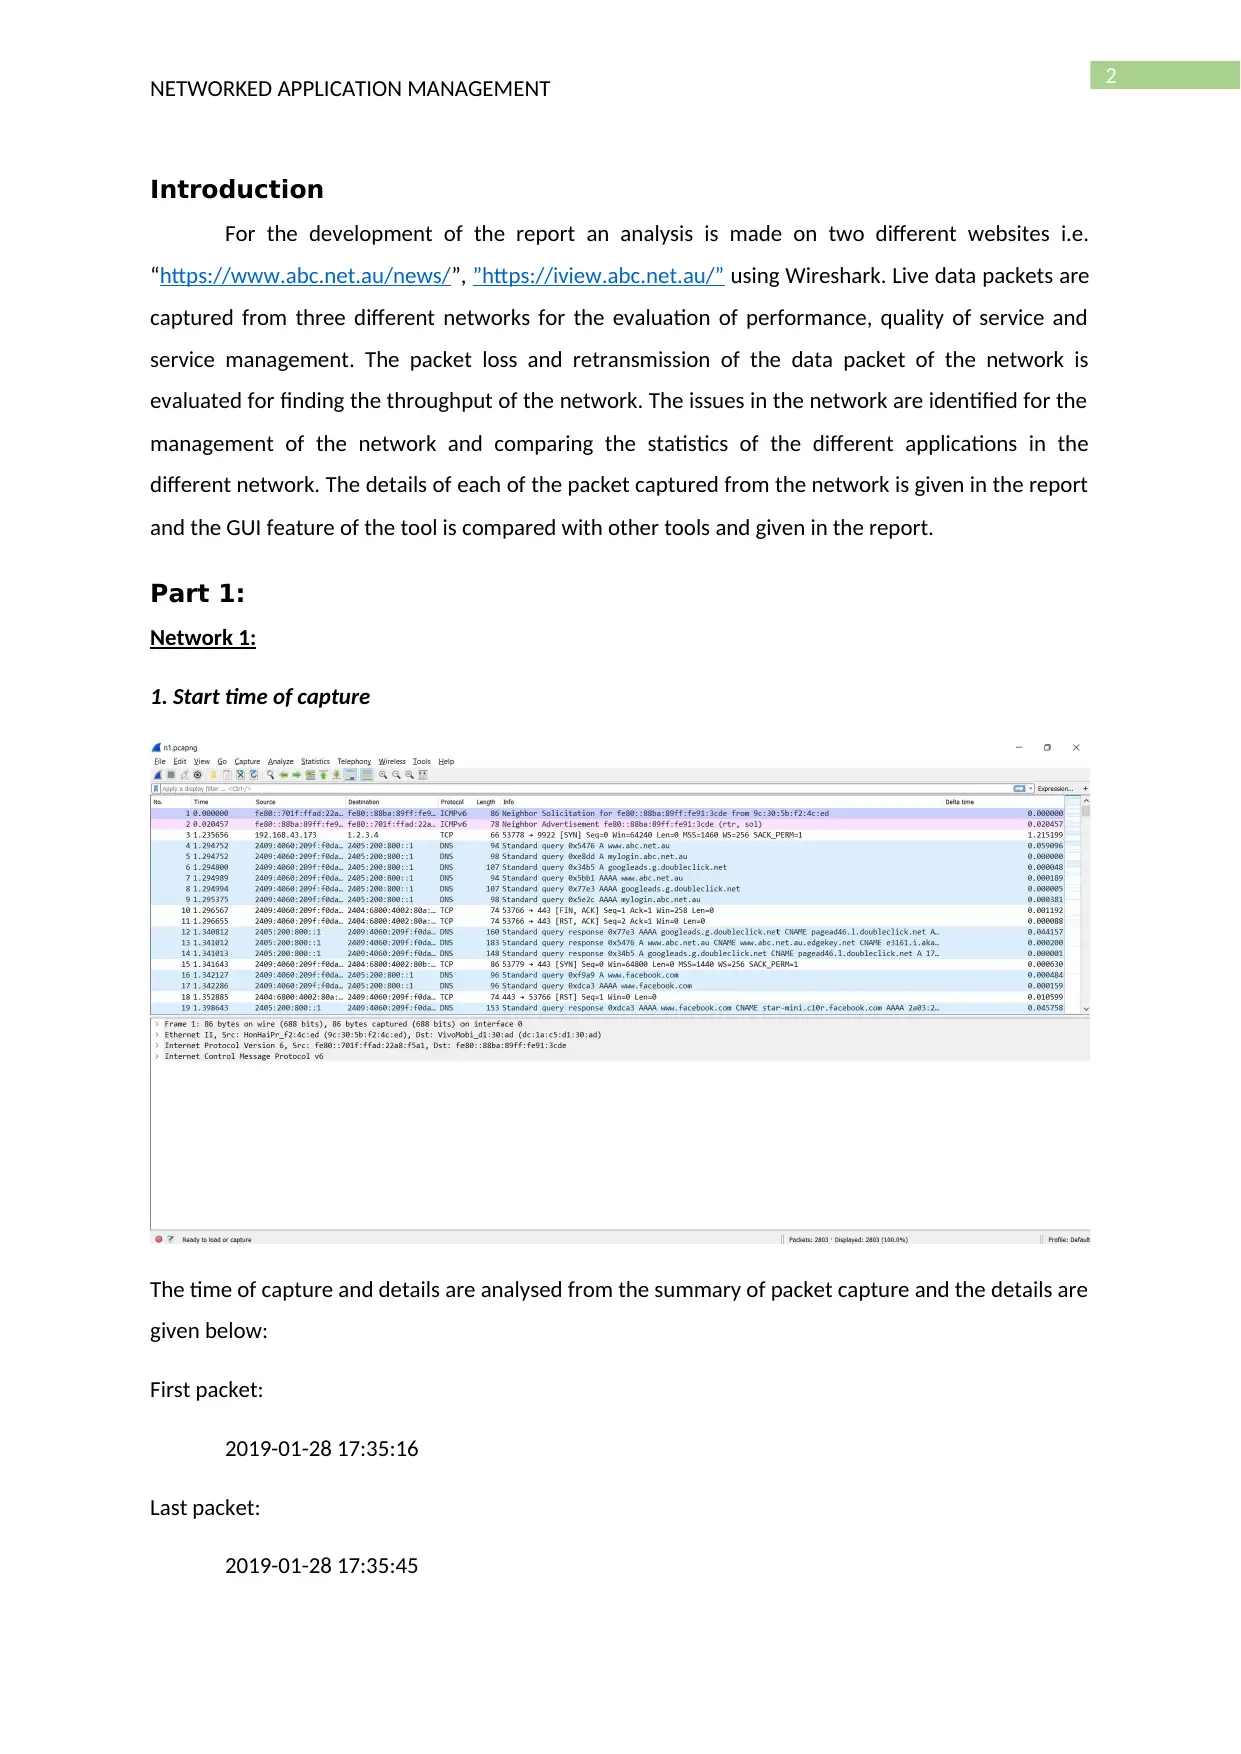
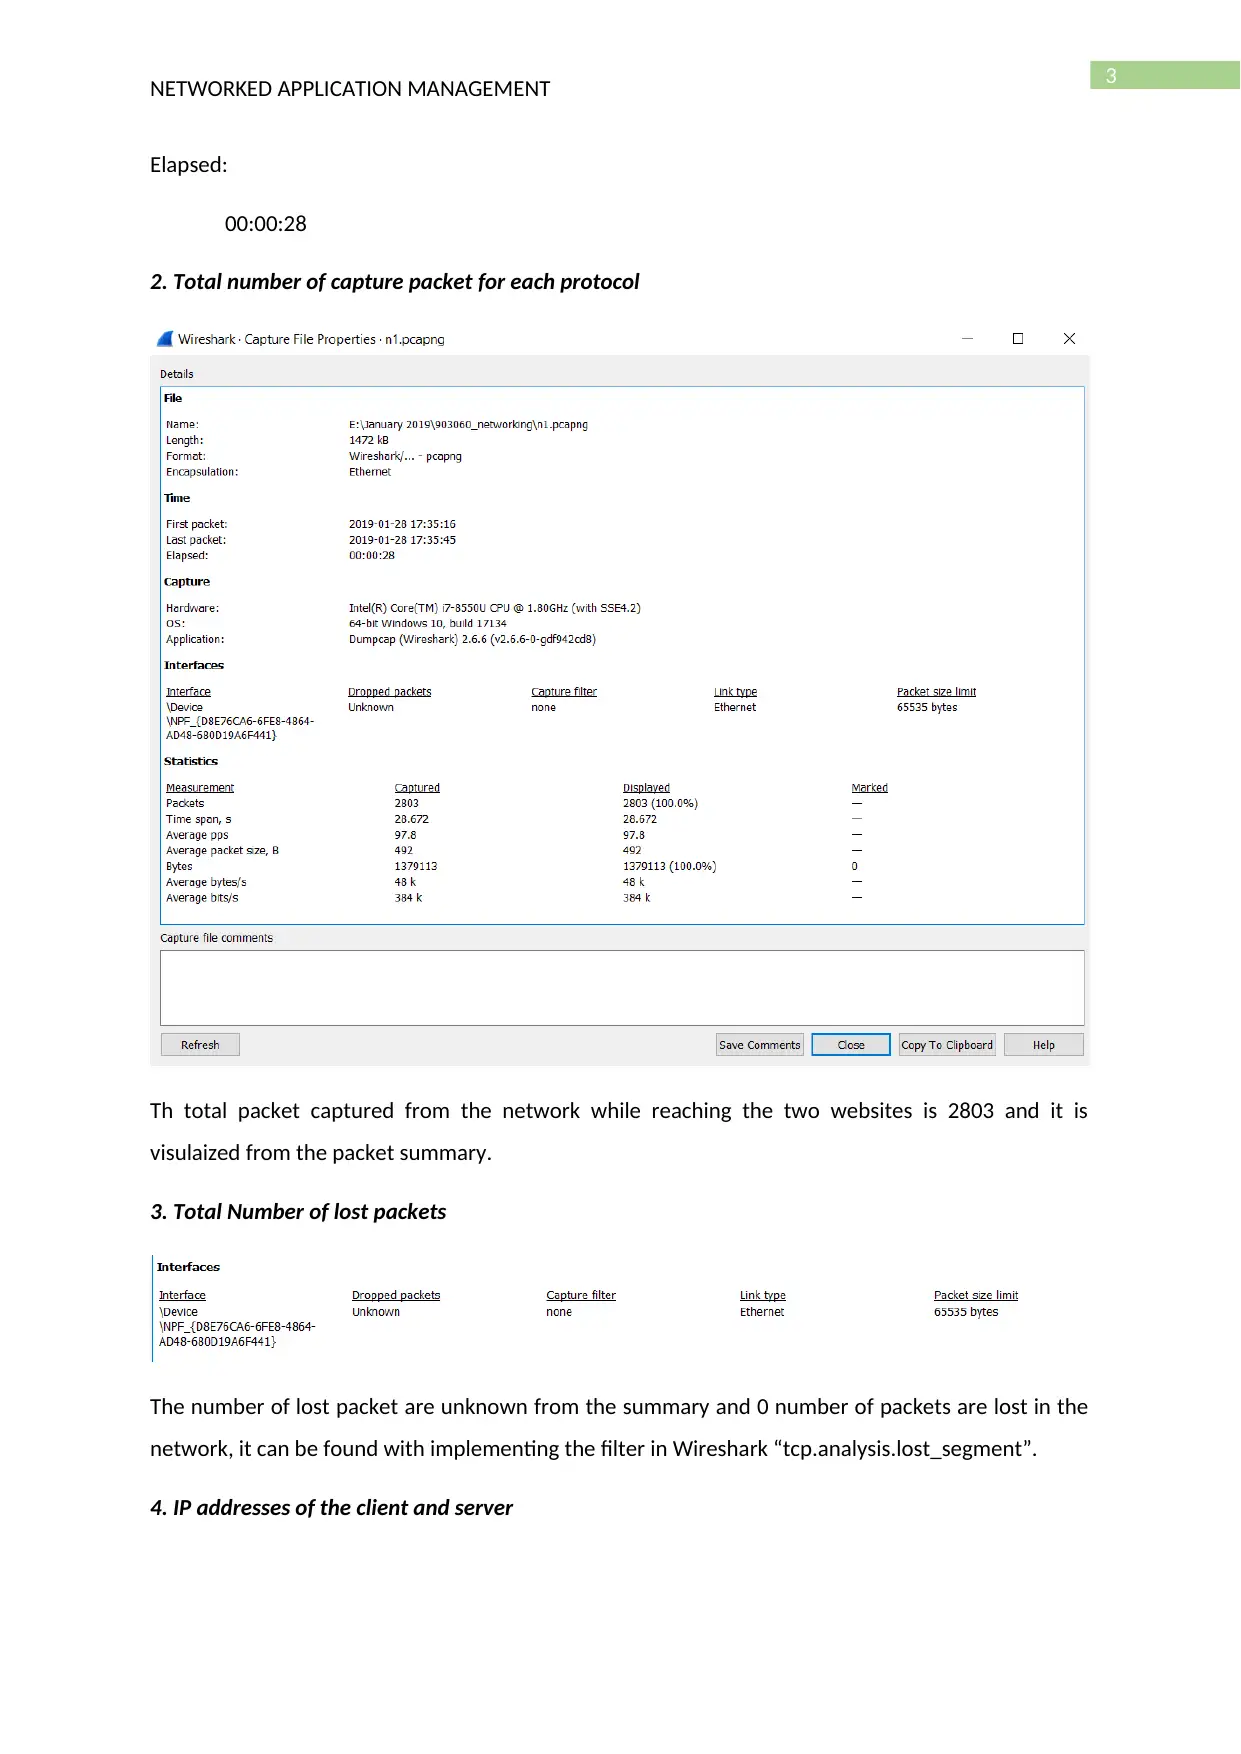
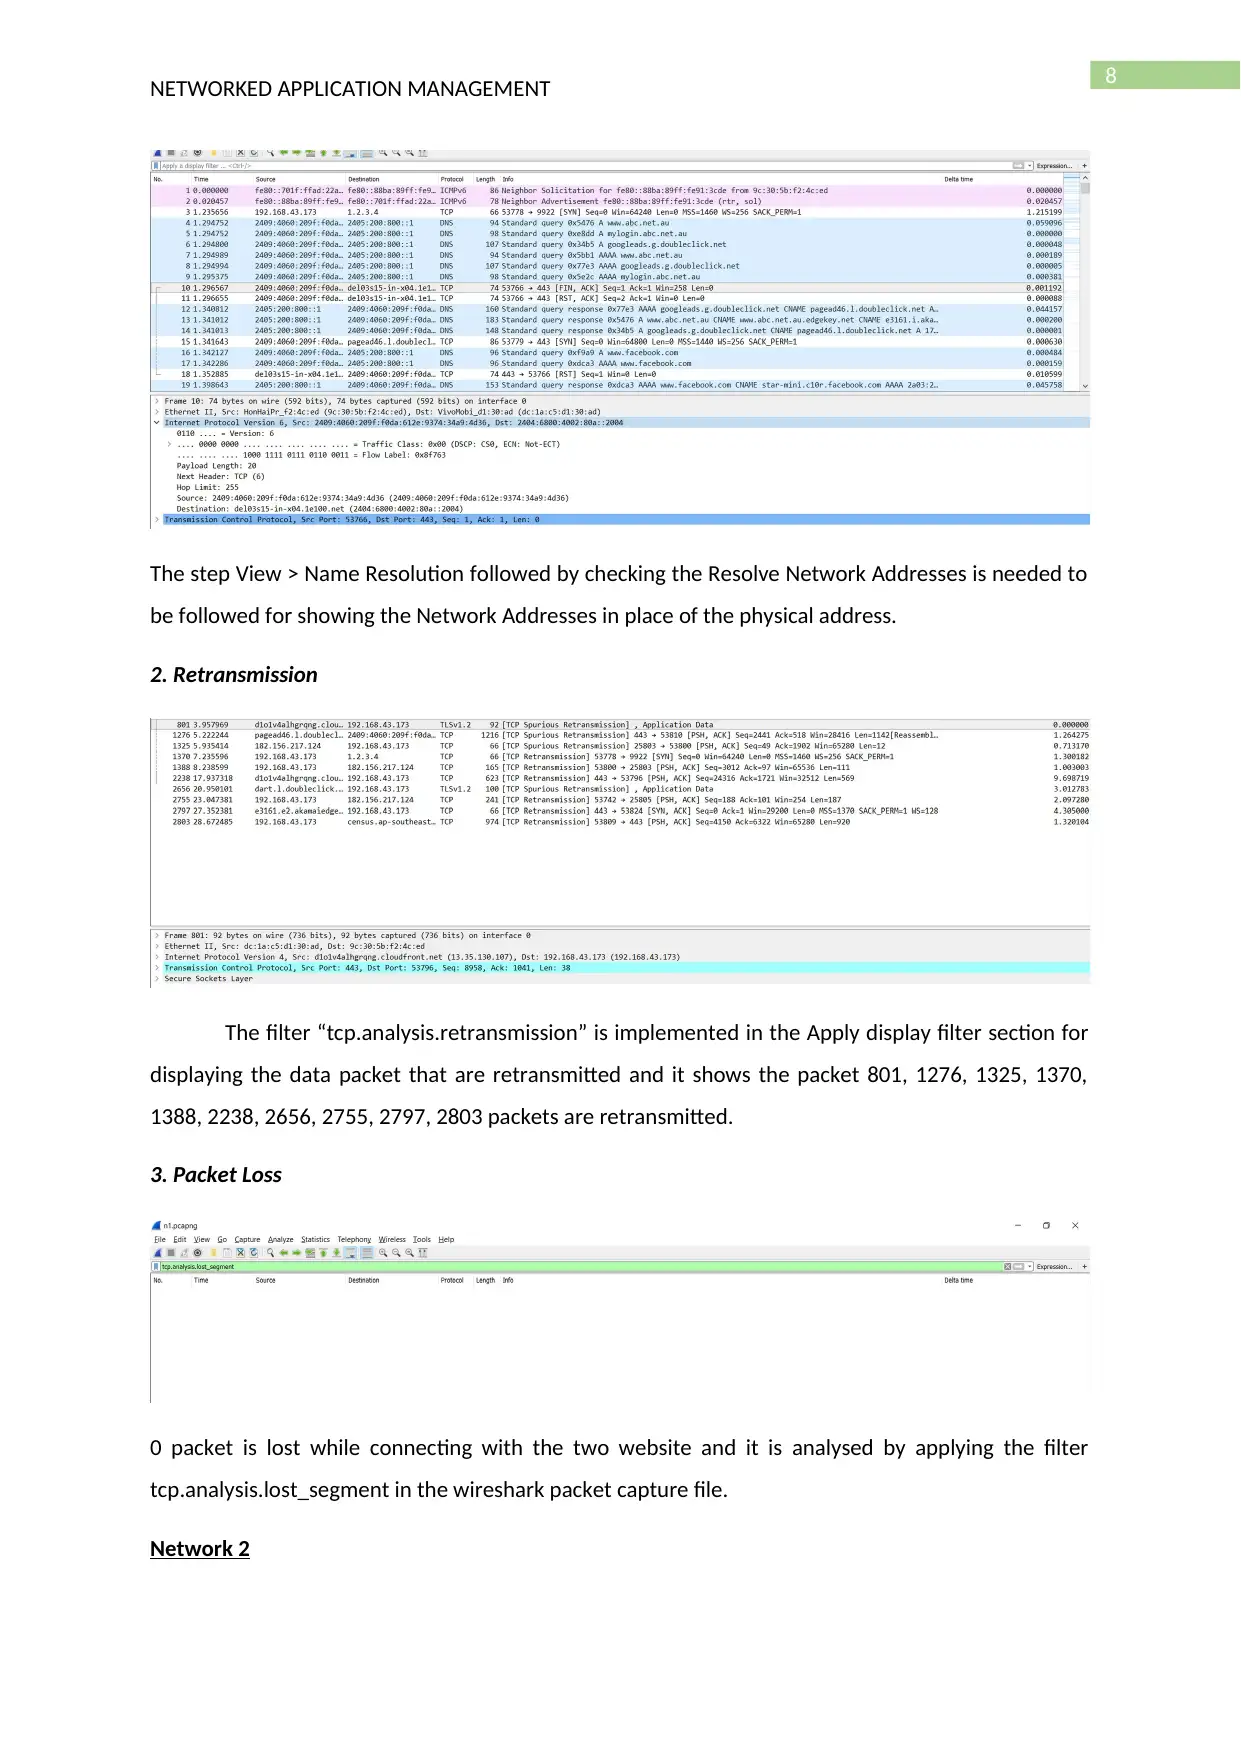
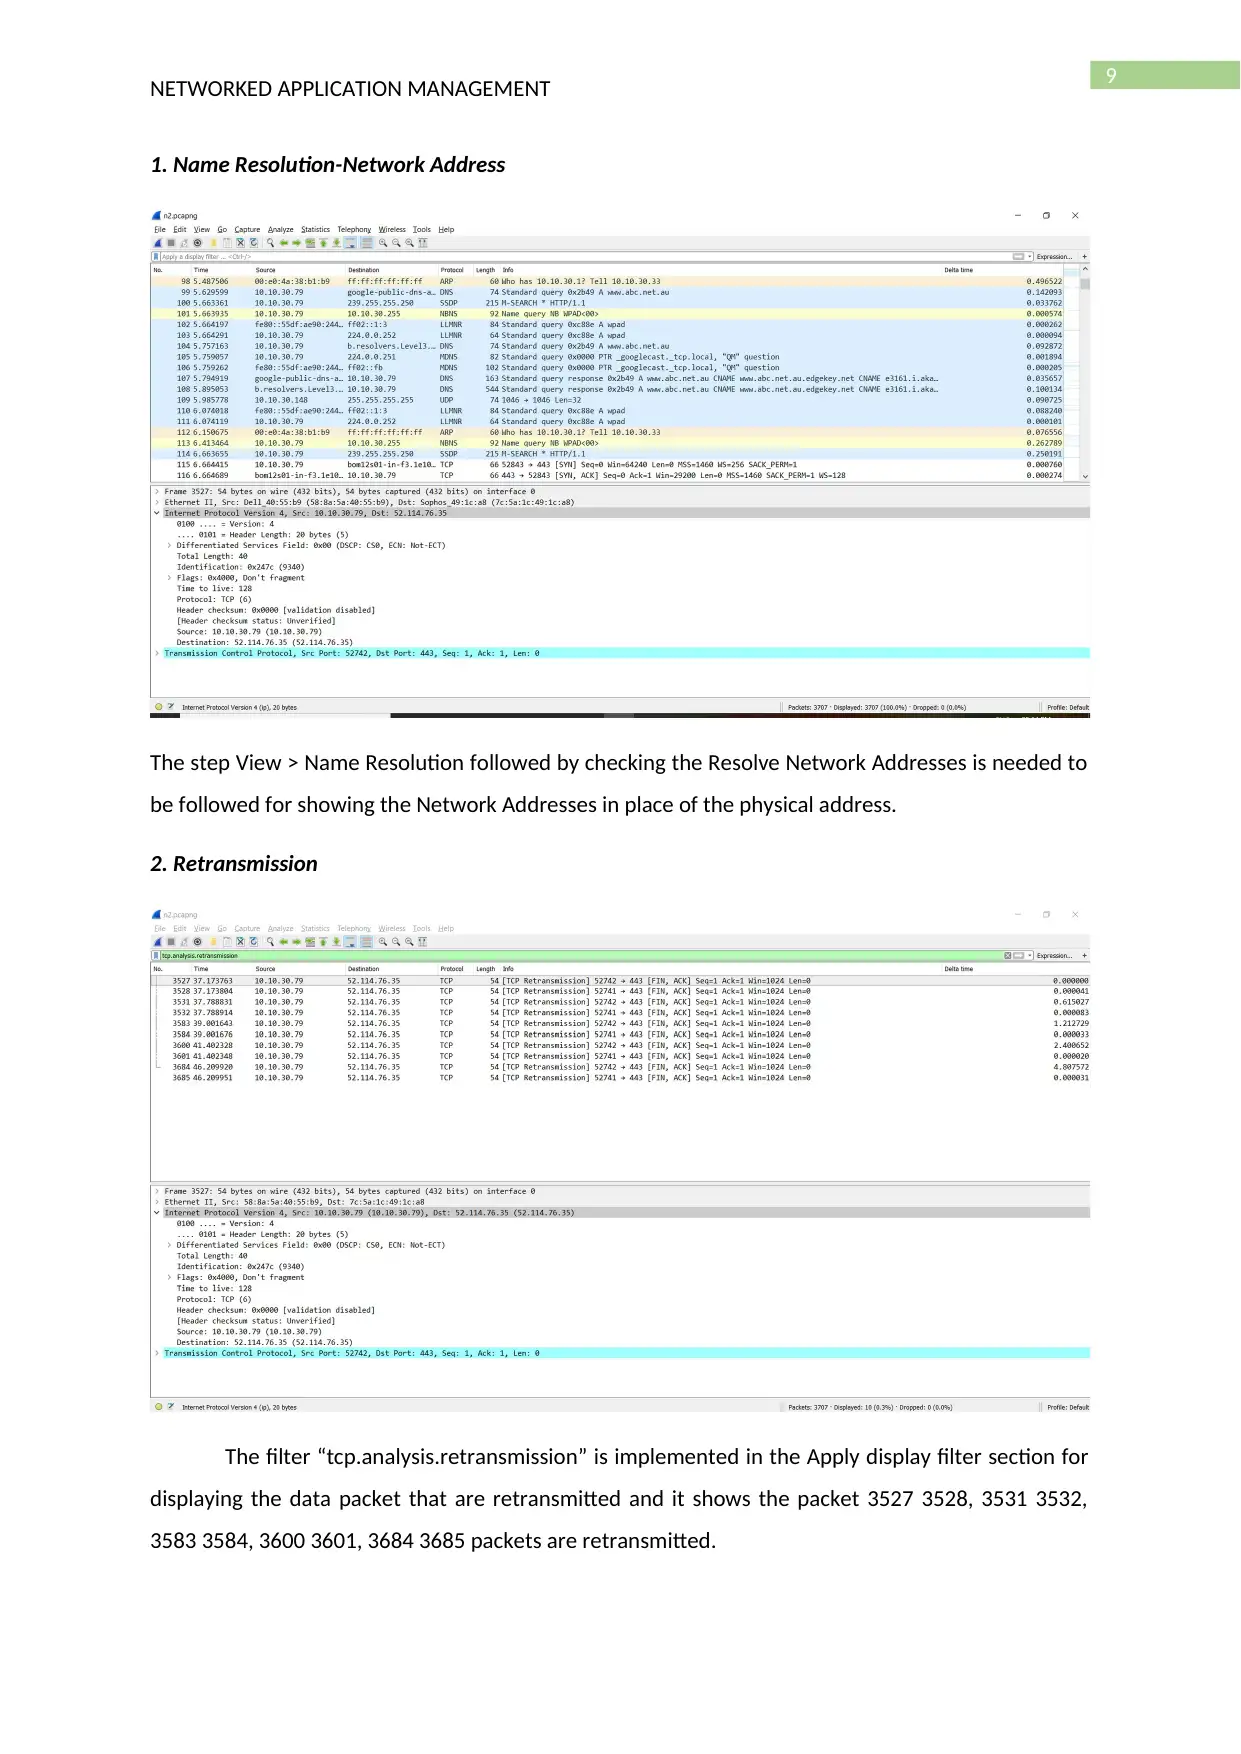
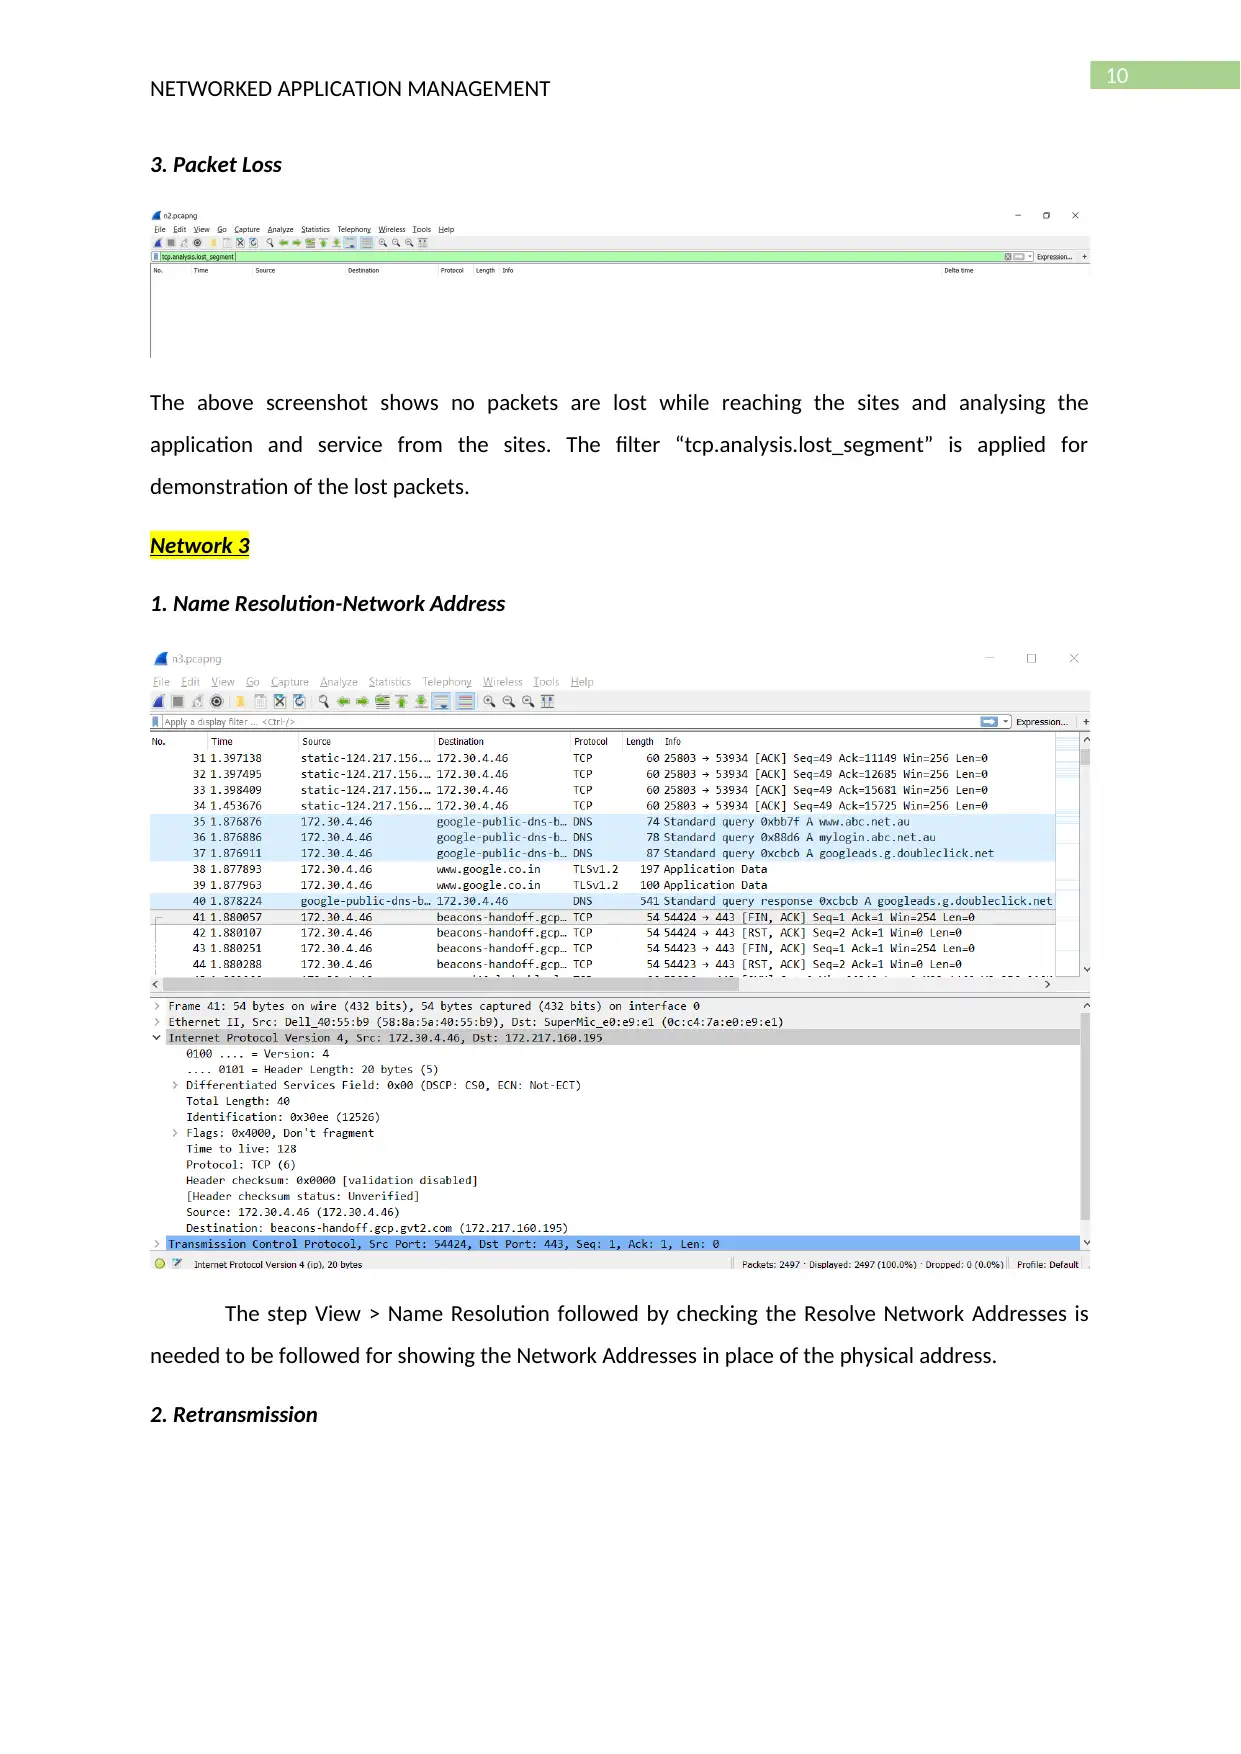
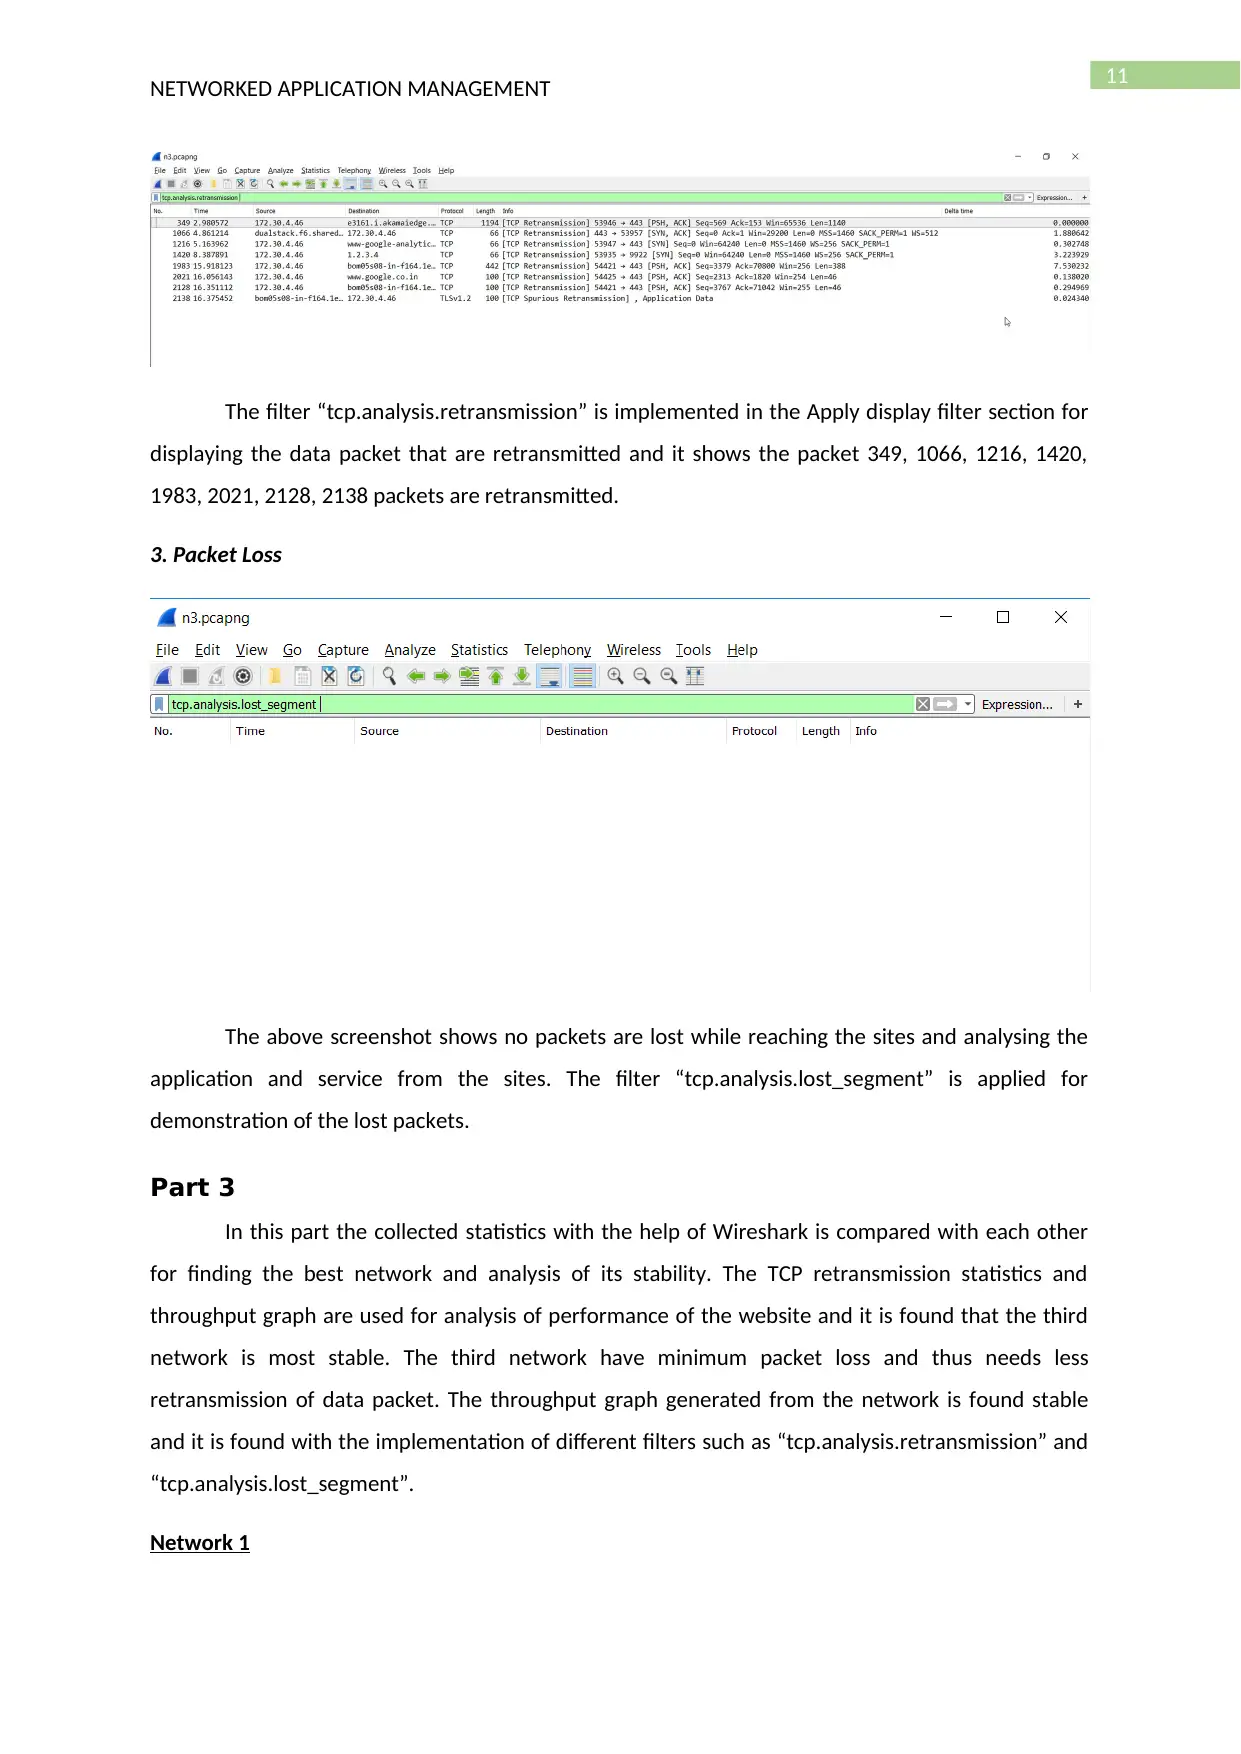
This report presents a network analysis conducted using Wireshark on two websites, abc.net.au/news/ and iview.abc.net.au/, across three different networks. Live data packets were captured to evaluate performance, quality of service, and service management, with a focus on packet loss and retransmission to determine network throughput. The analysis identifies network issues for management purposes and compares application statistics across different networks. Details of each captured packet are provided, along with a comparison of Wireshark's GUI features against Microsoft Message Analyzer. The report includes observations on start times, packet counts, lost packets, and IP addresses for each network, and uses filters to analyze retransmissions and packet loss. Throughput graphs and retransmission statistics are compared to assess network stability, concluding that the third network is the most stable. The report also compares Wireshark with Microsoft Message Analyzer, evaluating ease of use, GUI, traffic visualization, and statistics generation to inform network management and optimization.
Document Page
Running head: NETWORKED APPLICATION MANAGEMENT
Network Analysis using Wireshark
Name of the Student
Name of the University
Author’s Note
tabler-icon-diamond-filled.svg

Secure Best Marks with AI Grader

Need help grading? Try our AI Grader for instant feedback on your assignments.
Document Page
1
NETWORKED APPLICATION MANAGEMENT
Table of Contents
Introduction...........................................................................................................................................2
Part 1:....................................................................................................................................................2
Part 2:....................................................................................................................................................7
Part 3...................................................................................................................................................11
Part 4...................................................................................................................................................16
Conclusion...........................................................................................................................................19
Bibliography.........................................................................................................................................20
Document Page
2
NETWORKED APPLICATION MANAGEMENT
Introduction
For the development of the report an analysis is made on two different websites i.e.
https://www.abc.net.au/news/”, ”https://iview.abc.net.au/” using Wireshark. Live data packets are
captured from three different networks for the evaluation of performance, quality of service and
service management. The packet loss and retransmission of the data packet of the network is
evaluated for finding the throughput of the network. The issues in the network are identified for the
management of the network and comparing the statistics of the different applications in the
different network. The details of each of the packet captured from the network is given in the report
and the GUI feature of the tool is compared with other tools and given in the report.
Part 1:
Network 1:
1. Start time of capture
The time of capture and details are analysed from the summary of packet capture and the details are
given below:
First packet:
2019-01-28 17:35:16
Last packet:
2019-01-28 17:35:45
Document Page
3
NETWORKED APPLICATION MANAGEMENT
Elapsed:
00:00:28
2. Total number of capture packet for each protocol
Th total packet captured from the network while reaching the two websites is 2803 and it is
visulaized from the packet summary.
3. Total Number of lost packets
The number of lost packet are unknown from the summary and 0 number of packets are lost in the
network, it can be found with implementing the filter in Wireshark “tcp.analysis.lost_segment”.
4. IP addresses of the client and server
tabler-icon-diamond-filled.svg

Secure Best Marks with AI Grader

Need help grading? Try our AI Grader for instant feedback on your assignments.
Document Page
4
NETWORKED APPLICATION MANAGEMENT
The Ip address of client and server is given below:
Internet Protocol Version 6,
Src: 2409:4060:209f:f0da:612e:9374:34a9:4d36,
Dst: 2404:6800:4002:80a::2004
Network 2:
1. Start time of capture
The following is the details of packet capture from the network and the details can be found
from the summary section of the packet captured.
First packet:
2019-01-28 16:29:31
Last packet:
Document Page
5
NETWORKED APPLICATION MANAGEMENT
2019-01-28 16:30:19
Elapsed:
00:00:47
2. Total number of capture packet for each protocol
For each of the protocol 3707 number of packets are captured from the network using the
Wireshark Packet capture.
3. Total Number of lost packets
The total number of data packet that is lost in the network is unknown from the summary of the
packet captured and it can be found with the application of filter and it is found that 0 packet is lost.
4. IP addresses of the client and server
The IP address of client and server are given below:
Internet Protocol Version 4, Src: 10.10.30.79, Dst: 8.8.8.8
Document Page
6
NETWORKED APPLICATION MANAGEMENT
Network 3:
1. Start time of capture
The following is the details of packet capture from the network and the details can be found
from the summary section of the packet captured.
First packet:
2019-01-28 18:11:25
Last packet:
2019-01-28 18:11:49
Elapsed:
00:00:23
2. Total number of capture packet for each protocol
tabler-icon-diamond-filled.svg

Paraphrase This Document

Need a fresh take? Get an instant paraphrase of this document with our AI Paraphraser
Document Page
7
NETWORKED APPLICATION MANAGEMENT
For each of the protocol 2497 number of packets are captured from the network using the
Wireshark Packet capture.
3. Total Number of lost packets
The total number of data packet that is lost in the network is unknown from the summary of the
packet captured and it can be found with the application of filter and it is found that 0 packet is lost.
4. IP addresses of the client and server
The IP address of client and server are given below:
Client: 172.30.4.46,
Server: 172.217.160.195
Part 2:
Network 1
1. Name Resolution-Network Address
Document Page
8
NETWORKED APPLICATION MANAGEMENT
The step View > Name Resolution followed by checking the Resolve Network Addresses is needed to
be followed for showing the Network Addresses in place of the physical address.
2. Retransmission
The filter “tcp.analysis.retransmission” is implemented in the Apply display filter section for
displaying the data packet that are retransmitted and it shows the packet 801, 1276, 1325, 1370,
1388, 2238, 2656, 2755, 2797, 2803 packets are retransmitted.
3. Packet Loss
0 packet is lost while connecting with the two website and it is analysed by applying the filter
tcp.analysis.lost_segment in the wireshark packet capture file.
Network 2
Document Page
9
NETWORKED APPLICATION MANAGEMENT
1. Name Resolution-Network Address
The step View > Name Resolution followed by checking the Resolve Network Addresses is needed to
be followed for showing the Network Addresses in place of the physical address.
2. Retransmission
The filter “tcp.analysis.retransmission” is implemented in the Apply display filter section for
displaying the data packet that are retransmitted and it shows the packet 3527 3528, 3531 3532,
3583 3584, 3600 3601, 3684 3685 packets are retransmitted.
tabler-icon-diamond-filled.svg

Secure Best Marks with AI Grader

Need help grading? Try our AI Grader for instant feedback on your assignments.
Document Page
10
NETWORKED APPLICATION MANAGEMENT
3. Packet Loss
The above screenshot shows no packets are lost while reaching the sites and analysing the
application and service from the sites. The filter “tcp.analysis.lost_segment” is applied for
demonstration of the lost packets.
Network 3
1. Name Resolution-Network Address
The step View > Name Resolution followed by checking the Resolve Network Addresses is
needed to be followed for showing the Network Addresses in place of the physical address.
2. Retransmission
Document Page
11
NETWORKED APPLICATION MANAGEMENT
The filter “tcp.analysis.retransmission” is implemented in the Apply display filter section for
displaying the data packet that are retransmitted and it shows the packet 349, 1066, 1216, 1420,
1983, 2021, 2128, 2138 packets are retransmitted.
3. Packet Loss
The above screenshot shows no packets are lost while reaching the sites and analysing the
application and service from the sites. The filter “tcp.analysis.lost_segment” is applied for
demonstration of the lost packets.
Part 3
In this part the collected statistics with the help of Wireshark is compared with each other
for finding the best network and analysis of its stability. The TCP retransmission statistics and
throughput graph are used for analysis of performance of the website and it is found that the third
network is most stable. The third network have minimum packet loss and thus needs less
retransmission of data packet. The throughput graph generated from the network is found stable
and it is found with the implementation of different filters such as “tcp.analysis.retransmission” and
“tcp.analysis.lost_segment”.
Network 1
Document Page
12
NETWORKED APPLICATION MANAGEMENT
Throughput Graph
The throughput graph is that is generated from the captured pcap file is given below:
Since there is no packet lost and thus it is identified that segment length is 0 bytes and thus the
average throughput is 0 bytes per second for a time frame of 2.5 to 10 second.
Network Retransmission Statistics
tabler-icon-diamond-filled.svg

Paraphrase This Document

Need a fresh take? Get an instant paraphrase of this document with our AI Paraphraser
Document Page
13
NETWORKED APPLICATION MANAGEMENT
The sequence graph is stable and since no data packet is lost in the network.
Network 2
Throughput Graph
The throughput graph is that is generated from the captured pcap file is given below:
Document Page
14
NETWORKED APPLICATION MANAGEMENT
Since there is no packet lost and thus it is identified that segment length is 0 bytes and thus the
average throughput is 0 bytes per second.
Network Retransmission Statistics
Document Page
15
NETWORKED APPLICATION MANAGEMENT
The sequence graph is stable and since no data packet is lost in the network.
Network 3
Throughput Graph
The following throughput graph is generated from the pcap file for the lost packet in the network
Since there is no packet lost and thus it is identified that segment length is 0 bytes and thus the
average throughput is 0 bytes per second.
Network Retransmission Statistics
tabler-icon-diamond-filled.svg

Secure Best Marks with AI Grader

Need help grading? Try our AI Grader for instant feedback on your assignments.
Document Page
16
NETWORKED APPLICATION MANAGEMENT
The sequence graph is stable and since no data packet is lost in the network.
Part 4
Microsoft Message Analyzer is compared with open source network monitoring tool i.e. Wireshark
and the GUI, visualisation and statistical report is analysed for comparing the performance and
stability of the network.
Document Page
17
NETWORKED APPLICATION MANAGEMENT
Ease of Access and use –
The GUI of Wireshark is simple and the interface is divided into three section from where the
details of the packets can be found by clicking on the packet. Less resource is required for the
installation of Wireshark when compared with the resource needed for the installation of Microsoft
message Analyzer. Wireshark is compatible with different other network application and it can be
used by the network administrator for having a centralized control on the network.
GUI –
Microsoft Message Analyzer have more enhanced graphical user interface and its usability is
much more than Wireshark but it needs detail knowledge about the network for getting the
maximum benefit from it. The user interface of Wireshark is user friendly have most of the useful
option that are needed for the management of transmission of data packet in the network. All the
options that are Available in Microsoft Message Analyzer is not available in Wireshark but the
features and functionality of Wireshark is available in Message Analyzer.
Visualization of the traffic –
The details of each of the data packet sent by the source and the destination host connected
in the network can be captured and expanded for getting more details such as length, IP header,
Document Page
18
NETWORKED APPLICATION MANAGEMENT
source address for analysing the traffic pattern and secure the network from the internal and
external threats acting on the network.
Statistics generation –
Different types of graphs can be generated with the application filters for identification of
the vulnerability in Wireshark and Message Analyzer. The access of the resources for the user can be
managed with the use of the tool and configuring the network following the needs of the business
organization. The statistical graph generated after capturing the data packet in the network helps in
visualising the usability and performance of the network framework.
tabler-icon-diamond-filled.svg

Paraphrase This Document

Need a fresh take? Get an instant paraphrase of this document with our AI Paraphraser
Document Page
19
NETWORKED APPLICATION MANAGEMENT
Conclusion
The report is prepared for the analysis of performance of the network with respect of
running different application and service. The open source network monitoring and management
tool is evaluated and easy to access of the tool is evaluated for identification of the changes that can
be implemented in the network for increasing the efficiency of the network framework. The
throughput and the round trip time is generated with the means of statistical graph and the result
for each of the network is compared with each other for identifying the network performance. The
details of each of the packet is analysed by identifying the start time of capture, total number of
packets captured, total number of lost packets and IP addresses of the client and the server
connected in the network. The screenshot of the packet is attached with the report with the details
such ad name resolution network address, retransmission and packet loss. The statistical flow is
identified with the generation of different statistical graph for management of the efficiency and
flow of the network.
Document Page
20
NETWORKED APPLICATION MANAGEMENT
Bibliography
[1]. Bachupally, Yogeshwar Rao, Xiaohong Yuan, and Kaushik Roy. "Network security analysis
using Big Data technology." SoutheastCon, 2016. IEEE, 2016.
[2]. Bhandari, Aishwarya, et al. "Packet Sniffing and Network Traffic Analysis Using TCP—A New
Approach." Advances in Electronics, Communication and Computing. Springer, Singapore,
2018. 273-280.
[3]. Chappell, Laura. Wireshark 101: Essential Skills for Network Analysis-Wireshark Solution
Series. Laura Chappell University, 2017.
[4]. Deokule, Kaustubh, et al. "Network Traffic Measurement and Analysis.", 2016.
[5]. Kumar, Nagendra, Yogesh Ramdoss, and Yoram Orzach. Network Analysis Using Wireshark 2
Cookbook: Practical recipes to analyze and secure your network using Wireshark 2. Packt
Publishing Ltd, 2018.
[6]. Mistry, Devang, et al. "Network traffic measurement and analysis." Systems, Applications
and Technology Conference (LISAT), 2016 IEEE Long Island. IEEE, 2016.
[7]. Nath, Anish. Packet Analysis with Wireshark. Packt Publishing Ltd, 2015.
[8]. Ndatinya, Vivens, et al. "Network forensics analysis using Wireshark." International Journal
of Security and Networks10.2, 2015: 91-106.
[9]. Piruthiviraj, P., Preeta Sharan, and R. Nagaraj. "Real-Time QoS Performance Analysis for
Multimedia Traffic in an Optical Network." Silicon Photonics & High Performance Computing.
Springer, Singapore, 2018. 87-93.
[10]. Sanders, Chris. Practical packet analysis: Using Wireshark to solve real-world
network problems. No Starch Press, 2017.
chevron_up_icon
1 out of 21
circle_padding
hide_on_mobile
zoom_out_icon
logo.png

Your All-in-One AI-Powered Toolkit for Academic Success.

Available 24*7 on WhatsApp / Email

[object Object]