Financial Analysis Report: Evaluating Investment Projects - Finance
VerifiedAdded on 2019/12/03
|22
|5045
|304
Report
AI Summary
This report provides a comprehensive financial analysis of Wm Morrison Supermarkets plc, a major UK food retailer, focusing on financial management techniques. The report is divided into two parts: the first part presents a detailed ratio analysis, including profitability, liquidity, performance, and efficiency ratios, calculated from the company's financial statements from 2011 to 2013. The analysis evaluates the company's financial health and provides recommendations for improvement. The second part assesses the viability of two competing investment projects using Net Present Value (NPV), Internal Rate of Return (IRR), and payback period methods, offering a comparative evaluation of their potential returns and risks. The report concludes with a summary of findings and recommendations, supported by tables and calculations, aiming to provide an in-depth understanding of financial tools and techniques for effective decision-making.

FINANCIAL
MANAGEMENT
April, 2013
MANAGEMENT
April, 2013
Paraphrase This Document
Need a fresh take? Get an instant paraphrase of this document with our AI Paraphraser
Contents
INTRODUCTION...........................................................................................................................1
PART 1............................................................................................................................................1
Company Overview.....................................................................................................................1
1.1 Ratio Calculation...................................................................................................................1
Profitability Ratios...................................................................................................................1
Liquidity Ratio.........................................................................................................................2
Performance Ratio...................................................................................................................3
Efficiency Ratios.....................................................................................................................3
1.2 Evaluation and Recommendations........................................................................................4
1.3 Summarised Report...............................................................................................................7
PART 2............................................................................................................................................8
2.1 Assessing the viability of the competing investment projects...............................................9
2.2: Payback Period Method......................................................................................................12
2.3 Advantages and Disadvantages...........................................................................................13
2.4 Summarised Report.............................................................................................................15
CONCLUSION..............................................................................................................................16
References......................................................................................................................................17
APPENDIX....................................................................................................................................18
List of Tables
Table 1 Ratio Calculation................................................................................................................4
Table 2 Summarised Report of Ratio Analysis...............................................................................7
Table 3 Calculation of NPV for Project 1.......................................................................................9
Table 4 Calculation of NPV for Project 2.......................................................................................9
Table 5 Calculation of IRR for Project 1.......................................................................................10
Table 6 Calculation of IRR for Project 2.......................................................................................11
Table 7 Calculation of Payback Period for Project 1....................................................................12
Table 8 Calculation of Payback Period for Project 2....................................................................13
Table 9 Summarised Report..........................................................................................................15
⊘ This is a preview!⊘
Do you want full access?
Subscribe today to unlock all pages.
Trusted by 1+ million students worldwide
INTRODUCTION
In the present business environment, the key role is played by financial manager in
business performance. The financial manager has to plan, organize, direct and control the
financial activities of the organization. Finance is one of the most important resources for any
organization and in order to have effective business performance a manager needs to take
optimum utilization of its financial resources. The role of financial manager is to apply the
general management principles to financial resources of the organization.
The aim of the study is to provide an in-depth understanding of financial tools and
techniques that help a manager in making effective decisions. This report will be divided into
two major parts, first part includes the financial analysis of an organization and another part
includes the evaluation of two strategic investment projects.
PART 1
Company Overview
Wm Morrison Supermarkets plc (registered on LSE i.e. London Stock Exchange) is the
fourth largest food retailer in UK with its more than 400 stores. It was founded in 1899 and
presently branded as Morrisons. As on January, 2013 Company’s total revenue was £18,116m
(LSE, 2013).
1.1 Ratio Calculation: Most of the organizations publish their annual reports including their
financial statements for the year. Ratio analysis is the tool that is used for quantitative analysis of
those financial statements. The monetary growth of the organization can be identified by
calculating the ratios and comparing them with previous year ratios. Ratios can also be used for
comparing the business performance with any other organization or industry. On the basis of
financial statements, several ratios can be calculated that indicates the performance, financing,
activities and liquidity of the company (Arnold, 2005). Some common ratios for Wm Morrison
Supermarkets plc are being calculated below:
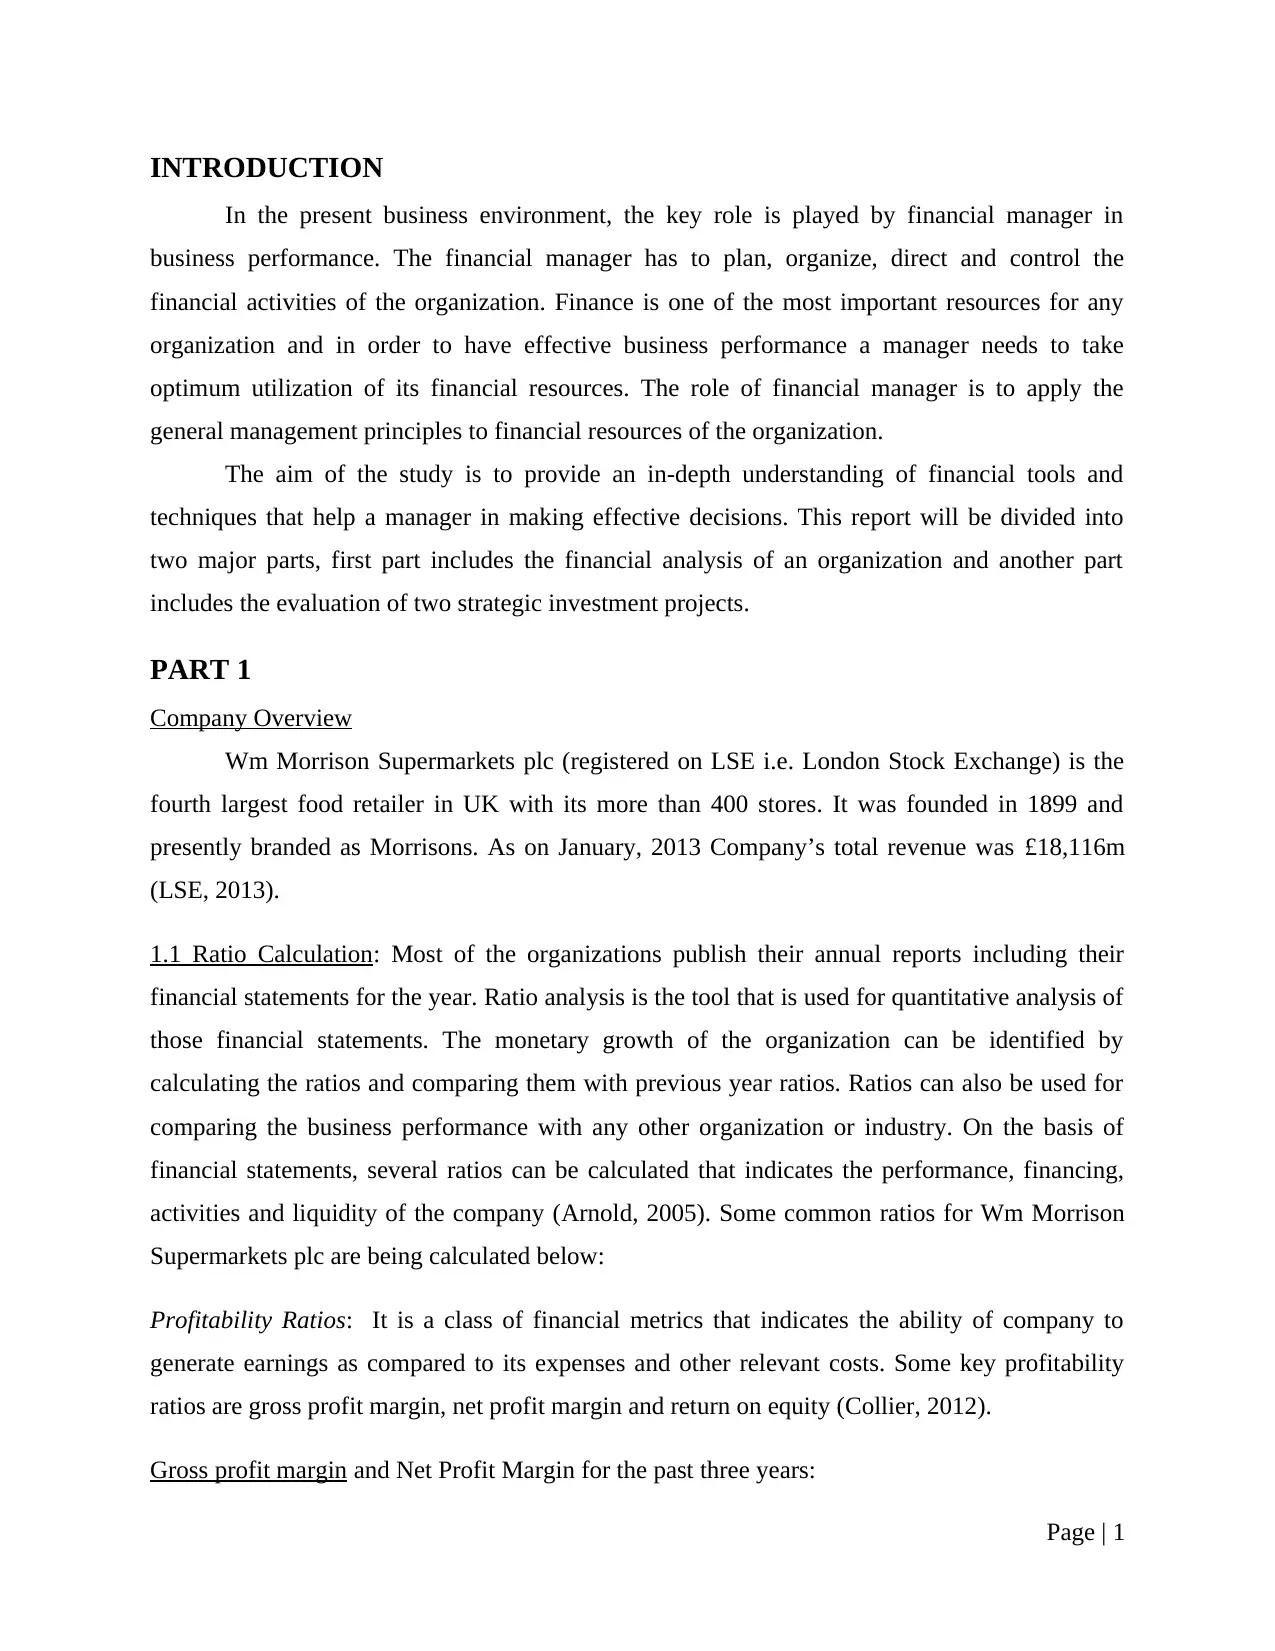
Profitability Ratios: It is a class of financial metrics that indicates the ability of company to
generate earnings as compared to its expenses and other relevant costs. Some key profitability
ratios are gross profit margin, net profit margin and return on equity (Collier, 2012).
Gross profit margin and Net Profit Margin for the past three years:
Page | 1
In the present business environment, the key role is played by financial manager in
business performance. The financial manager has to plan, organize, direct and control the
financial activities of the organization. Finance is one of the most important resources for any
organization and in order to have effective business performance a manager needs to take
optimum utilization of its financial resources. The role of financial manager is to apply the
general management principles to financial resources of the organization.
The aim of the study is to provide an in-depth understanding of financial tools and
techniques that help a manager in making effective decisions. This report will be divided into
two major parts, first part includes the financial analysis of an organization and another part
includes the evaluation of two strategic investment projects.
PART 1
Company Overview
Wm Morrison Supermarkets plc (registered on LSE i.e. London Stock Exchange) is the
fourth largest food retailer in UK with its more than 400 stores. It was founded in 1899 and
presently branded as Morrisons. As on January, 2013 Company’s total revenue was £18,116m
(LSE, 2013).
1.1 Ratio Calculation: Most of the organizations publish their annual reports including their
financial statements for the year. Ratio analysis is the tool that is used for quantitative analysis of
those financial statements. The monetary growth of the organization can be identified by
calculating the ratios and comparing them with previous year ratios. Ratios can also be used for
comparing the business performance with any other organization or industry. On the basis of
financial statements, several ratios can be calculated that indicates the performance, financing,
activities and liquidity of the company (Arnold, 2005). Some common ratios for Wm Morrison
Supermarkets plc are being calculated below:
Profitability Ratios: It is a class of financial metrics that indicates the ability of company to
generate earnings as compared to its expenses and other relevant costs. Some key profitability
ratios are gross profit margin, net profit margin and return on equity (Collier, 2012).
Gross profit margin and Net Profit Margin for the past three years:
Page | 1
Paraphrase This Document
Need a fresh take? Get an instant paraphrase of this document with our AI Paraphraser
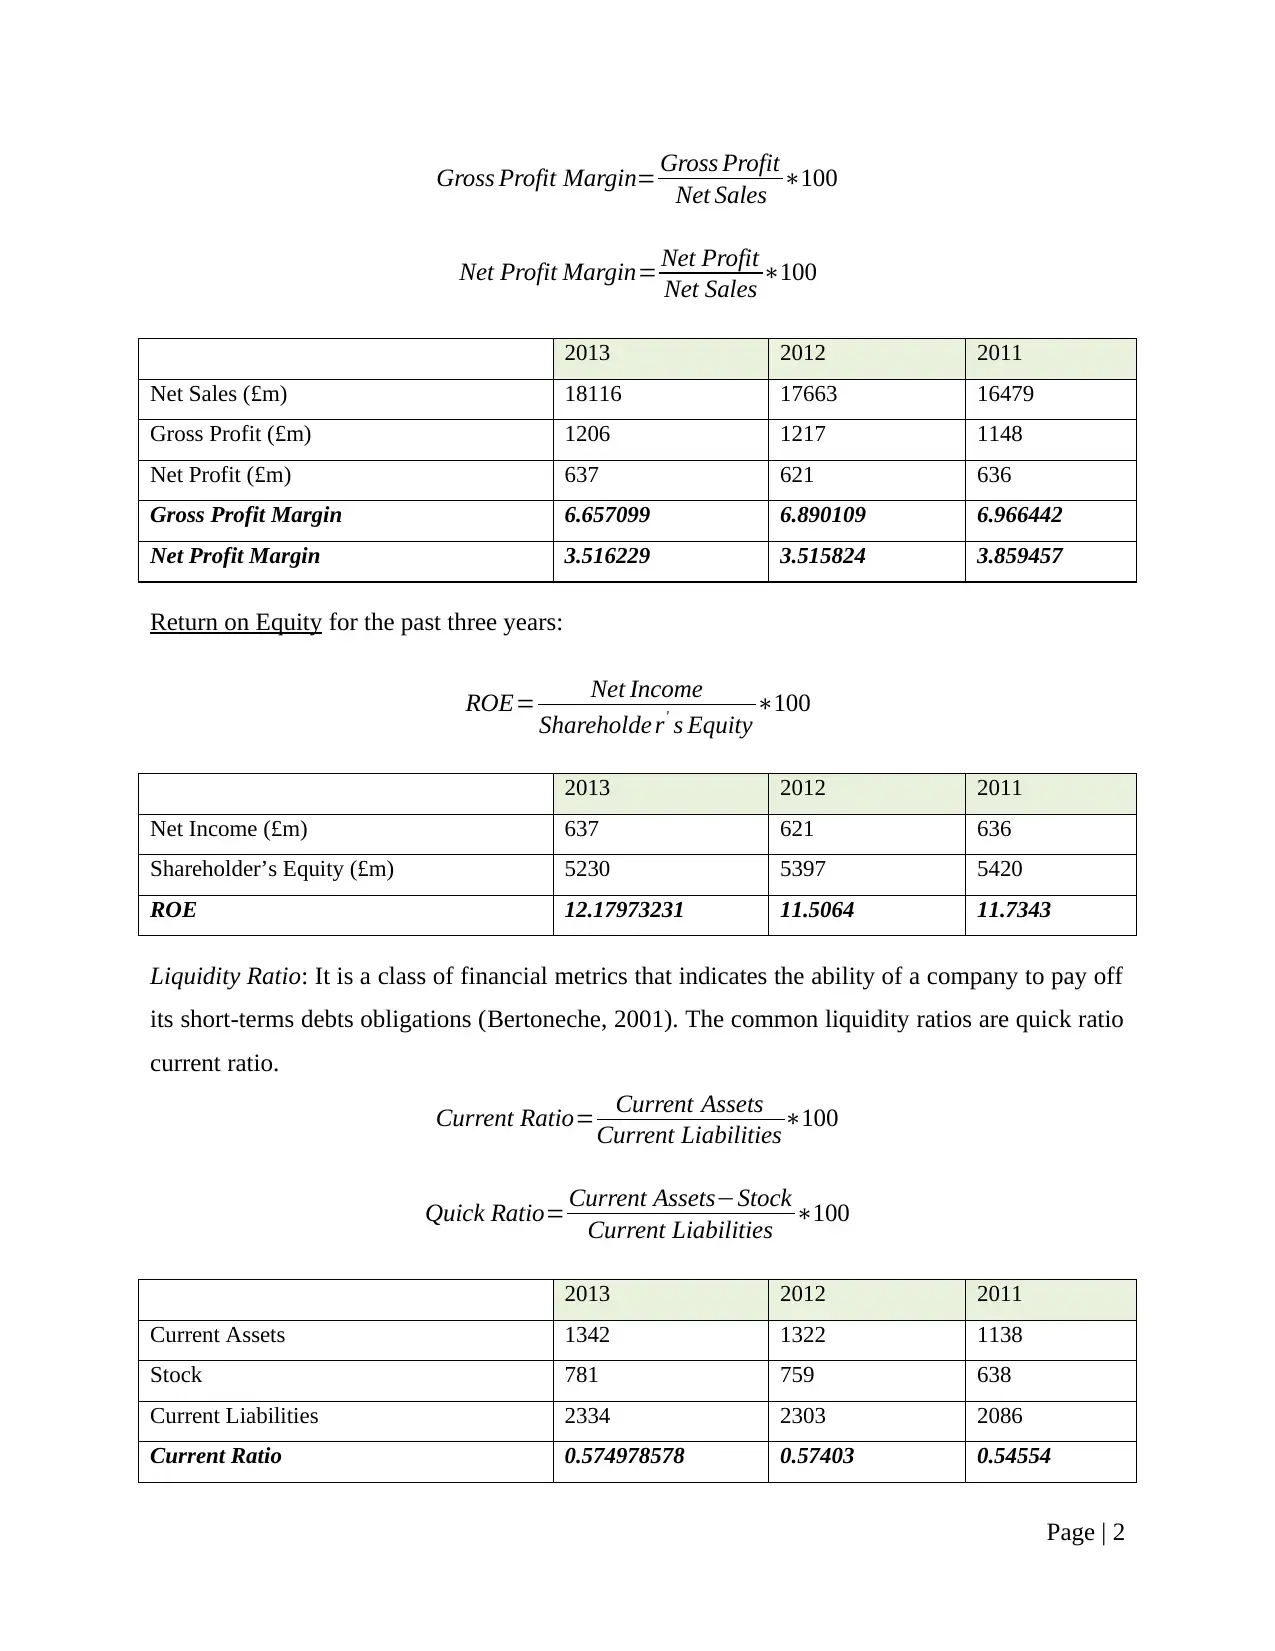
Gross Profit Margin= Gross Profit
Net Sales ∗100
Net Profit Margin= Net Profit
Net Sales ∗100
2013 2012 2011
Net Sales (£m) 18116 17663 16479
Gross Profit (£m) 1206 1217 1148
Net Profit (£m) 637 621 636
Gross Profit Margin 6.657099 6.890109 6.966442
Net Profit Margin 3.516229 3.515824 3.859457
Return on Equity for the past three years:
ROE= Net Income
Shareholde r' s Equity ∗100
2013 2012 2011
Net Income (£m) 637 621 636
Shareholder’s Equity (£m) 5230 5397 5420
ROE 12.17973231 11.5064 11.7343
Liquidity Ratio: It is a class of financial metrics that indicates the ability of a company to pay off
its short-terms debts obligations (Bertoneche, 2001). The common liquidity ratios are quick ratio
current ratio.
Current Ratio= Current Assets
Current Liabilities∗100
Quick Ratio= Current Assets−Stock
Current Liabilities ∗100
2013 2012 2011
Current Assets 1342 1322 1138
Stock 781 759 638
Current Liabilities 2334 2303 2086
Current Ratio 0.574978578 0.57403 0.54554
Page | 2
Net Sales ∗100
Net Profit Margin= Net Profit
Net Sales ∗100
2013 2012 2011
Net Sales (£m) 18116 17663 16479
Gross Profit (£m) 1206 1217 1148
Net Profit (£m) 637 621 636
Gross Profit Margin 6.657099 6.890109 6.966442
Net Profit Margin 3.516229 3.515824 3.859457
Return on Equity for the past three years:
ROE= Net Income
Shareholde r' s Equity ∗100
2013 2012 2011
Net Income (£m) 637 621 636
Shareholder’s Equity (£m) 5230 5397 5420
ROE 12.17973231 11.5064 11.7343
Liquidity Ratio: It is a class of financial metrics that indicates the ability of a company to pay off
its short-terms debts obligations (Bertoneche, 2001). The common liquidity ratios are quick ratio
current ratio.
Current Ratio= Current Assets
Current Liabilities∗100
Quick Ratio= Current Assets−Stock
Current Liabilities ∗100
2013 2012 2011
Current Assets 1342 1322 1138
Stock 781 759 638
Current Liabilities 2334 2303 2086
Current Ratio 0.574978578 0.57403 0.54554
Page | 2
Quick Ratio 0.240359897 0.24446 0.23969
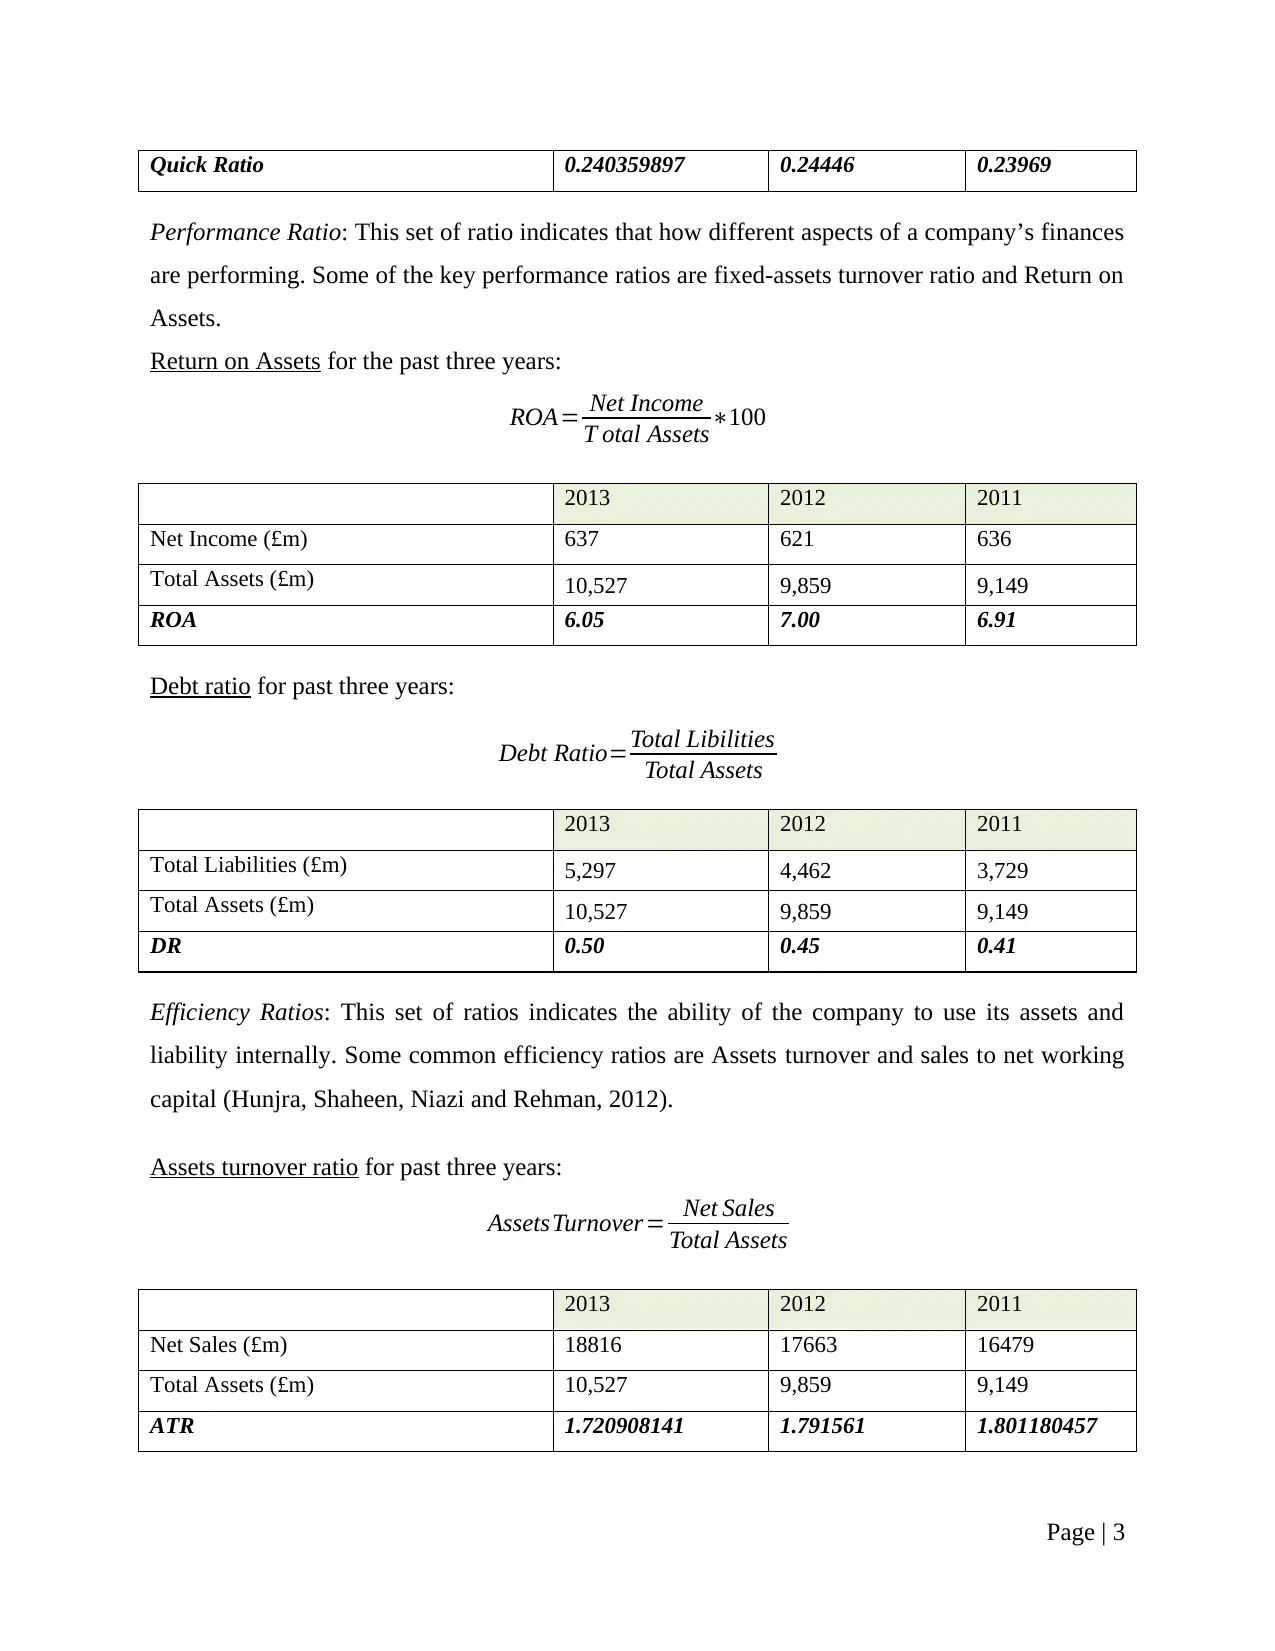
Performance Ratio: This set of ratio indicates that how different aspects of a company’s finances
are performing. Some of the key performance ratios are fixed-assets turnover ratio and Return on
Assets.
Return on Assets for the past three years:
ROA= Net Income
T otal Assets∗100
2013 2012 2011
Net Income (£m) 637 621 636
Total Assets (£m) 10,527 9,859 9,149
ROA 6.05 7.00 6.91
Debt ratio for past three years:
Debt Ratio=Total Libilities
Total Assets
2013 2012 2011
Total Liabilities (£m) 5,297 4,462 3,729
Total Assets (£m) 10,527 9,859 9,149
DR 0.50 0.45 0.41
Efficiency Ratios: This set of ratios indicates the ability of the company to use its assets and
liability internally. Some common efficiency ratios are Assets turnover and sales to net working
capital (Hunjra, Shaheen, Niazi and Rehman, 2012).
Assets turnover ratio for past three years:
AssetsTurnover= Net Sales
Total Assets
2013 2012 2011
Net Sales (£m) 18816 17663 16479
Total Assets (£m) 10,527 9,859 9,149
ATR 1.720908141 1.791561 1.801180457
Page | 3
⊘ This is a preview!⊘
Do you want full access?
Subscribe today to unlock all pages.
Trusted by 1+ million students worldwide
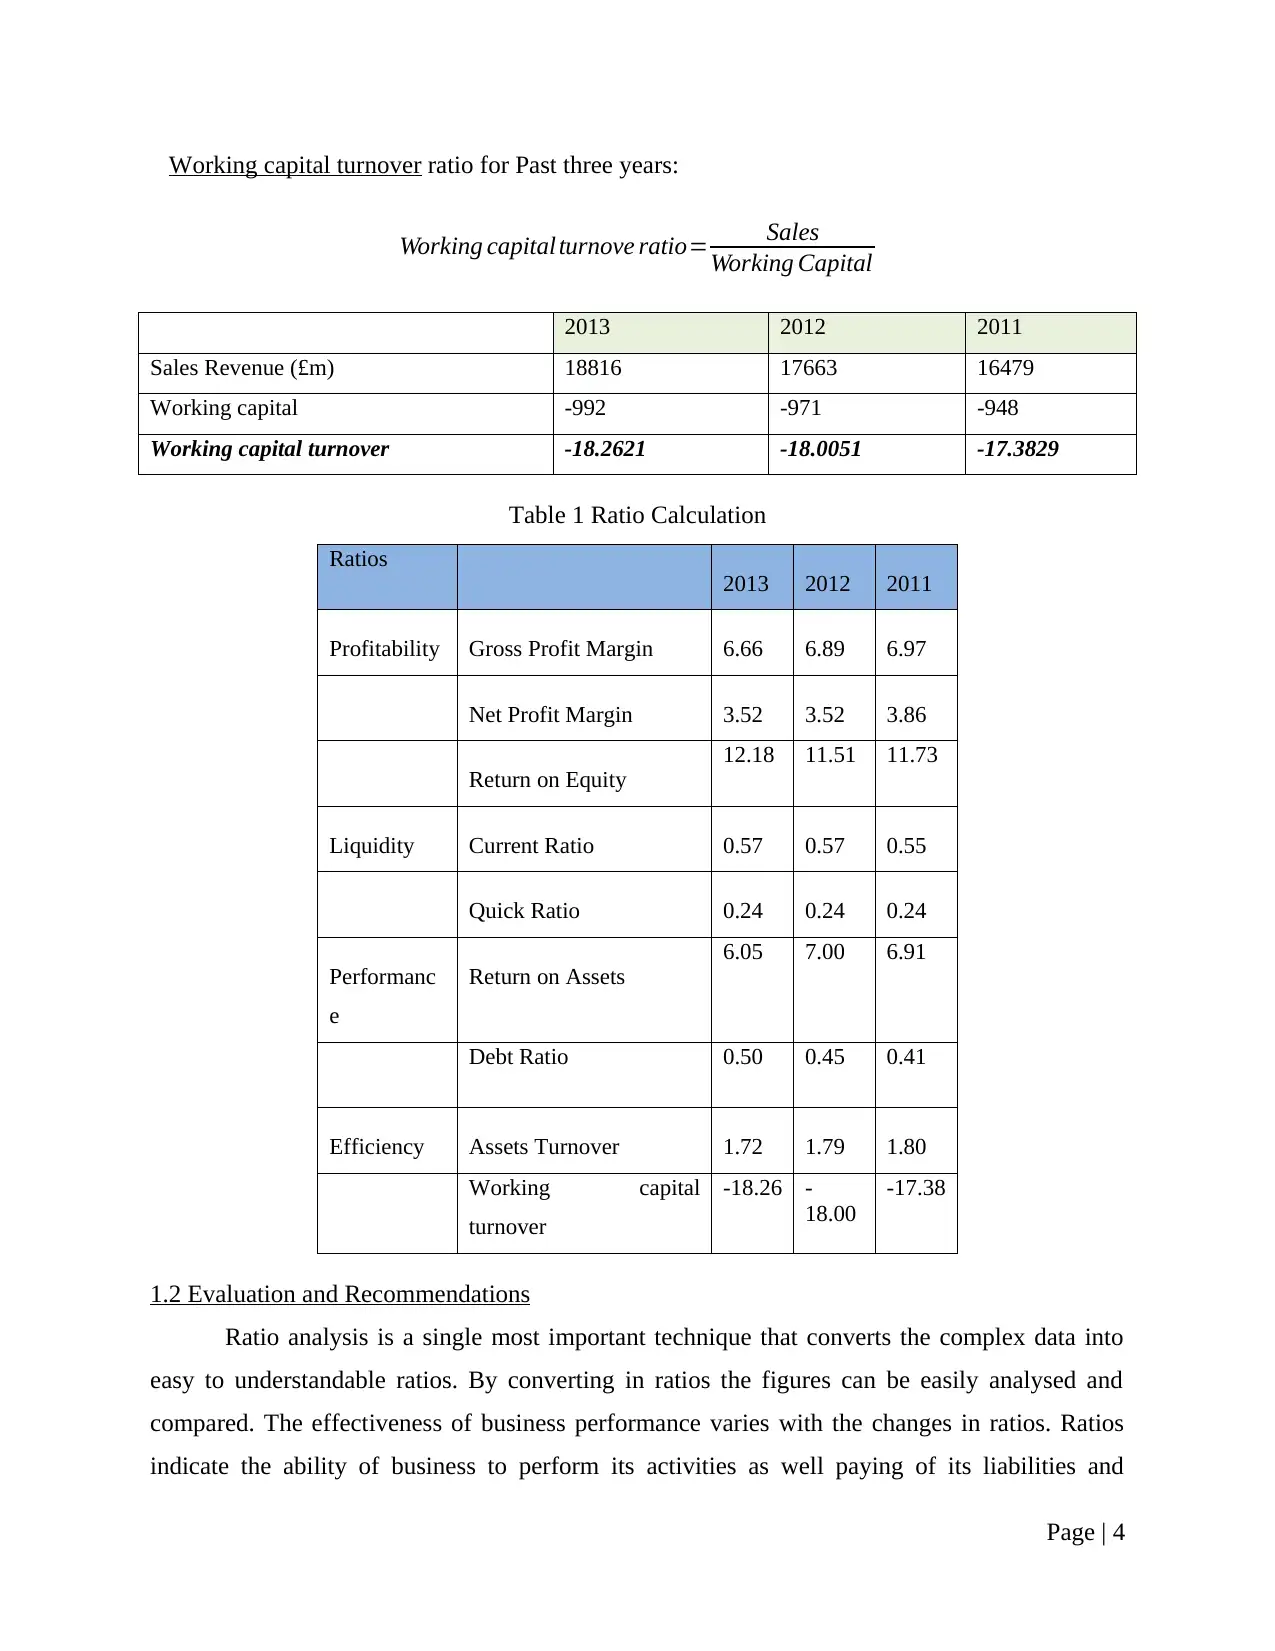
Working capital turnover ratio for Past three years:
Working capital turnove ratio= Sales
Working Capital
2013 2012 2011
Sales Revenue (£m) 18816 17663 16479
Working capital -992 -971 -948
Working capital turnover -18.2621 -18.0051 -17.3829
Table 1 Ratio Calculation
Ratios
2013 2012 2011
Profitability Gross Profit Margin 6.66 6.89 6.97
Net Profit Margin 3.52 3.52 3.86
Return on Equity
12.18 11.51 11.73
Liquidity Current Ratio 0.57 0.57 0.55
Quick Ratio 0.24 0.24 0.24
Performanc
e
Return on Assets
6.05 7.00 6.91
Debt Ratio 0.50 0.45 0.41
Efficiency Assets Turnover 1.72 1.79 1.80
Working capital
turnover
-18.26 -
18.00
-17.38
1.2 Evaluation and Recommendations
Ratio analysis is a single most important technique that converts the complex data into
easy to understandable ratios. By converting in ratios the figures can be easily analysed and
compared. The effectiveness of business performance varies with the changes in ratios. Ratios
indicate the ability of business to perform its activities as well paying of its liabilities and
Page | 4
Paraphrase This Document
Need a fresh take? Get an instant paraphrase of this document with our AI Paraphraser
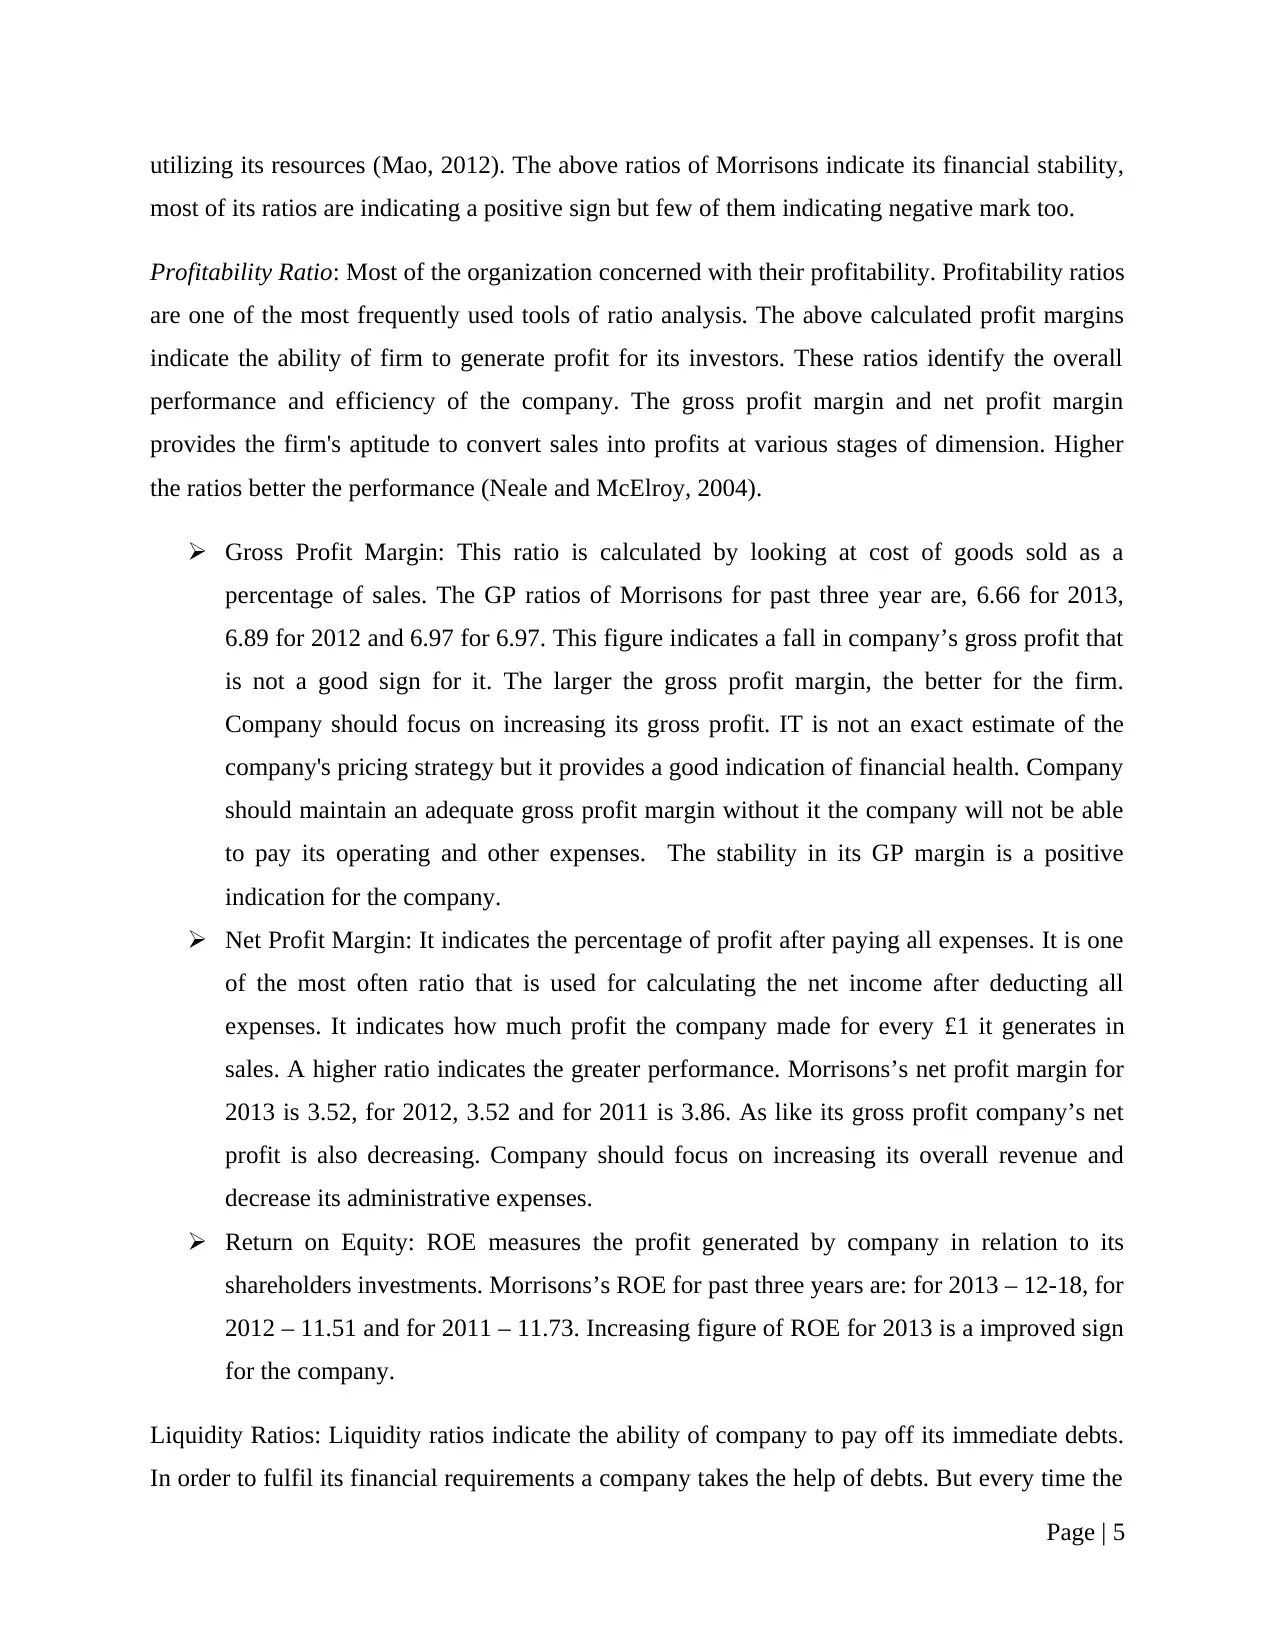
utilizing its resources (Mao, 2012). The above ratios of Morrisons indicate its financial stability,
most of its ratios are indicating a positive sign but few of them indicating negative mark too.
Profitability Ratio: Most of the organization concerned with their profitability. Profitability ratios
are one of the most frequently used tools of ratio analysis. The above calculated profit margins
indicate the ability of firm to generate profit for its investors. These ratios identify the overall
performance and efficiency of the company. The gross profit margin and net profit margin
provides the firm's aptitude to convert sales into profits at various stages of dimension. Higher
the ratios better the performance (Neale and McElroy, 2004).
Gross Profit Margin: This ratio is calculated by looking at cost of goods sold as a
percentage of sales. The GP ratios of Morrisons for past three year are, 6.66 for 2013,
6.89 for 2012 and 6.97 for 6.97. This figure indicates a fall in company’s gross profit that
is not a good sign for it. The larger the gross profit margin, the better for the firm.
Company should focus on increasing its gross profit. IT is not an exact estimate of the
company's pricing strategy but it provides a good indication of financial health. Company
should maintain an adequate gross profit margin without it the company will not be able
to pay its operating and other expenses. The stability in its GP margin is a positive
indication for the company.
Net Profit Margin: It indicates the percentage of profit after paying all expenses. It is one
of the most often ratio that is used for calculating the net income after deducting all
expenses. It indicates how much profit the company made for every £1 it generates in
sales. A higher ratio indicates the greater performance. Morrisons’s net profit margin for
2013 is 3.52, for 2012, 3.52 and for 2011 is 3.86. As like its gross profit company’s net
profit is also decreasing. Company should focus on increasing its overall revenue and
decrease its administrative expenses.
Return on Equity: ROE measures the profit generated by company in relation to its
shareholders investments. Morrisons’s ROE for past three years are: for 2013 – 12-18, for
2012 – 11.51 and for 2011 – 11.73. Increasing figure of ROE for 2013 is a improved sign
for the company.
Liquidity Ratios: Liquidity ratios indicate the ability of company to pay off its immediate debts.
In order to fulfil its financial requirements a company takes the help of debts. But every time the
Page | 5
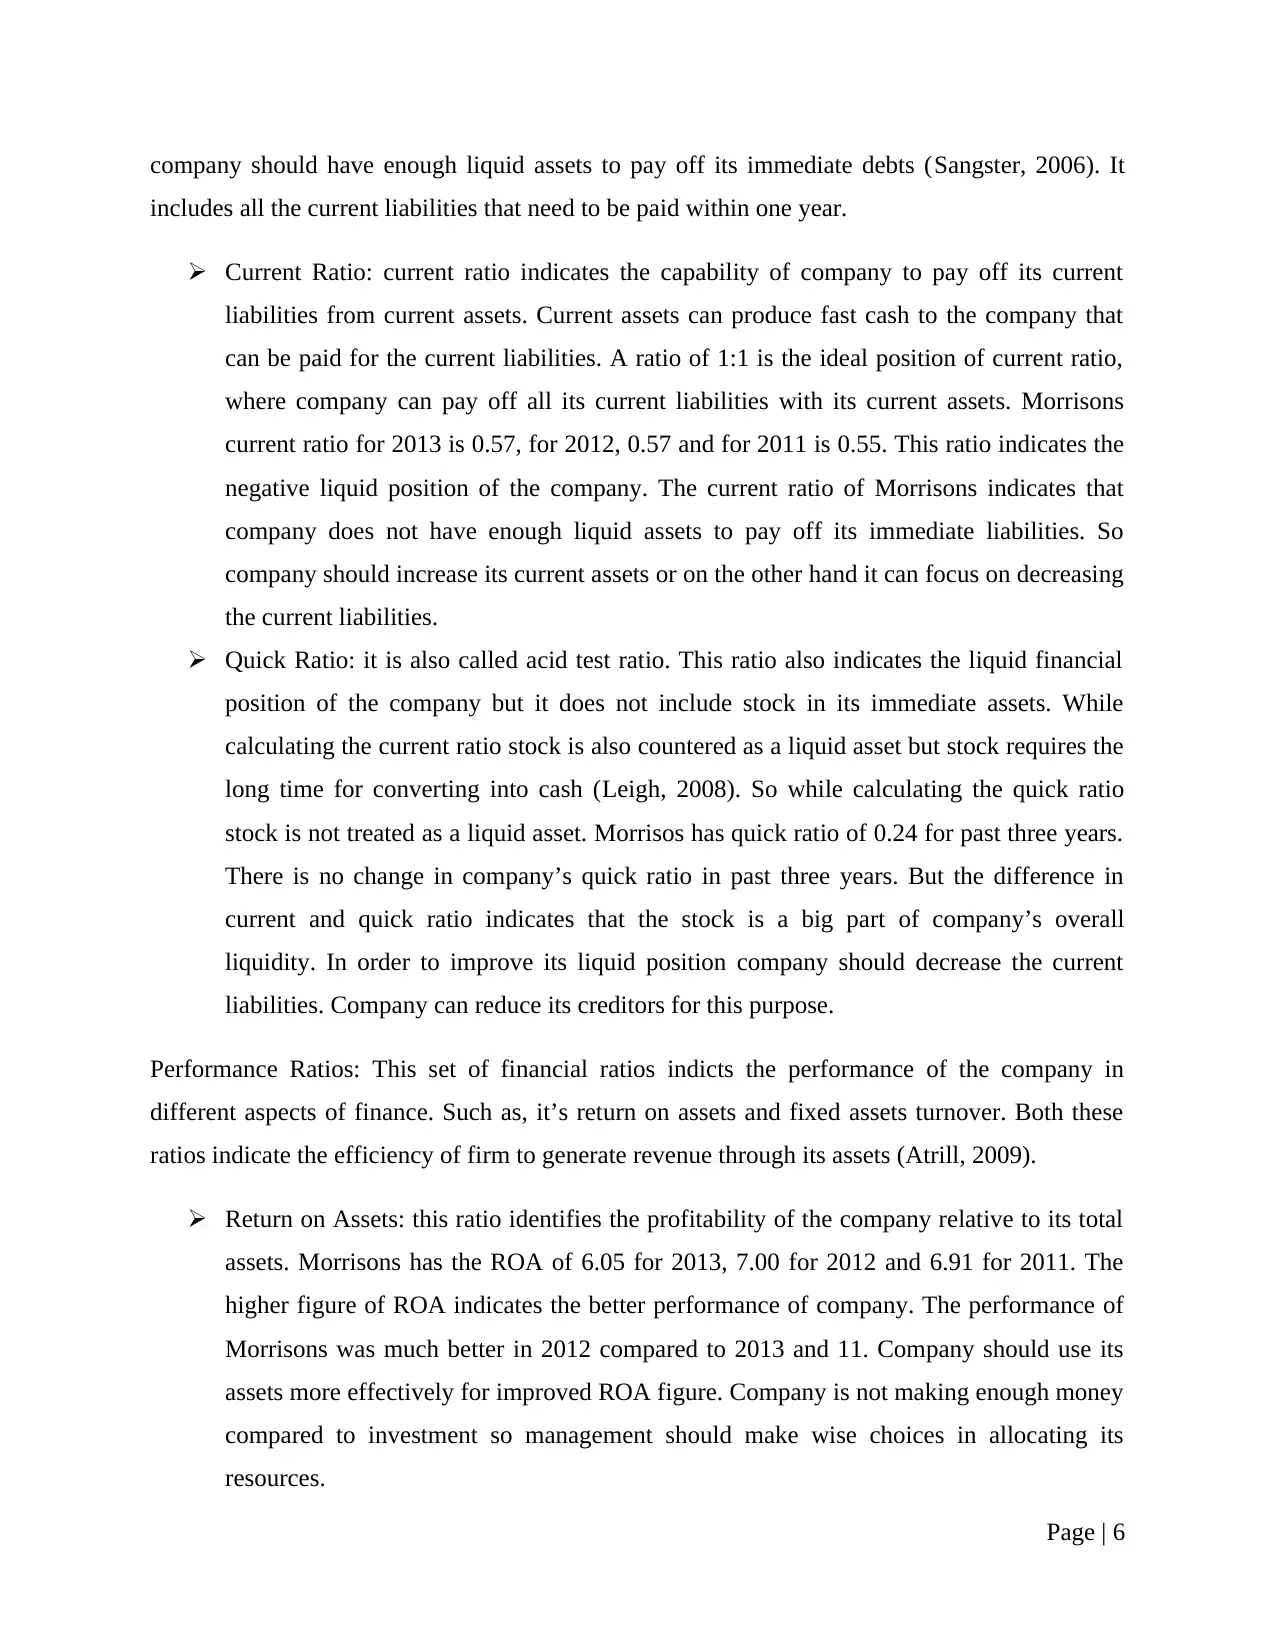
company should have enough liquid assets to pay off its immediate debts (Sangster, 2006). It
includes all the current liabilities that need to be paid within one year.
Current Ratio: current ratio indicates the capability of company to pay off its current
liabilities from current assets. Current assets can produce fast cash to the company that
can be paid for the current liabilities. A ratio of 1:1 is the ideal position of current ratio,
where company can pay off all its current liabilities with its current assets. Morrisons
current ratio for 2013 is 0.57, for 2012, 0.57 and for 2011 is 0.55. This ratio indicates the
negative liquid position of the company. The current ratio of Morrisons indicates that
company does not have enough liquid assets to pay off its immediate liabilities. So
company should increase its current assets or on the other hand it can focus on decreasing
the current liabilities.
Quick Ratio: it is also called acid test ratio. This ratio also indicates the liquid financial
position of the company but it does not include stock in its immediate assets. While
calculating the current ratio stock is also countered as a liquid asset but stock requires the
long time for converting into cash (Leigh, 2008). So while calculating the quick ratio
stock is not treated as a liquid asset. Morrisos has quick ratio of 0.24 for past three years.
There is no change in company’s quick ratio in past three years. But the difference in
current and quick ratio indicates that the stock is a big part of company’s overall
liquidity. In order to improve its liquid position company should decrease the current
liabilities. Company can reduce its creditors for this purpose.
Performance Ratios: This set of financial ratios indicts the performance of the company in
different aspects of finance. Such as, it’s return on assets and fixed assets turnover. Both these
ratios indicate the efficiency of firm to generate revenue through its assets (Atrill, 2009).
Return on Assets: this ratio identifies the profitability of the company relative to its total
assets. Morrisons has the ROA of 6.05 for 2013, 7.00 for 2012 and 6.91 for 2011. The
higher figure of ROA indicates the better performance of company. The performance of
Morrisons was much better in 2012 compared to 2013 and 11. Company should use its
assets more effectively for improved ROA figure. Company is not making enough money
compared to investment so management should make wise choices in allocating its
resources.
Page | 6
⊘ This is a preview!⊘
Do you want full access?
Subscribe today to unlock all pages.
Trusted by 1+ million students worldwide
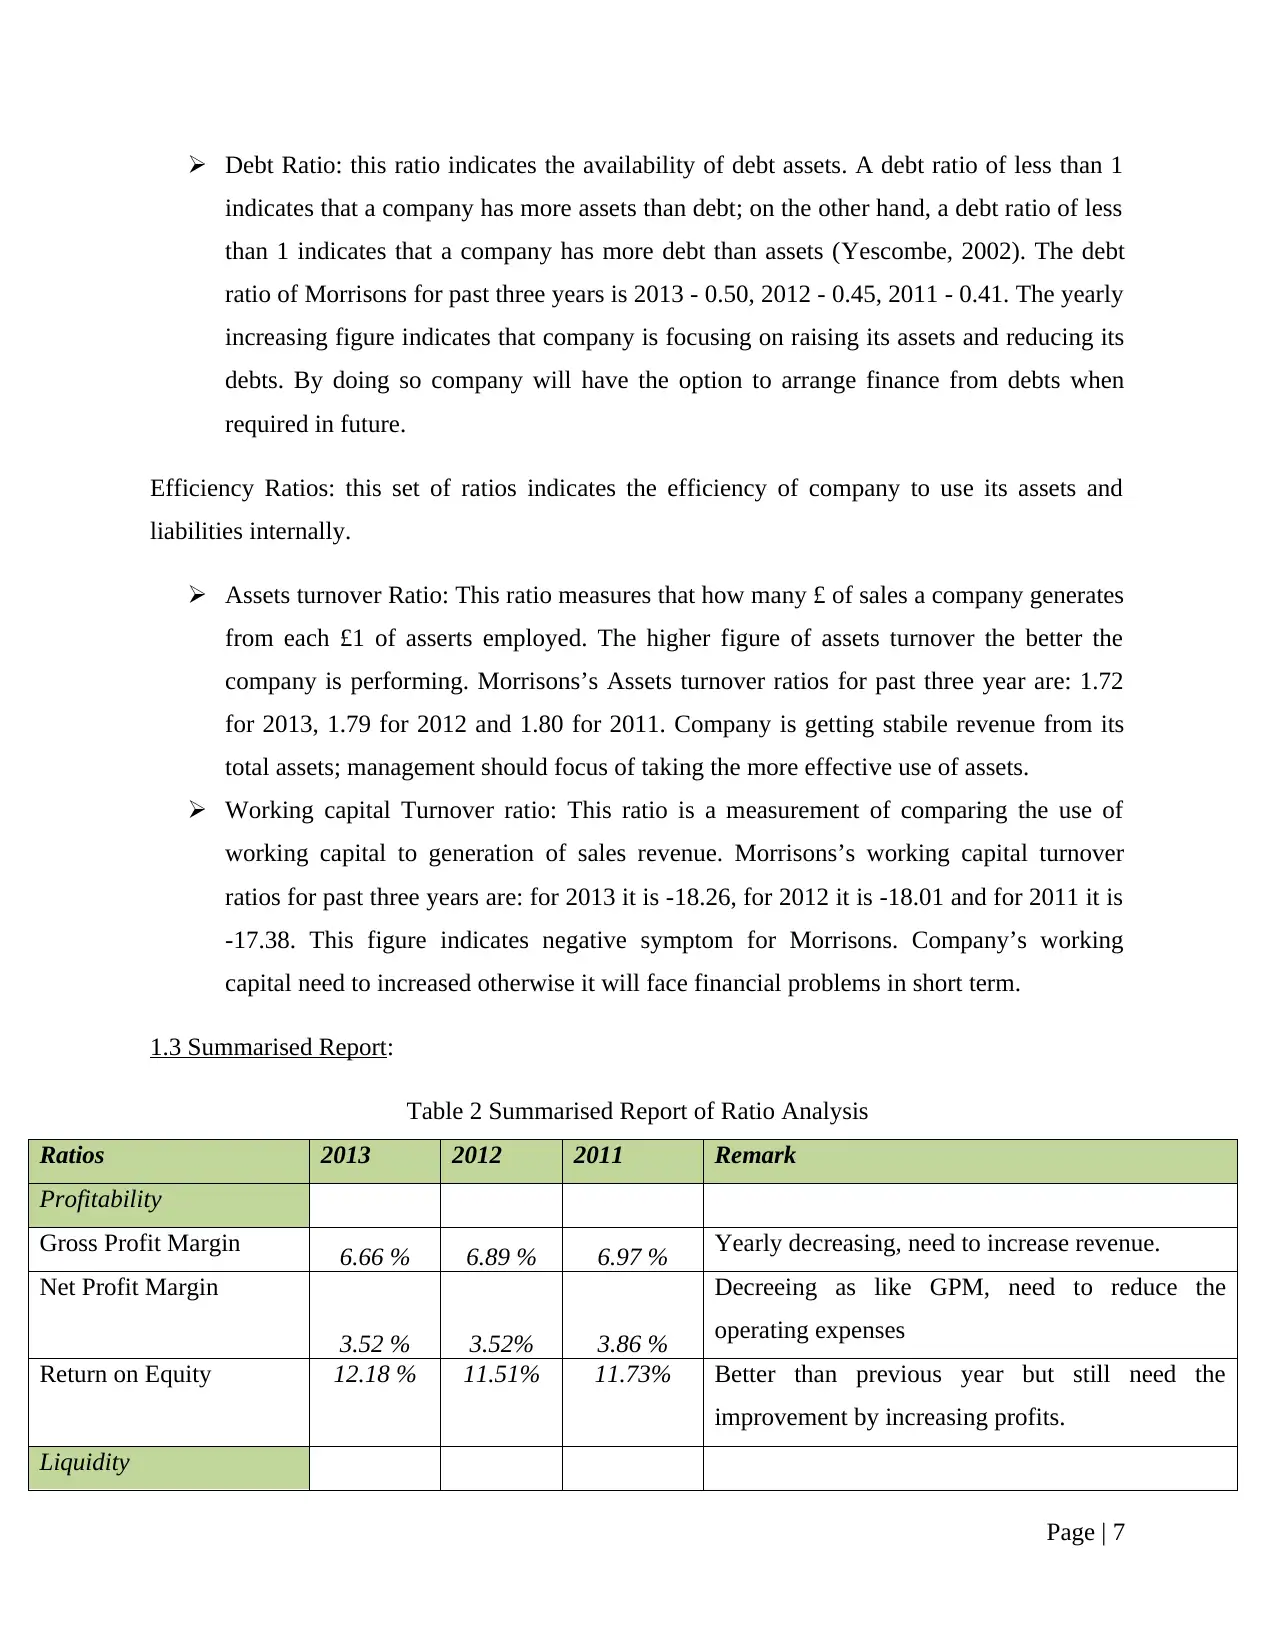
Debt Ratio: this ratio indicates the availability of debt assets. A debt ratio of less than 1
indicates that a company has more assets than debt; on the other hand, a debt ratio of less
than 1 indicates that a company has more debt than assets (Yescombe, 2002). The debt
ratio of Morrisons for past three years is 2013 - 0.50, 2012 - 0.45, 2011 - 0.41. The yearly
increasing figure indicates that company is focusing on raising its assets and reducing its
debts. By doing so company will have the option to arrange finance from debts when
required in future.
Efficiency Ratios: this set of ratios indicates the efficiency of company to use its assets and
liabilities internally.
Assets turnover Ratio: This ratio measures that how many £ of sales a company generates
from each £1 of asserts employed. The higher figure of assets turnover the better the
company is performing. Morrisons’s Assets turnover ratios for past three year are: 1.72
for 2013, 1.79 for 2012 and 1.80 for 2011. Company is getting stabile revenue from its
total assets; management should focus of taking the more effective use of assets.
Working capital Turnover ratio: This ratio is a measurement of comparing the use of
working capital to generation of sales revenue. Morrisons’s working capital turnover
ratios for past three years are: for 2013 it is -18.26, for 2012 it is -18.01 and for 2011 it is
-17.38. This figure indicates negative symptom for Morrisons. Company’s working
capital need to increased otherwise it will face financial problems in short term.
1.3 Summarised Report:
Table 2 Summarised Report of Ratio Analysis
Ratios 2013 2012 2011 Remark
Profitability
Gross Profit Margin 6.66 % 6.89 % 6.97 % Yearly decreasing, need to increase revenue.
Net Profit Margin
3.52 % 3.52% 3.86 %
Decreeing as like GPM, need to reduce the
operating expenses
Return on Equity 12.18 % 11.51% 11.73% Better than previous year but still need the
improvement by increasing profits.
Liquidity
Page | 7
Paraphrase This Document
Need a fresh take? Get an instant paraphrase of this document with our AI Paraphraser
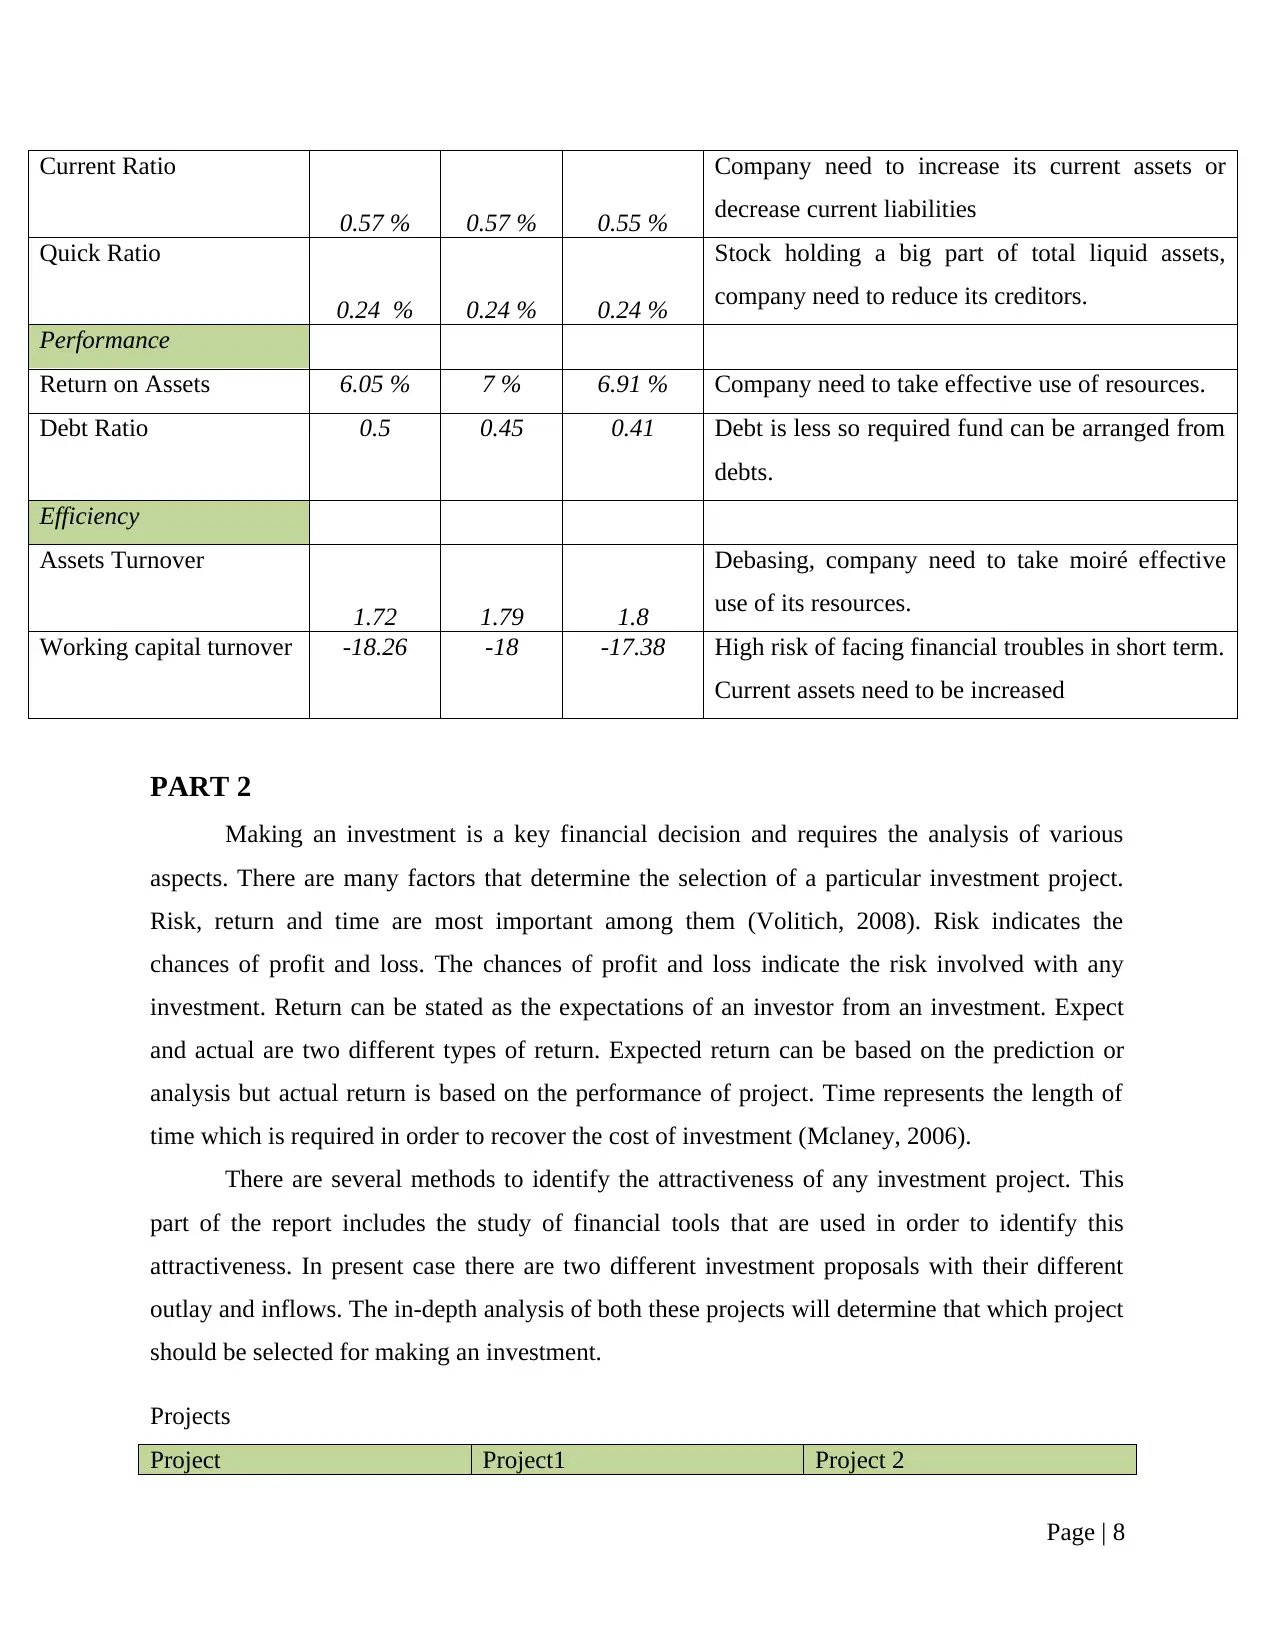
Current Ratio
0.57 % 0.57 % 0.55 %
Company need to increase its current assets or
decrease current liabilities
Quick Ratio
0.24 % 0.24 % 0.24 %
Stock holding a big part of total liquid assets,
company need to reduce its creditors.
Performance
Return on Assets 6.05 % 7 % 6.91 % Company need to take effective use of resources.
Debt Ratio 0.5 0.45 0.41 Debt is less so required fund can be arranged from
debts.
Efficiency
Assets Turnover
1.72 1.79 1.8
Debasing, company need to take moiré effective
use of its resources.
Working capital turnover -18.26 -18 -17.38 High risk of facing financial troubles in short term.
Current assets need to be increased
PART 2
Making an investment is a key financial decision and requires the analysis of various
aspects. There are many factors that determine the selection of a particular investment project.
Risk, return and time are most important among them (Volitich, 2008). Risk indicates the
chances of profit and loss. The chances of profit and loss indicate the risk involved with any
investment. Return can be stated as the expectations of an investor from an investment. Expect
and actual are two different types of return. Expected return can be based on the prediction or
analysis but actual return is based on the performance of project. Time represents the length of
time which is required in order to recover the cost of investment (Mclaney, 2006).
There are several methods to identify the attractiveness of any investment project. This
part of the report includes the study of financial tools that are used in order to identify this
attractiveness. In present case there are two different investment proposals with their different
outlay and inflows. The in-depth analysis of both these projects will determine that which project
should be selected for making an investment.
Projects
Project Project1 Project 2
Page | 8
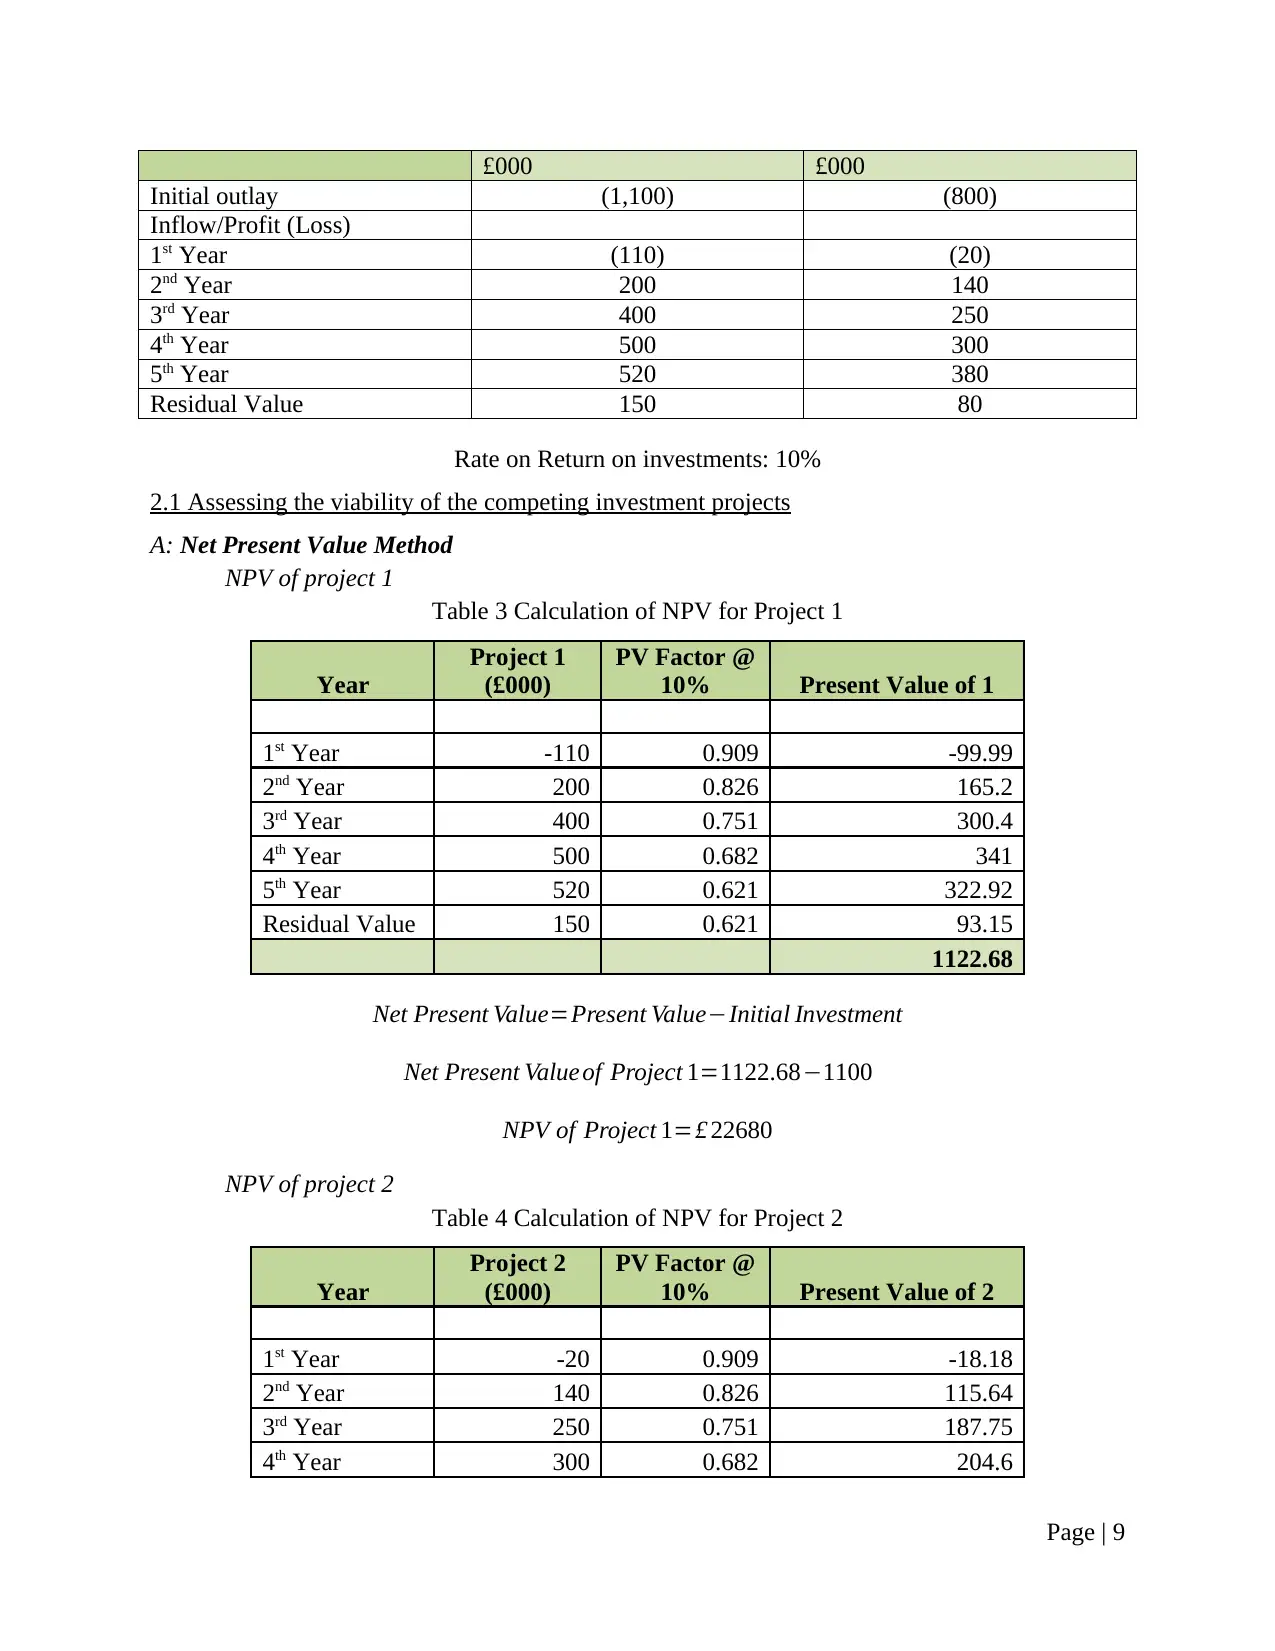
£000 £000
Initial outlay (1,100) (800)
Inflow/Profit (Loss)
1st Year (110) (20)
2nd Year 200 140
3rd Year 400 250
4th Year 500 300
5th Year 520 380
Residual Value 150 80
Rate on Return on investments: 10%
2.1 Assessing the viability of the competing investment projects
A: Net Present Value Method
NPV of project 1
Table 3 Calculation of NPV for Project 1
Year
Project 1
(£000)
PV Factor @
10% Present Value of 1
1st Year -110 0.909 -99.99
2nd Year 200 0.826 165.2
3rd Year 400 0.751 300.4
4th Year 500 0.682 341
5th Year 520 0.621 322.92
Residual Value 150 0.621 93.15
1122.68
Net Present Value=Present Value−Initial Investment
Net Present Valueof Project 1=1122.68−1100
NPV of Project 1=£ 22680
NPV of project 2
Table 4 Calculation of NPV for Project 2
Year
Project 2
(£000)
PV Factor @
10% Present Value of 2
1st Year -20 0.909 -18.18
2nd Year 140 0.826 115.64
3rd Year 250 0.751 187.75
4th Year 300 0.682 204.6
Page | 9
⊘ This is a preview!⊘
Do you want full access?
Subscribe today to unlock all pages.
Trusted by 1+ million students worldwide
1 out of 22
Related Documents


Your All-in-One AI-Powered Toolkit for Academic Success.
+13062052269
info@desklib.com
Available 24*7 on WhatsApp / Email
![[object Object]](/_next/static/media/star-bottom.7253800d.svg)
Unlock your academic potential
Copyright © 2020–2026 A2Z Services. All Rights Reserved. Developed and managed by ZUCOL.