Detailed Investment Appraisal Report: Wonder Pump Project Analysis

Verified

Added on  2019/12/04

|34
|2502
|174
Report
AI Summary
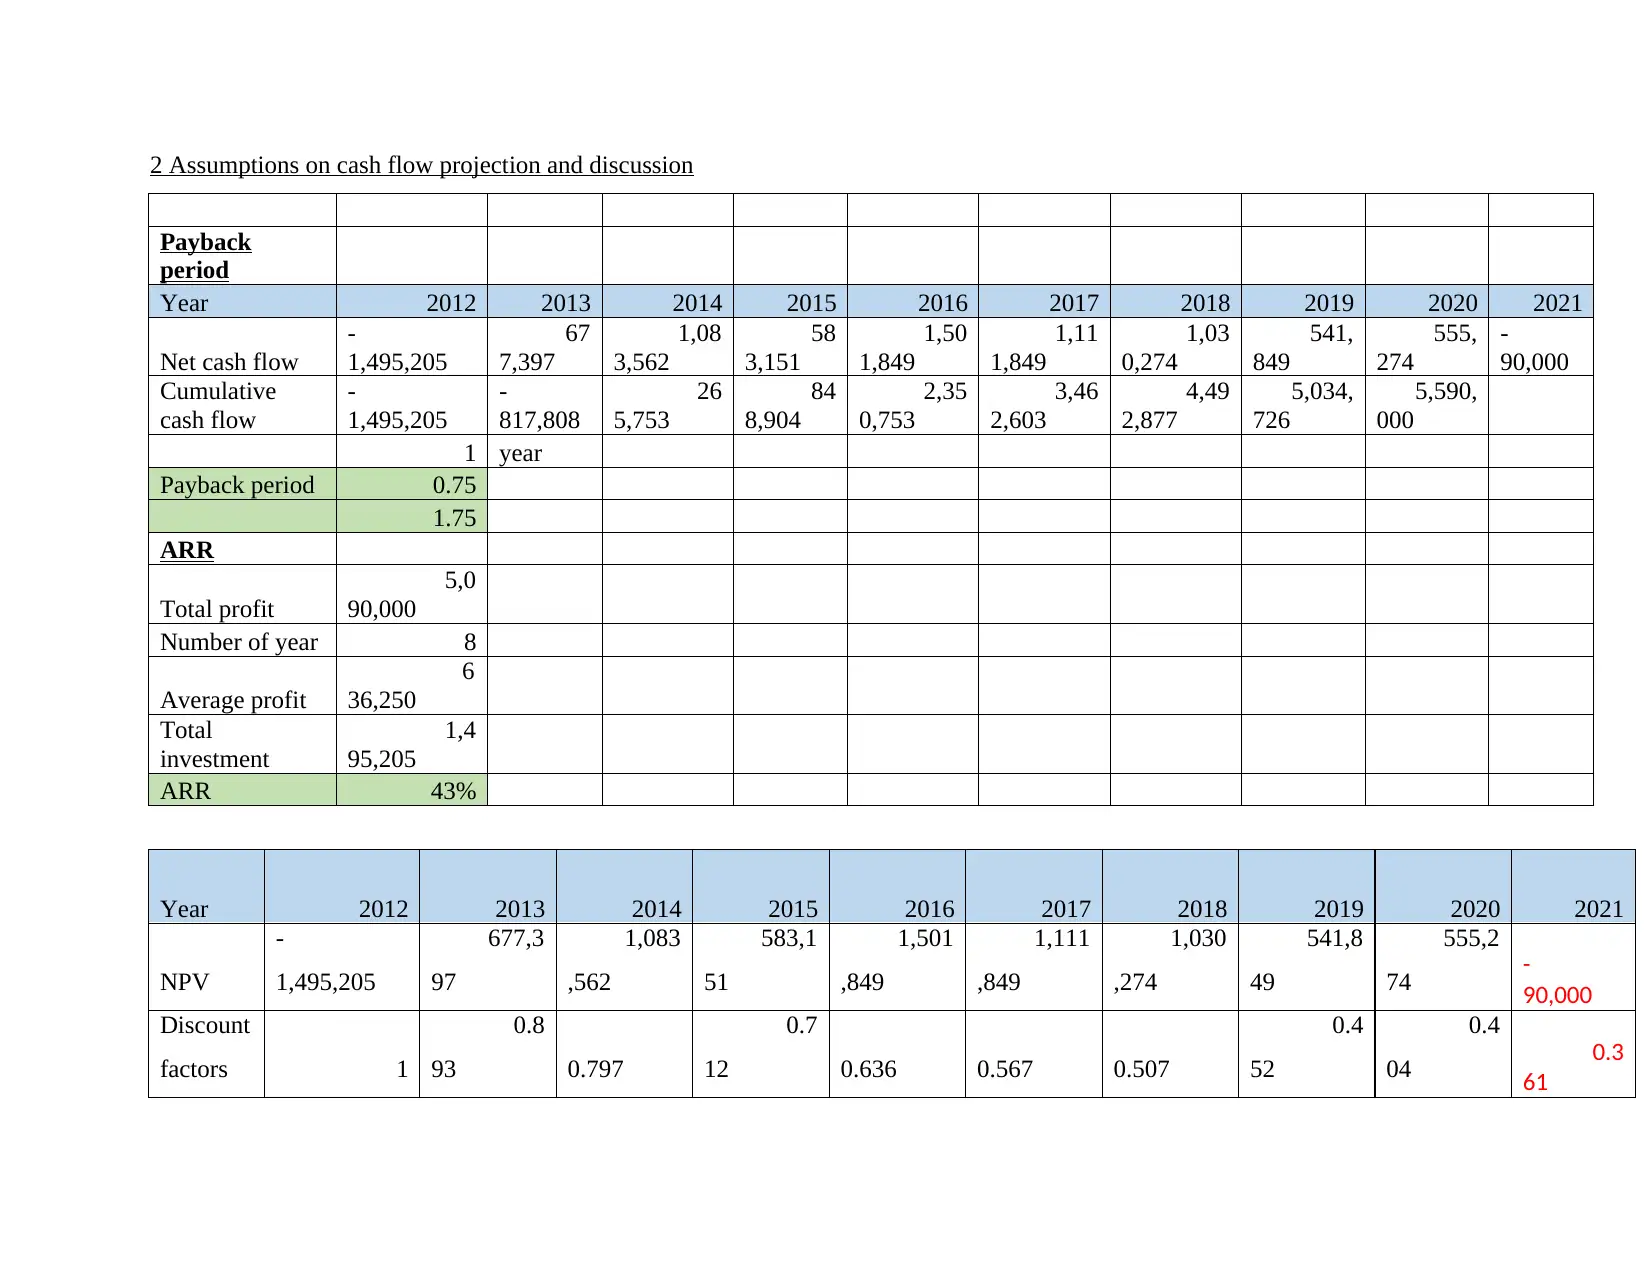
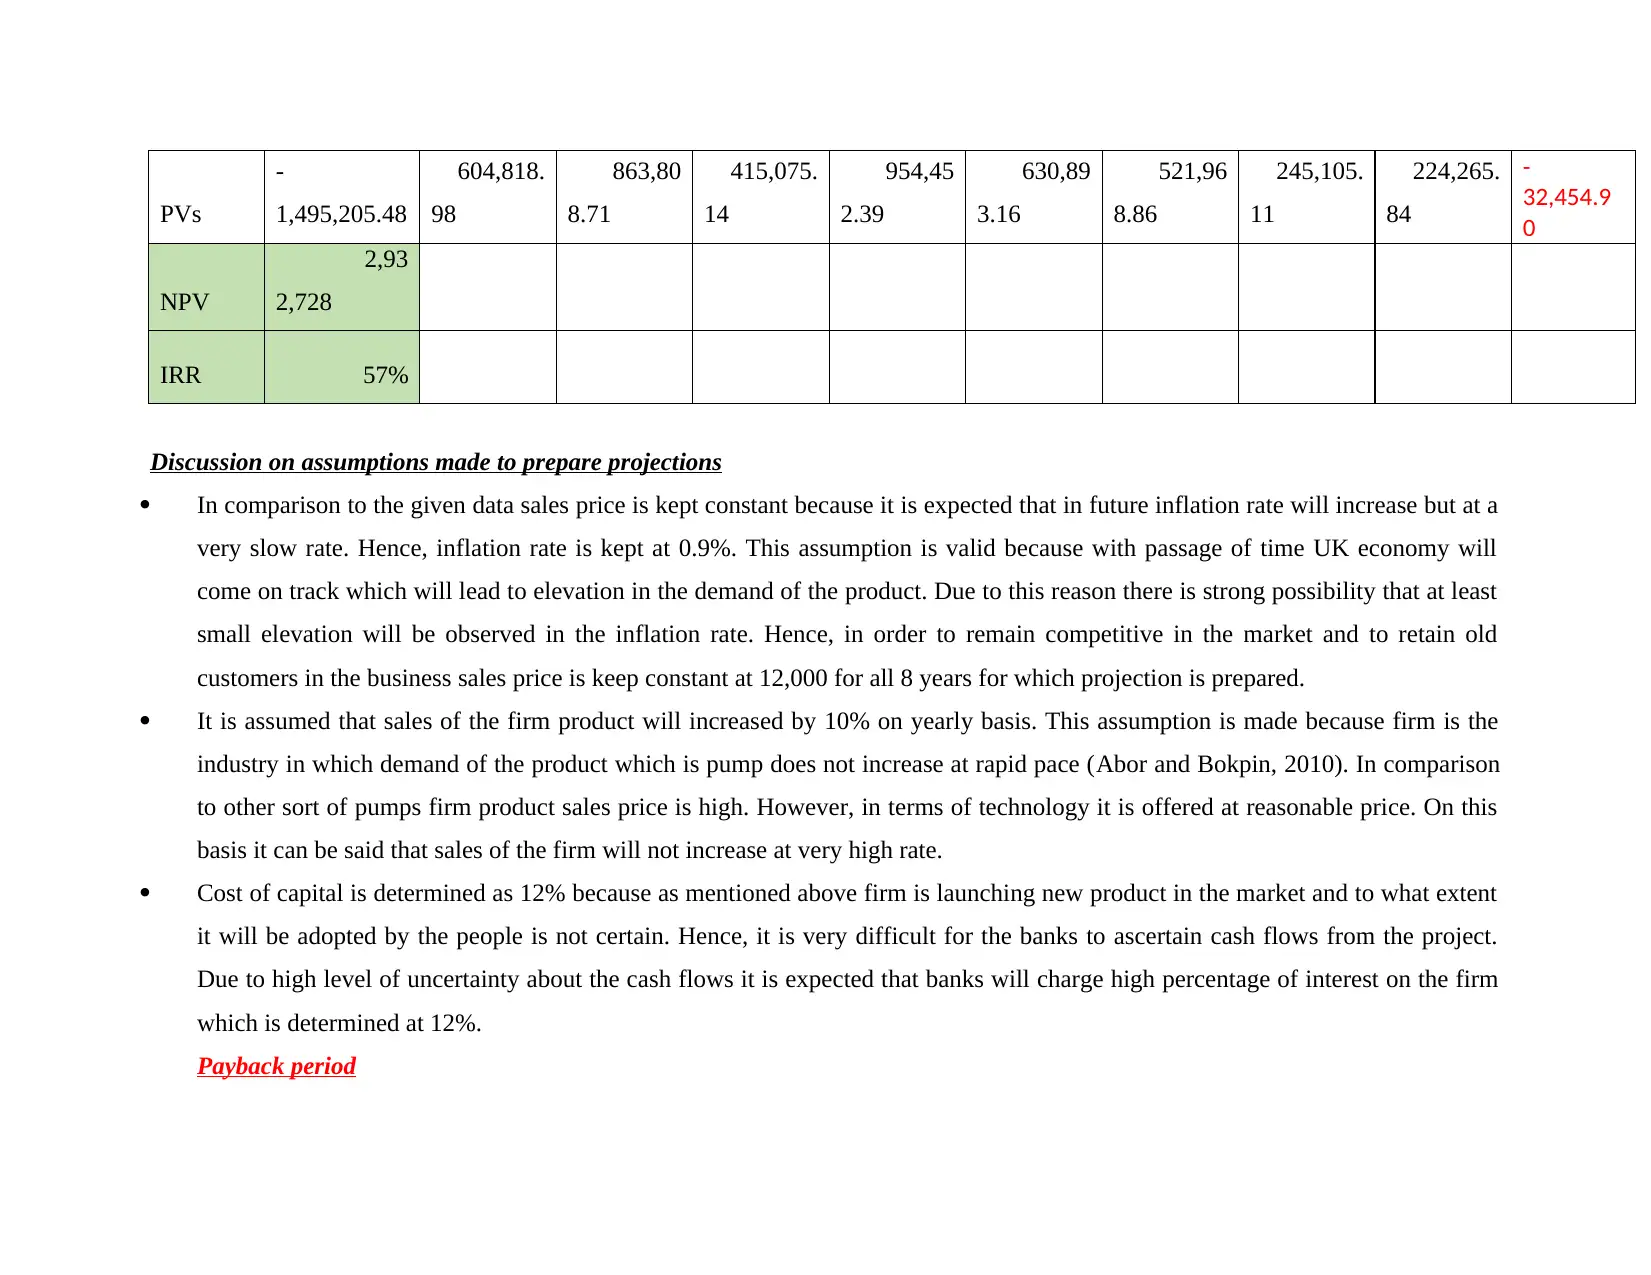
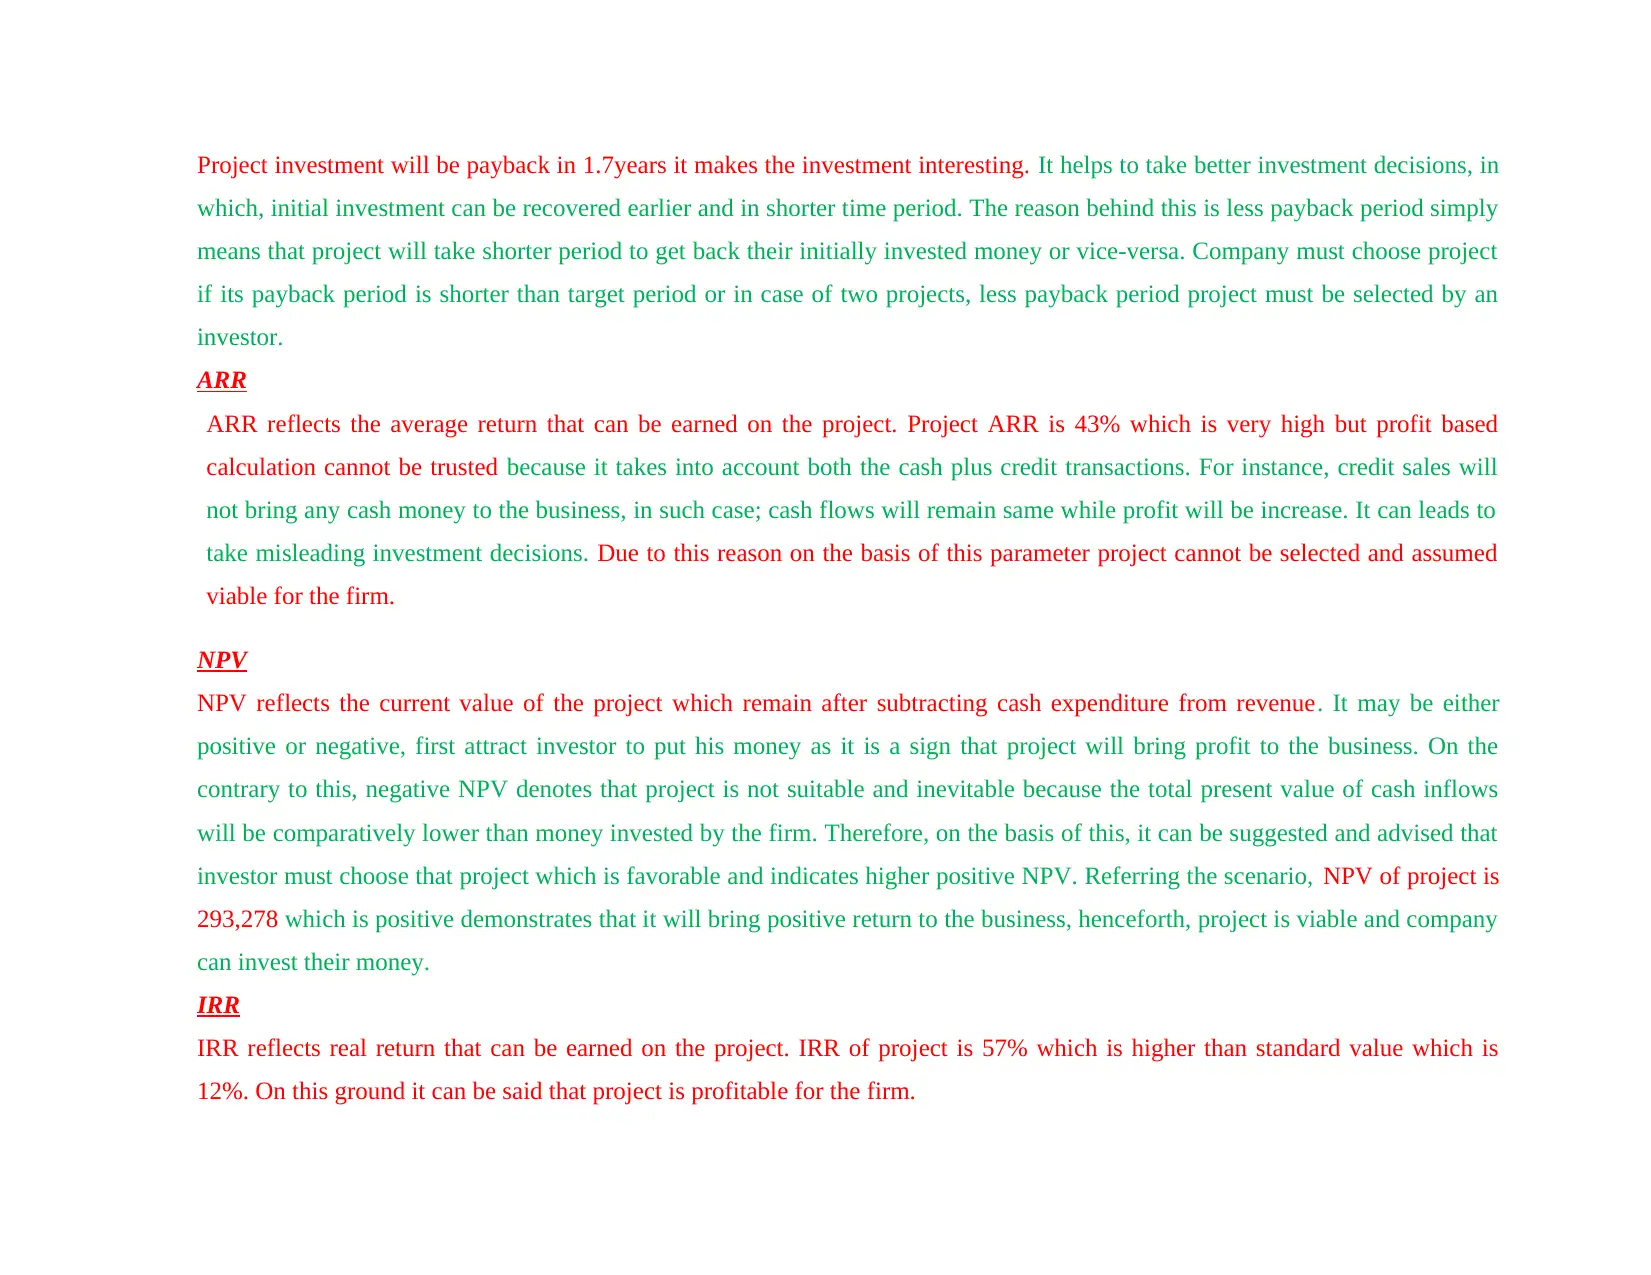
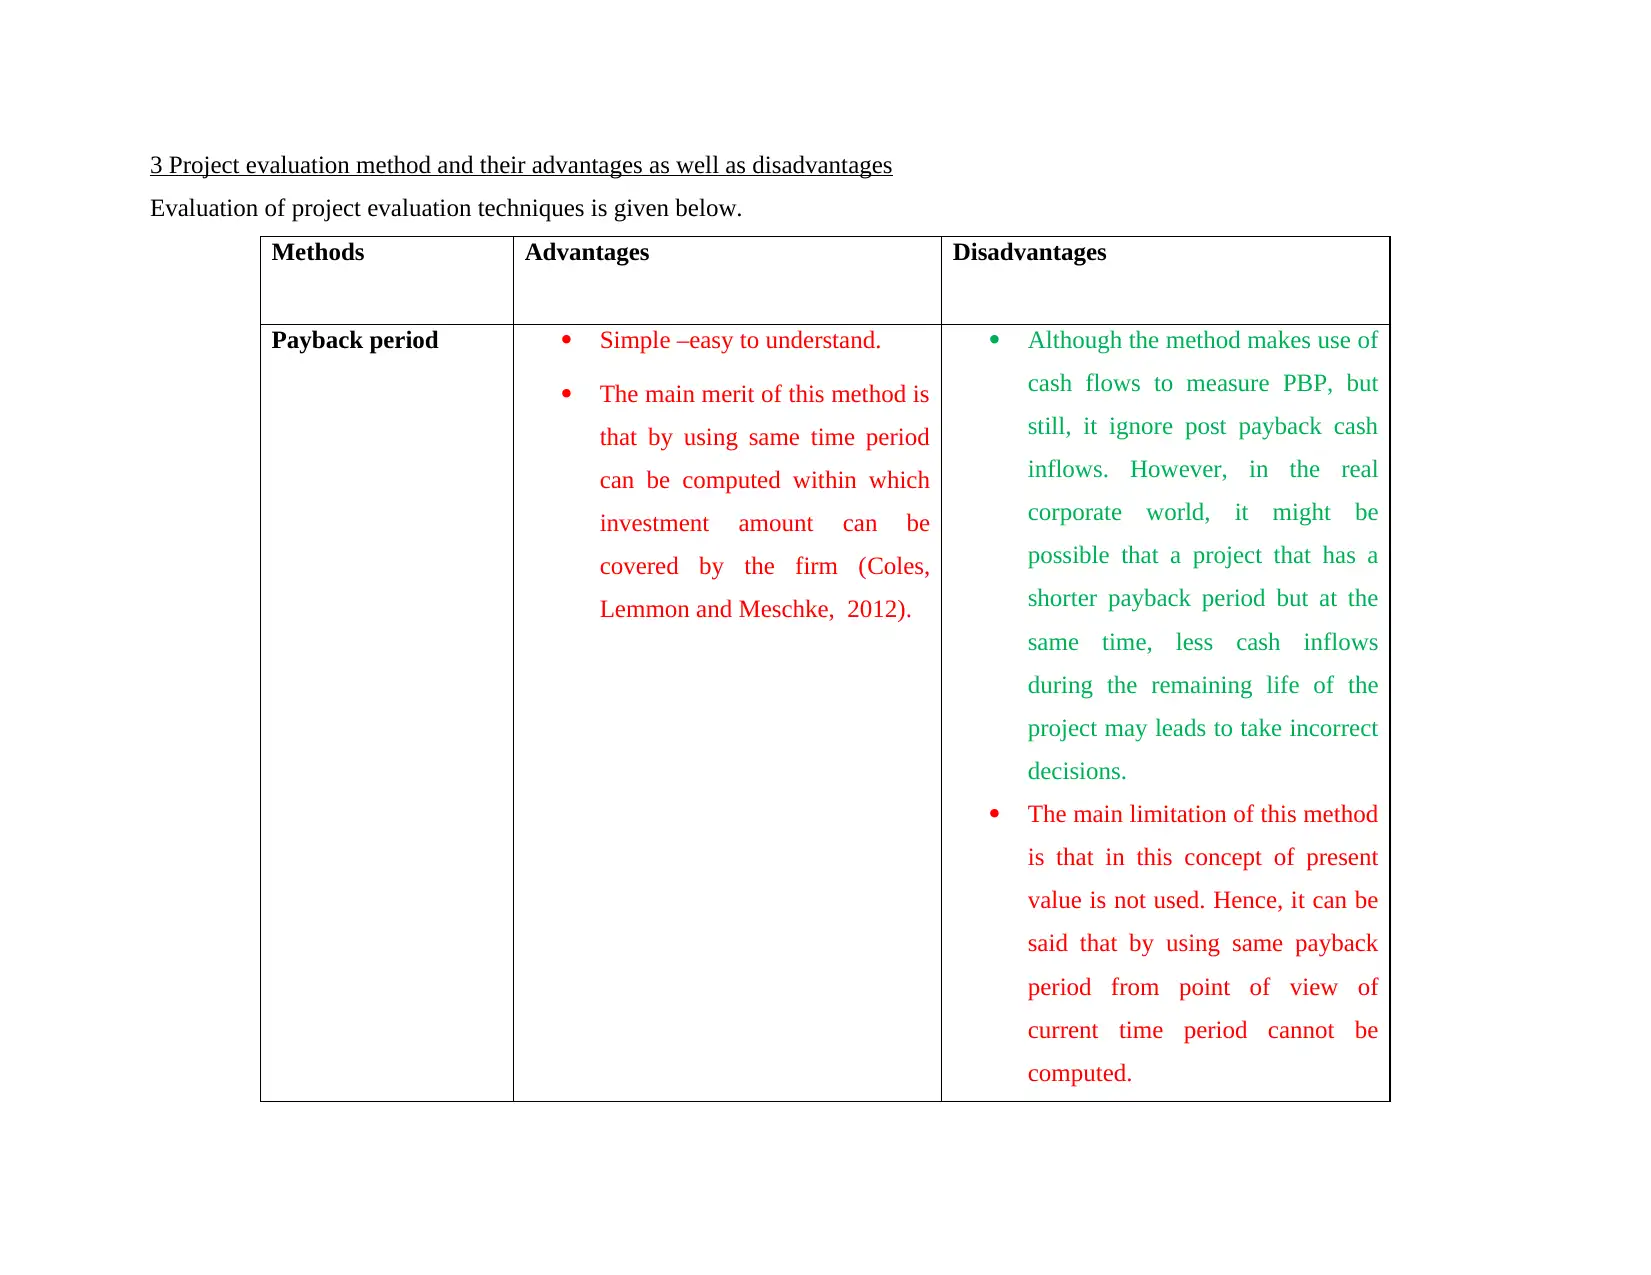
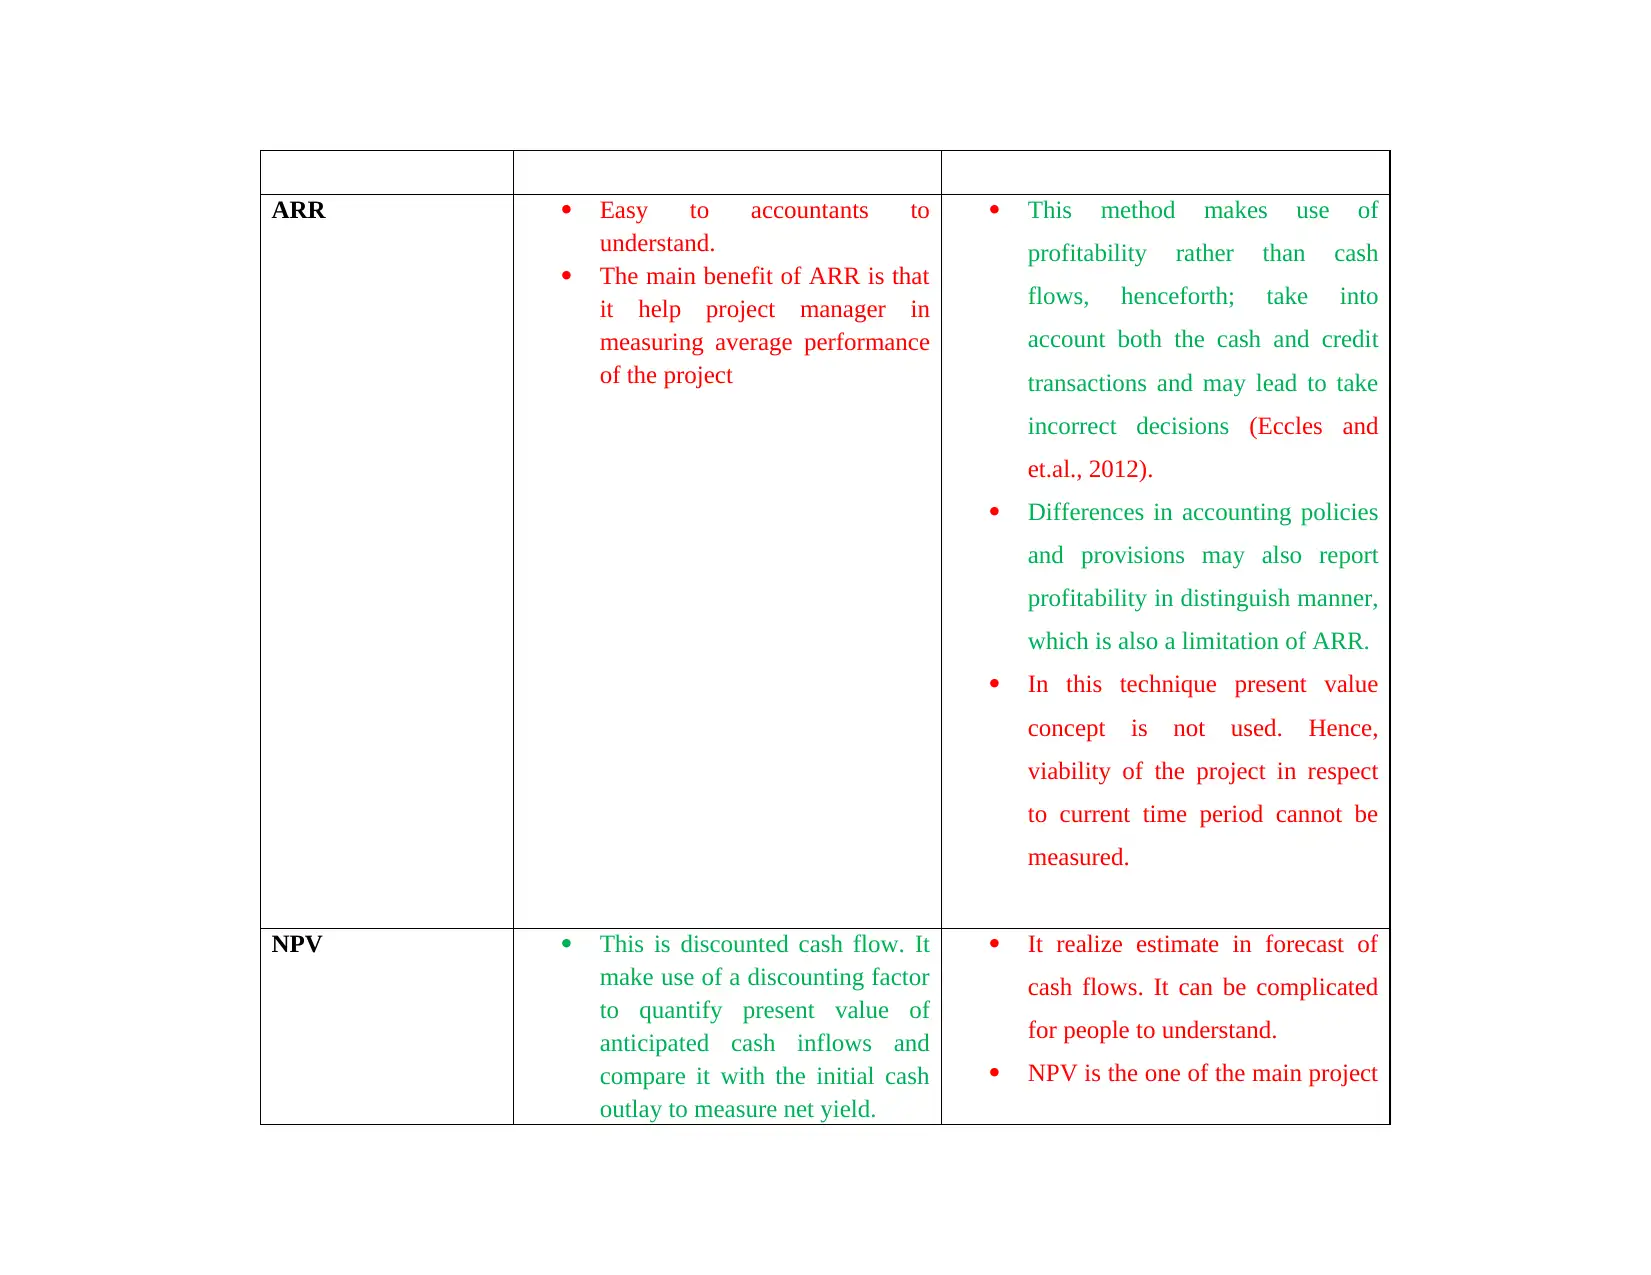
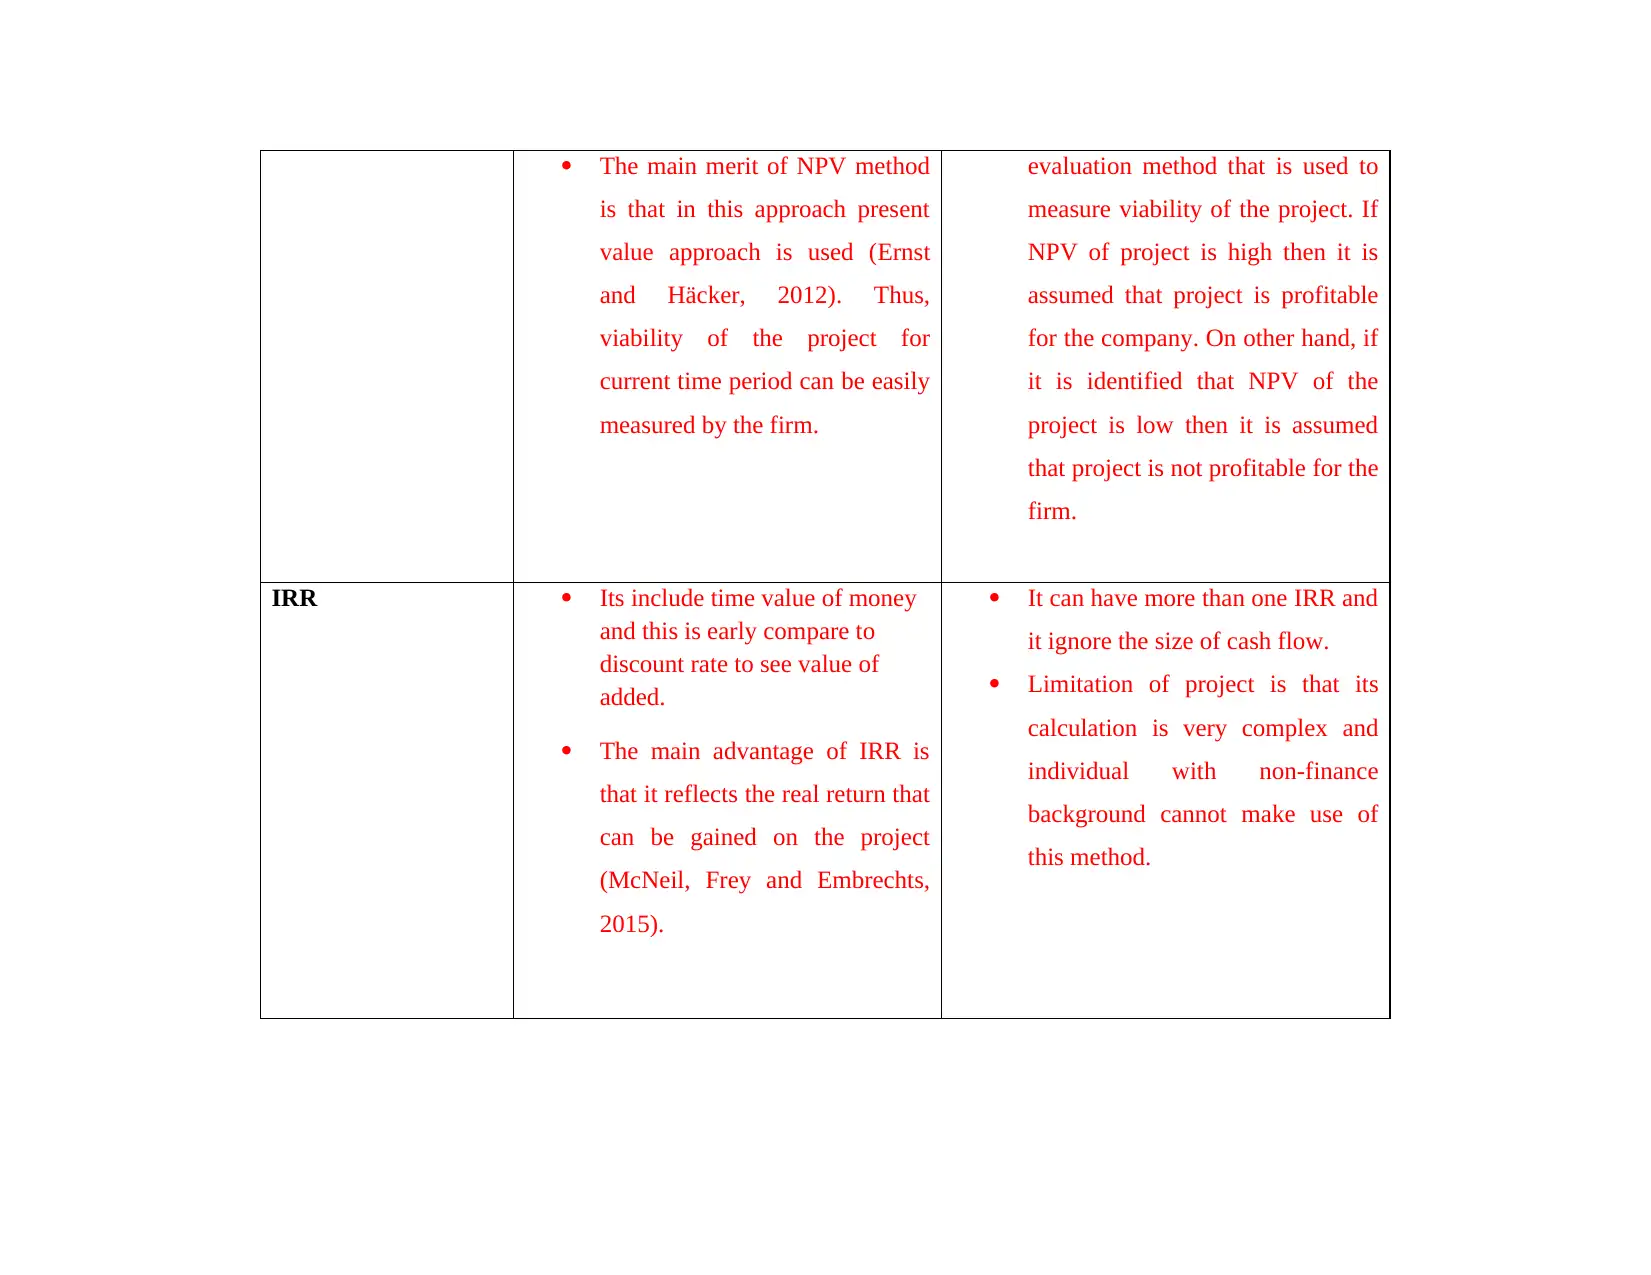
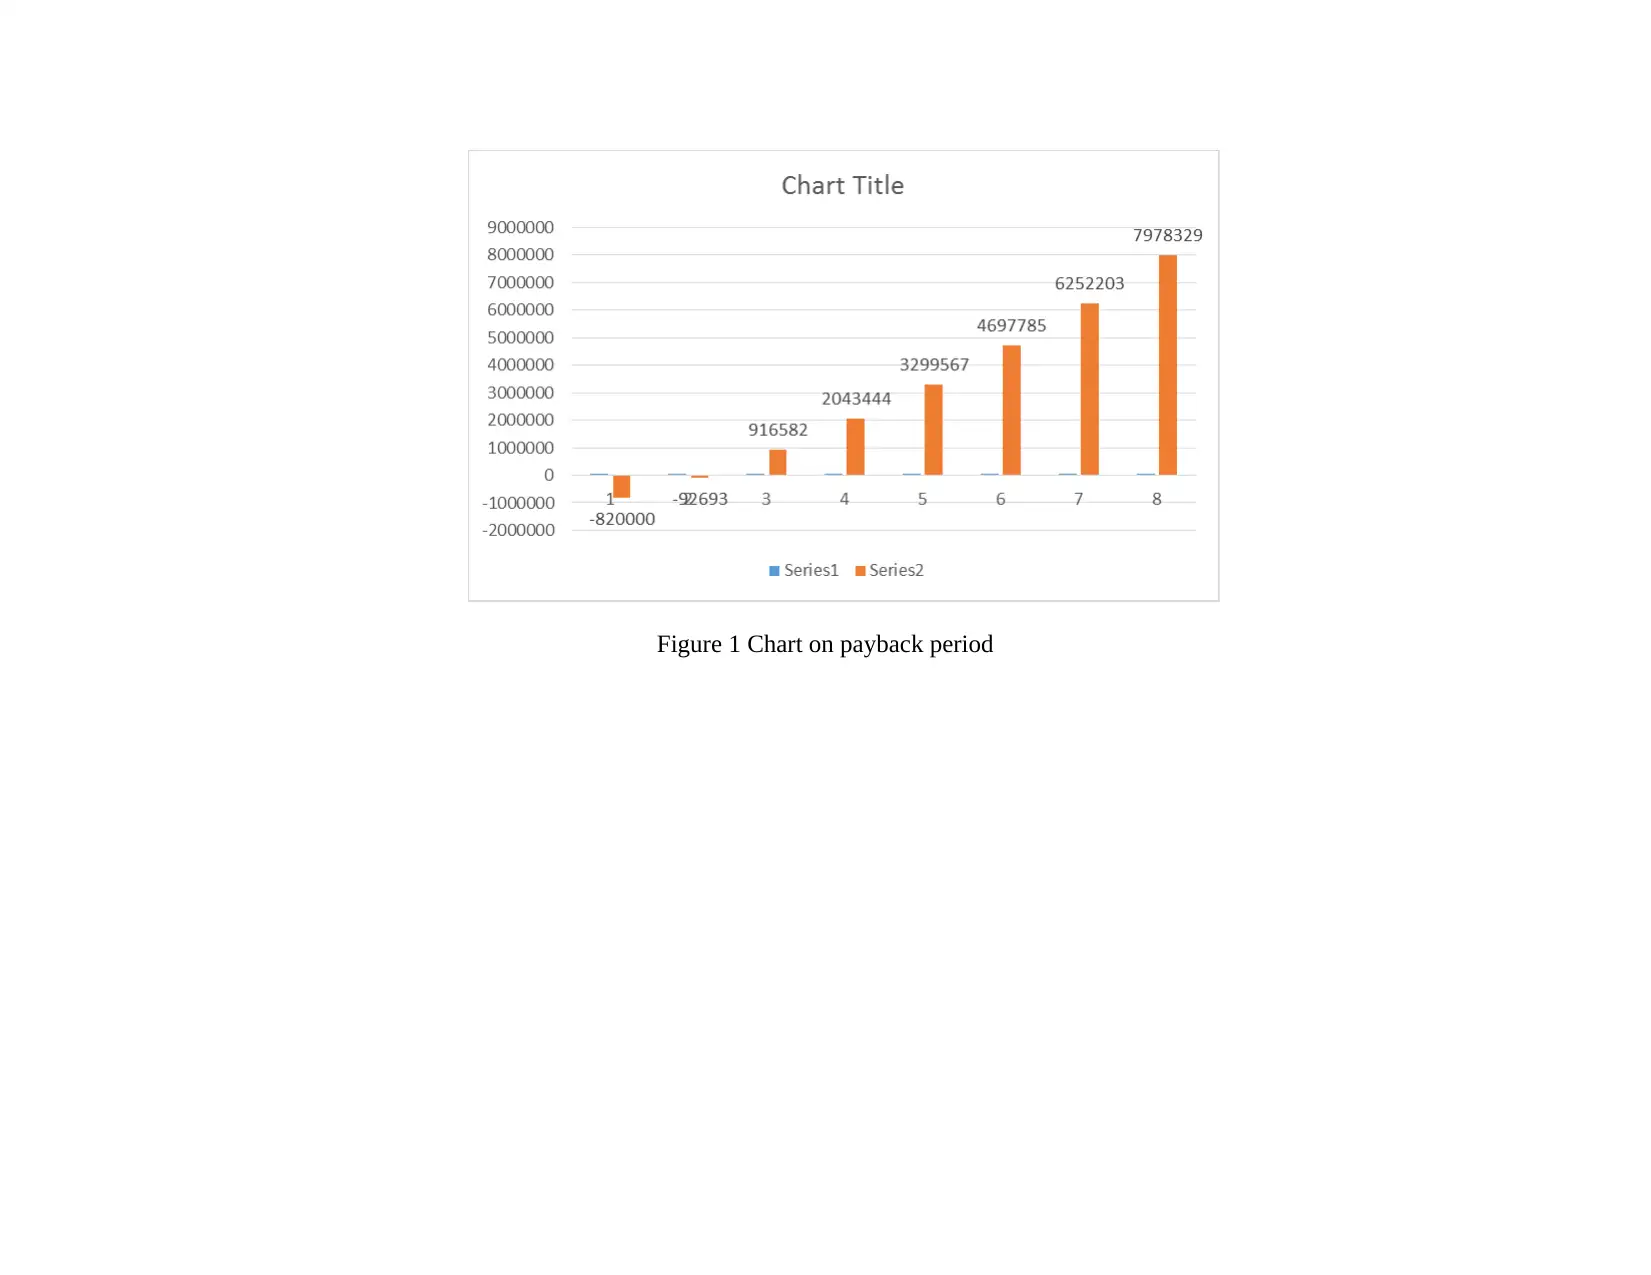
This report provides a comprehensive corporate finance analysis of the Wonder Pump project. It begins with an evaluation of potential investments, followed by assumptions on cash flow projections and a detailed discussion of various project evaluation methods, including payback period, average rate of return (ARR), Net Present Value (NPV), and Internal Rate of Return (IRR). The report then delves into sensitivity analysis, examining its impact on decisions, and assesses the effect of the discount rate on project viability. Furthermore, it covers capital structure considerations and concludes with a calculation of the weighted average cost of capital (WACC) and an analysis of its implications. The report includes tables and figures to support the financial analysis and provides a critical comparison of the project evaluation methods, highlighting the preference for NPV and IRR over payback period and ARR due to their consideration of the time value of money. Finally, the report includes several tables with calculations of payback period, ARR, NPV, IRR, sensitivity analysis of profit, CAPM, and enterprise value calculations.
Document Page
CORPORATE FINANCE
tabler-icon-diamond-filled.svg

Paraphrase This Document

Need a fresh take? Get an instant paraphrase of this document with our AI Paraphraser
Document Page
TABLE OF CONTENTS
INTRODUCTION...........................................................................................................................4
1 Evaluate potential investment...................................................................................................4
2 Assumptions on cash flow projection and discussion..............................................................6
3 Project evaluation method and their advantages as well as disadvantages.............................11
4 Sensitivity analysis and impact of results on decisions..........................................................13
5 Impact of discount rate on the project viability......................................................................17
6 Capital structure......................................................................................................................17
CONCLUSION..............................................................................................................................19
APPENDIX....................................................................................................................................20
(5)...................................................................................................................................................23
REFERENCES..............................................................................................................................26
Document Page
INTRODUCTION
Corporate finance is a vast field under which various things are covered. The report that is prepared will address issues of
investment appraisal for the Wonder pump. In this regard lots of things are done in the present study. In the present report, projections
about the cash flows are made and on that basis project evaluation methods are applied to the cash flows. Along with this, in the
report, sensitivity analysis is also done, and its impact on the firm decisions is discussed in detail (Thiberirge, and Beresford, 2015).
Detail discussion is carried out on the various project evaluation methods in a systematic way and their merits and demerits are
discussed in detail. At the end of the report, weighted average cost of capital is computed and comments are made on same. Along
with this, an impact of capital structure on the discount rate is also discussed briefly.
1 Evaluate potential investment
Particular 2012 2013 2014 2015 2016 2017 2018 2019 2020 2021
Volume (units) 200 300 500 600 500 400 250 150
Sales price 12,000 12,000
8
,000 8000 8000 8000 8000 8000
Sales
2,400,
000
3,600,
000
4,000,
000
4,800,
000
4,000,
000
3,200,
000
2,000,
000
1,200,
000
Cost of sale
5
,000
5
,000
5
,000
5
,000
5
,000
5
,000
5
,000
5
,000
Total cost of sale
-
1,000,000
-
1,500,000
-
2,500,000
-
3,000,000
-
2,500,000
-
2,000,000
-
1,250,000
-
750,000
Sub total
1,400,
000
2,100,
000
1,500,
000
1,800,
000
1,500,
000
1,200,
000
750,
000
450,
000
Document Page
Sales
representative -250,000 -250,000 -100,000 -100,000 -100,000 -100,000 -100,000 -100,000
Technical support -150,000 -150,000 -50,000 -50,000 -50,000 -50,000 -50,000 -50,000
Total(b)
1,000,
000
1,700,
000
1,350,
000
1,650,
000
1,350,
000
1,050,
000
600,
000
300,
000
Tax
-
300,000
-
510,000
-
405,000
-
495,000
-
405,000
-
315,000
-
180,000
-
90,000
Total operating
cash flow
1,000,
000
1,400,
000
840,
000
1,245,
000
855,
000
645,
000
285,
000
120,
000 -
90,000
Investment cash
inflow(capex) -800,000
Inventories(fg) -50,000 50,000
Inventories raw
materials -300,000 -450,000 -750,000 -900,000 -750,000 -600,000 -375,000 -225,000
Change -300,000 -150,000 -300,000 -150,000 150,000 150,000 225,000 150,000 225,000
Trade receivables
-
394,521
-
591,781
-
657,534
-
789,041
-
657,534
-
526,027
-
328,767
-
197,260
Change
-
394,521
-
197,260
-
65,753
-
131,507
131,
507
131,
507
197,
260
131,
507
197,
260
Trade payables 49,315
73
,973
123,
288
147,
945
123,
288
98
,630
61
,644
36
,986
Change 24 49 24 - - - - -
tabler-icon-diamond-filled.svg

Paraphrase This Document

Need a fresh take? Get an instant paraphrase of this document with our AI Paraphraser
Document Page
49,315 ,658 ,315 ,658 24,658 24,658 36,986 24,658 36,986
Net cash flows
-
1,495,205
677,
397
1,083,
562
583,
151
1,501,
849
1,111,
849
1,030,
274
541,
849
555,
274 -
90,000
It can be seen from the table that sales revenue of the firm is increasing from the FY 2013 to 16 from 2,400,000 to 4,800,000 (Roberts
and Whited, 2012). Thereafter, sales of the firm is declining consistently from 4,800,000 to 1,200,000. This reflects that there is a
huge fluctuation in the sales value of the variable (Damodaran, 2010). Most of the times sales revenue of the business firm is declining
which is not good for the business.
Some assumptions in brief are given below.
Inflation rate will be zero
Research and development cost already paid.
Document Page
2 Assumptions on cash flow projection and discussion
Payback
period
Year 2012 2013 2014 2015 2016 2017 2018 2019 2020 2021
Net cash flow
-
1,495,205
67
7,397
1,08
3,562
58
3,151
1,50
1,849
1,11
1,849
1,03
0,274
541,
849
555,
274
-
90,000
Cumulative
cash flow
-
1,495,205
-
817,808
26
5,753
84
8,904
2,35
0,753
3,46
2,603
4,49
2,877
5,034,
726
5,590,
000
1 year
Payback period 0.75
1.75
ARR
Total profit
5,0
90,000
Number of year 8
Average profit
6
36,250
Total
investment
1,4
95,205
ARR 43%
Year 2012 2013 2014 2015 2016 2017 2018 2019 2020 2021
NPV
-
1,495,205
677,3
97
1,083
,562
583,1
51
1,501
,849
1,111
,849
1,030
,274
541,8
49
555,2
74 -
90,000
Discount
factors 1
0.8
93 0.797
0.7
12 0.636 0.567 0.507
0.4
52
0.4
04 0.3
61
Document Page
PVs
-
1,495,205.48
604,818.
98
863,80
8.71
415,075.
14
954,45
2.39
630,89
3.16
521,96
8.86
245,105.
11
224,265.
84
-
32,454.9
0
NPV
2,93
2,728
IRR 57%
Discussion on assumptions made to prepare projections
In comparison to the given data sales price is kept constant because it is expected that in future inflation rate will increase but at a
very slow rate. Hence, inflation rate is kept at 0.9%. This assumption is valid because with passage of time UK economy will
come on track which will lead to elevation in the demand of the product. Due to this reason there is strong possibility that at least
small elevation will be observed in the inflation rate. Hence, in order to remain competitive in the market and to retain old
customers in the business sales price is keep constant at 12,000 for all 8 years for which projection is prepared.
It is assumed that sales of the firm product will increased by 10% on yearly basis. This assumption is made because firm is the
industry in which demand of the product which is pump does not increase at rapid pace (Abor and Bokpin, 2010). In comparison
to other sort of pumps firm product sales price is high. However, in terms of technology it is offered at reasonable price. On this
basis it can be said that sales of the firm will not increase at very high rate.
Cost of capital is determined as 12% because as mentioned above firm is launching new product in the market and to what extent
it will be adopted by the people is not certain. Hence, it is very difficult for the banks to ascertain cash flows from the project.
Due to high level of uncertainty about the cash flows it is expected that banks will charge high percentage of interest on the firm
which is determined at 12%.
Payback period
tabler-icon-diamond-filled.svg

Paraphrase This Document

Need a fresh take? Get an instant paraphrase of this document with our AI Paraphraser
Document Page
Project investment will be payback in 1.7years it makes the investment interesting. It helps to take better investment decisions, in
which, initial investment can be recovered earlier and in shorter time period. The reason behind this is less payback period simply
means that project will take shorter period to get back their initially invested money or vice-versa. Company must choose project
if its payback period is shorter than target period or in case of two projects, less payback period project must be selected by an
investor.
ARR
ARR reflects the average return that can be earned on the project. Project ARR is 43% which is very high but profit based
calculation cannot be trusted because it takes into account both the cash plus credit transactions. For instance, credit sales will
not bring any cash money to the business, in such case; cash flows will remain same while profit will be increase. It can leads to
take misleading investment decisions. Due to this reason on the basis of this parameter project cannot be selected and assumed
viable for the firm.
NPV
NPV reflects the current value of the project which remain after subtracting cash expenditure from revenue. It may be either
positive or negative, first attract investor to put his money as it is a sign that project will bring profit to the business. On the
contrary to this, negative NPV denotes that project is not suitable and inevitable because the total present value of cash inflows
will be comparatively lower than money invested by the firm. Therefore, on the basis of this, it can be suggested and advised that
investor must choose that project which is favorable and indicates higher positive NPV. Referring the scenario, NPV of project is
293,278 which is positive demonstrates that it will bring positive return to the business, henceforth, project is viable and company
can invest their money.
IRR
IRR reflects real return that can be earned on the project. IRR of project is 57% which is higher than standard value which is
12%. On this ground it can be said that project is profitable for the firm.
Document Page
3 Project evaluation method and their advantages as well as disadvantages
Evaluation of project evaluation techniques is given below.
Methods Advantages Disadvantages
Payback period Simple –easy to understand.
The main merit of this method is
that by using same time period
can be computed within which
investment amount can be
covered by the firm (Coles,
Lemmon and Meschke, 2012).
Although the method makes use of
cash flows to measure PBP, but
still, it ignore post payback cash
inflows. However, in the real
corporate world, it might be
possible that a project that has a
shorter payback period but at the
same time, less cash inflows
during the remaining life of the
project may leads to take incorrect
decisions.
The main limitation of this method
is that in this concept of present
value is not used. Hence, it can be
said that by using same payback
period from point of view of
current time period cannot be
computed.
Document Page
ARR Easy to accountants to
understand.
The main benefit of ARR is that
it help project manager in
measuring average performance
of the project
This method makes use of
profitability rather than cash
flows, henceforth; take into
account both the cash and credit
transactions and may lead to take
incorrect decisions (Eccles and
et.al., 2012).
Differences in accounting policies
and provisions may also report
profitability in distinguish manner,
which is also a limitation of ARR.
In this technique present value
concept is not used. Hence,
viability of the project in respect
to current time period cannot be
measured.
NPV This is discounted cash flow. It
make use of a discounting factor
to quantify present value of
anticipated cash inflows and
compare it with the initial cash
outlay to measure net yield.
It realize estimate in forecast of
cash flows. It can be complicated
for people to understand.
NPV is the one of the main project
tabler-icon-diamond-filled.svg

Paraphrase This Document

Need a fresh take? Get an instant paraphrase of this document with our AI Paraphraser
Document Page
The main merit of NPV method
is that in this approach present
value approach is used (Ernst
and Häcker, 2012). Thus,
viability of the project for
current time period can be easily
measured by the firm.
evaluation method that is used to
measure viability of the project. If
NPV of project is high then it is
assumed that project is profitable
for the company. On other hand, if
it is identified that NPV of the
project is low then it is assumed
that project is not profitable for the
firm.
IRR Its include time value of money
and this is early compare to
discount rate to see value of
added.
The main advantage of IRR is
that it reflects the real return that
can be gained on the project
(McNeil, Frey and Embrechts,
2015).
It can have more than one IRR and
it ignore the size of cash flow.
Limitation of project is that its
calculation is very complex and
individual with non-finance
background cannot make use of
this method.
Document Page
Figure 1 Chart on payback period
chevron_up_icon
1 out of 34
circle_padding
hide_on_mobile
zoom_out_icon
[object Object]