Financial Report and Analysis of Wonderland Construction Supplies 2017
VerifiedAdded on  2020/04/07
|12
|1417
|75
Report
AI Summary
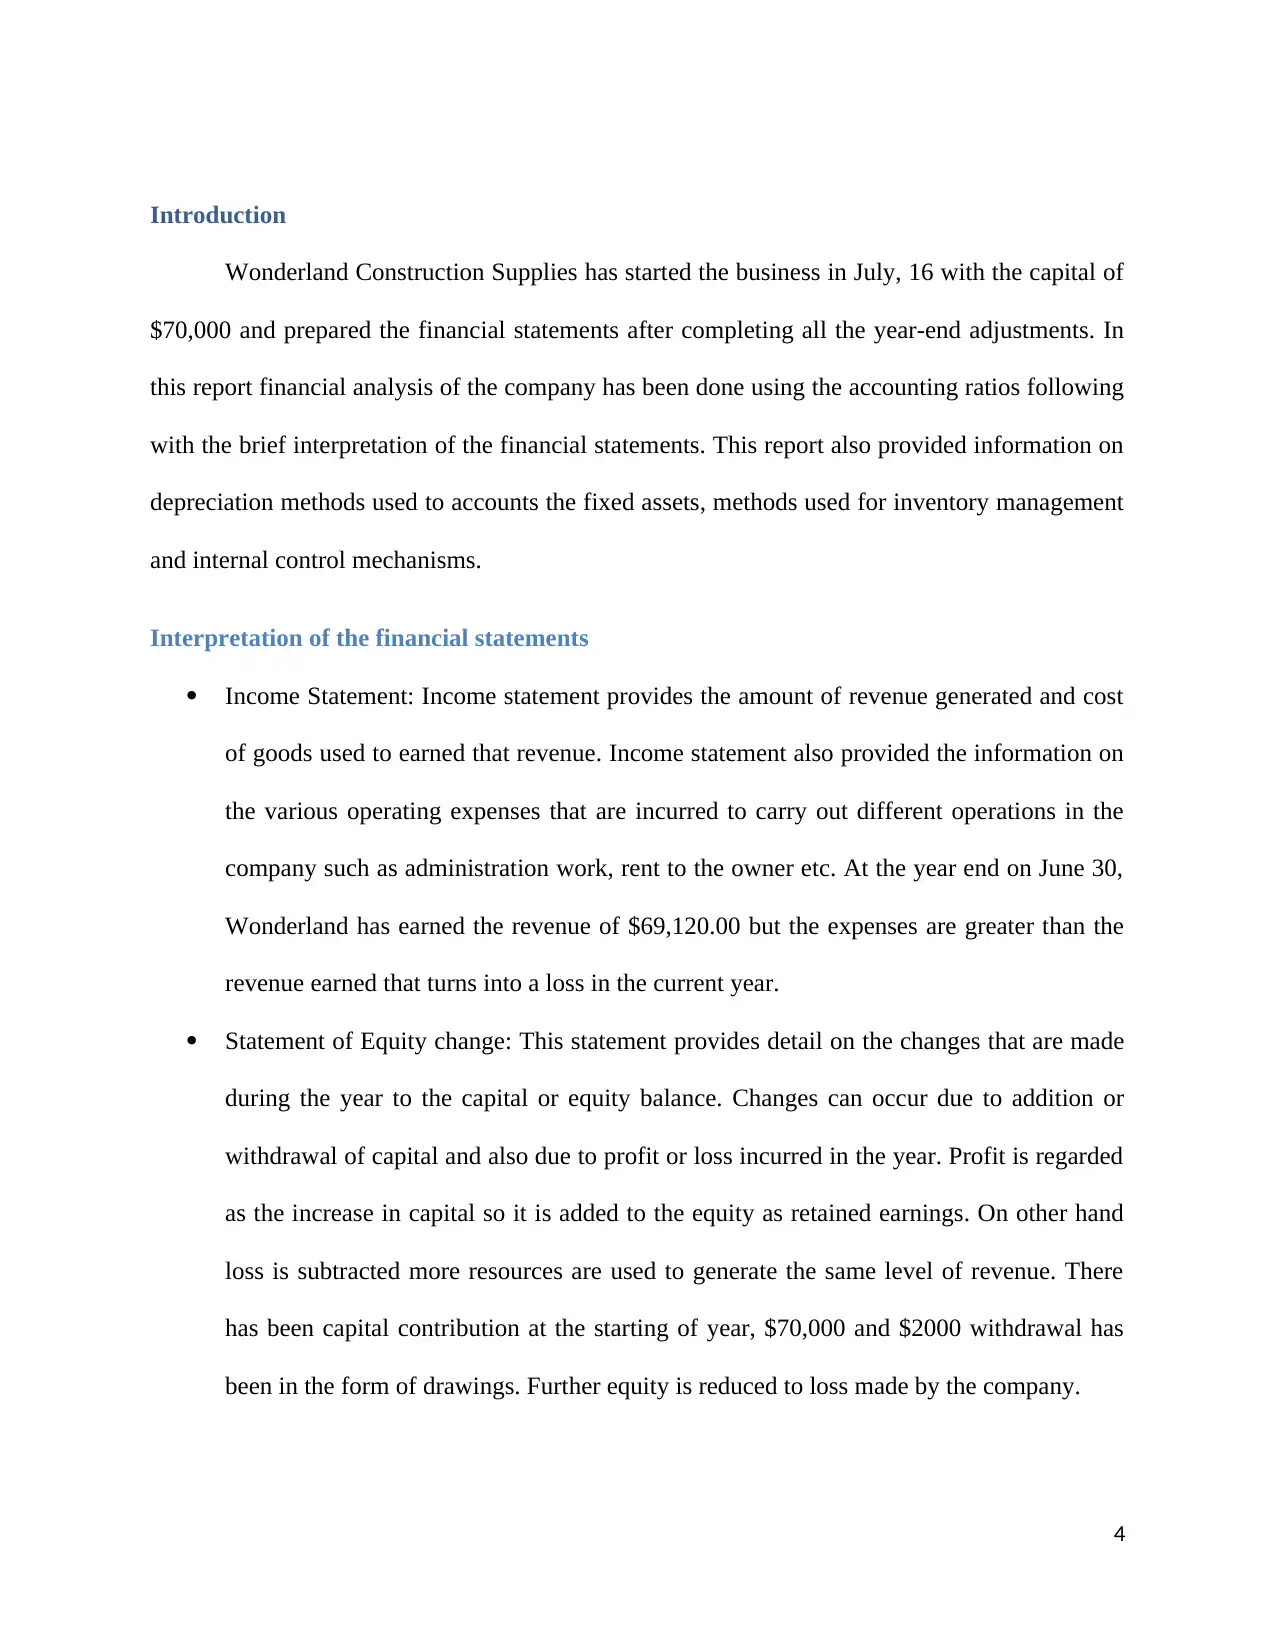
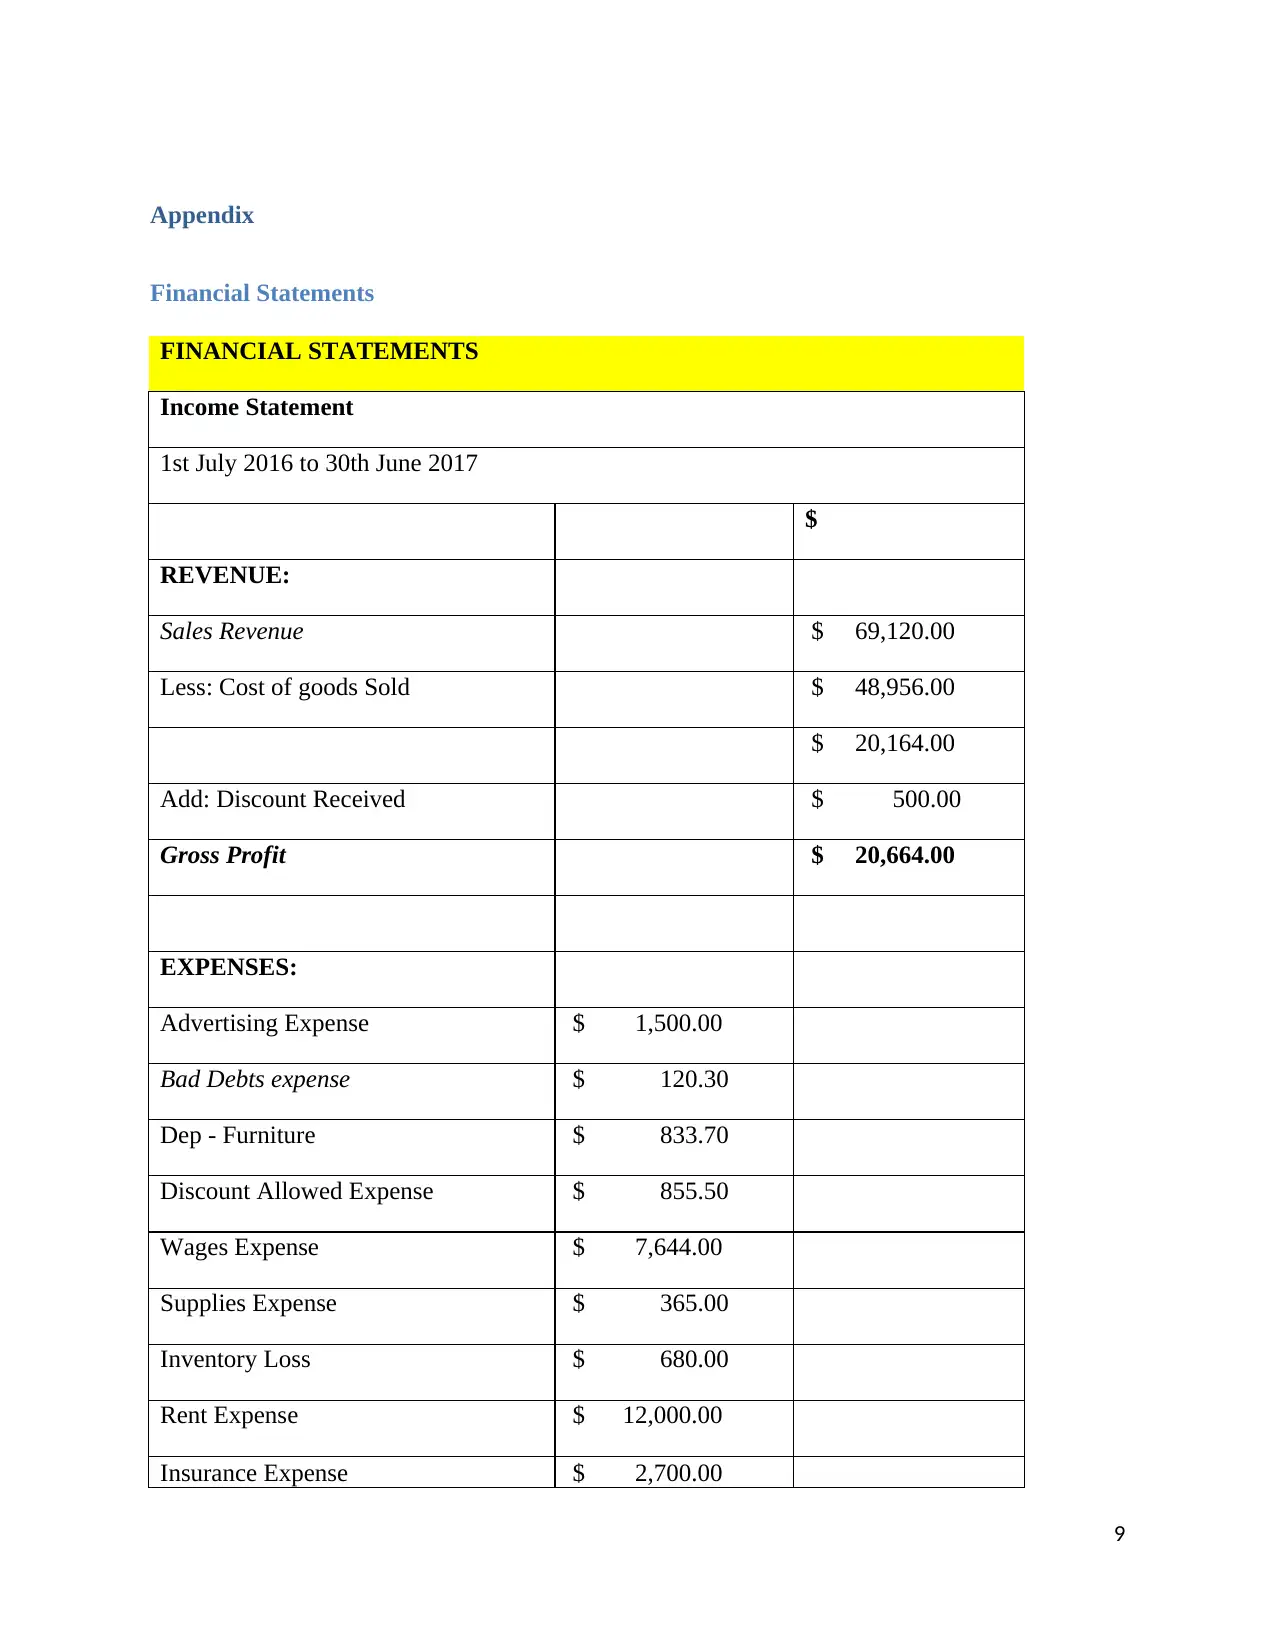
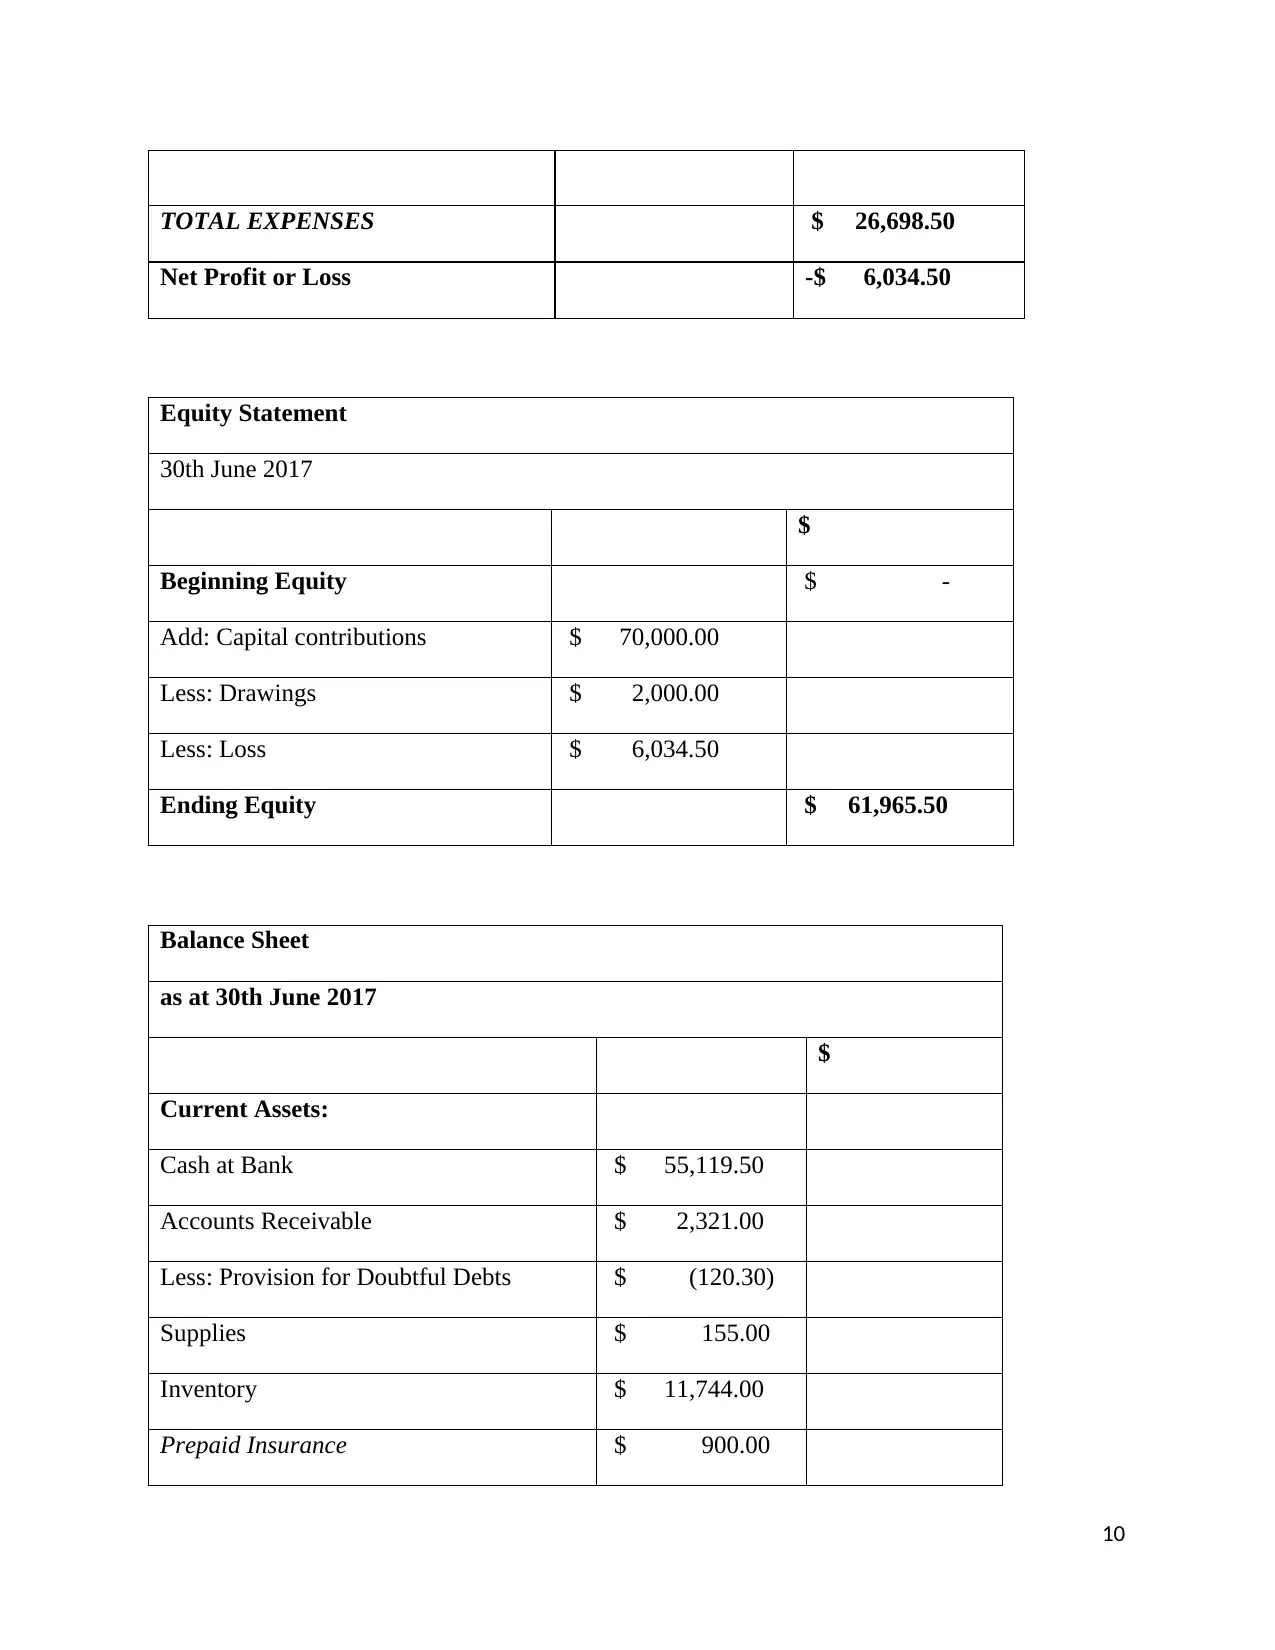
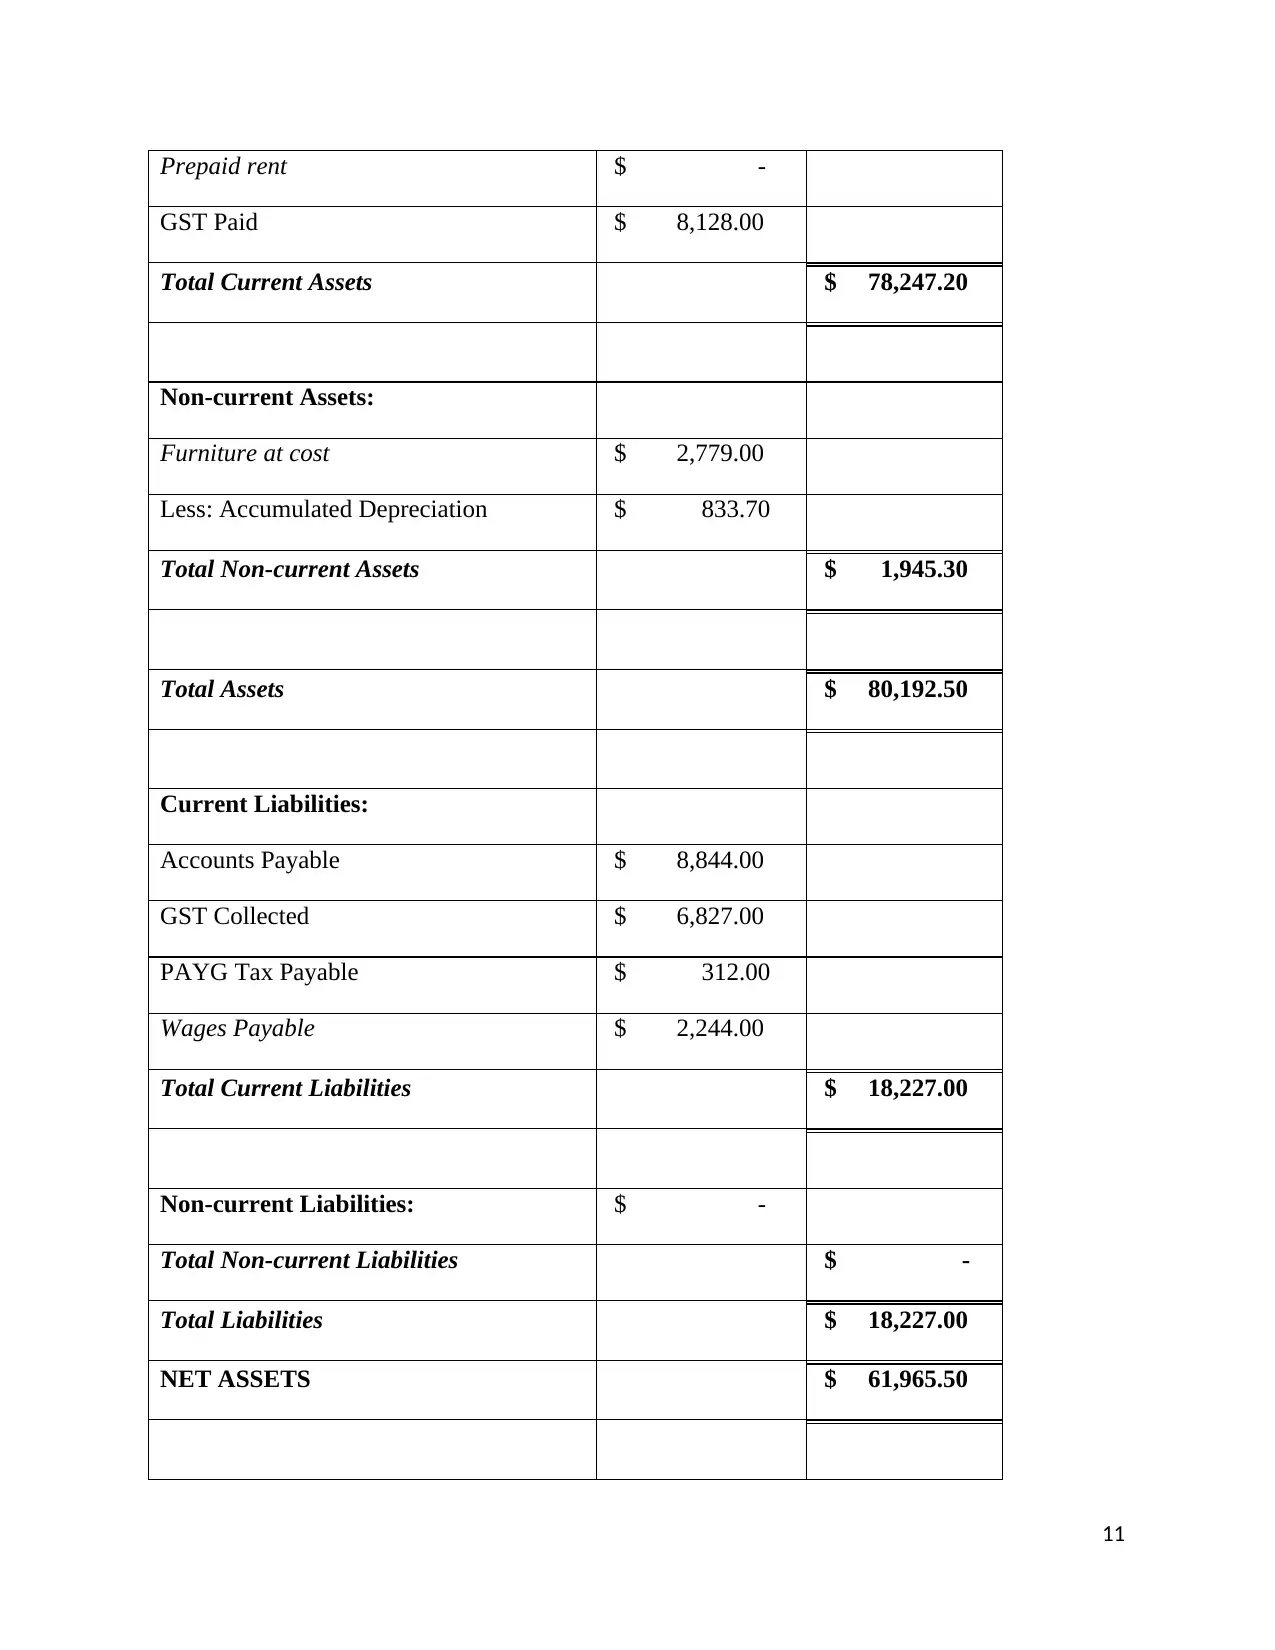
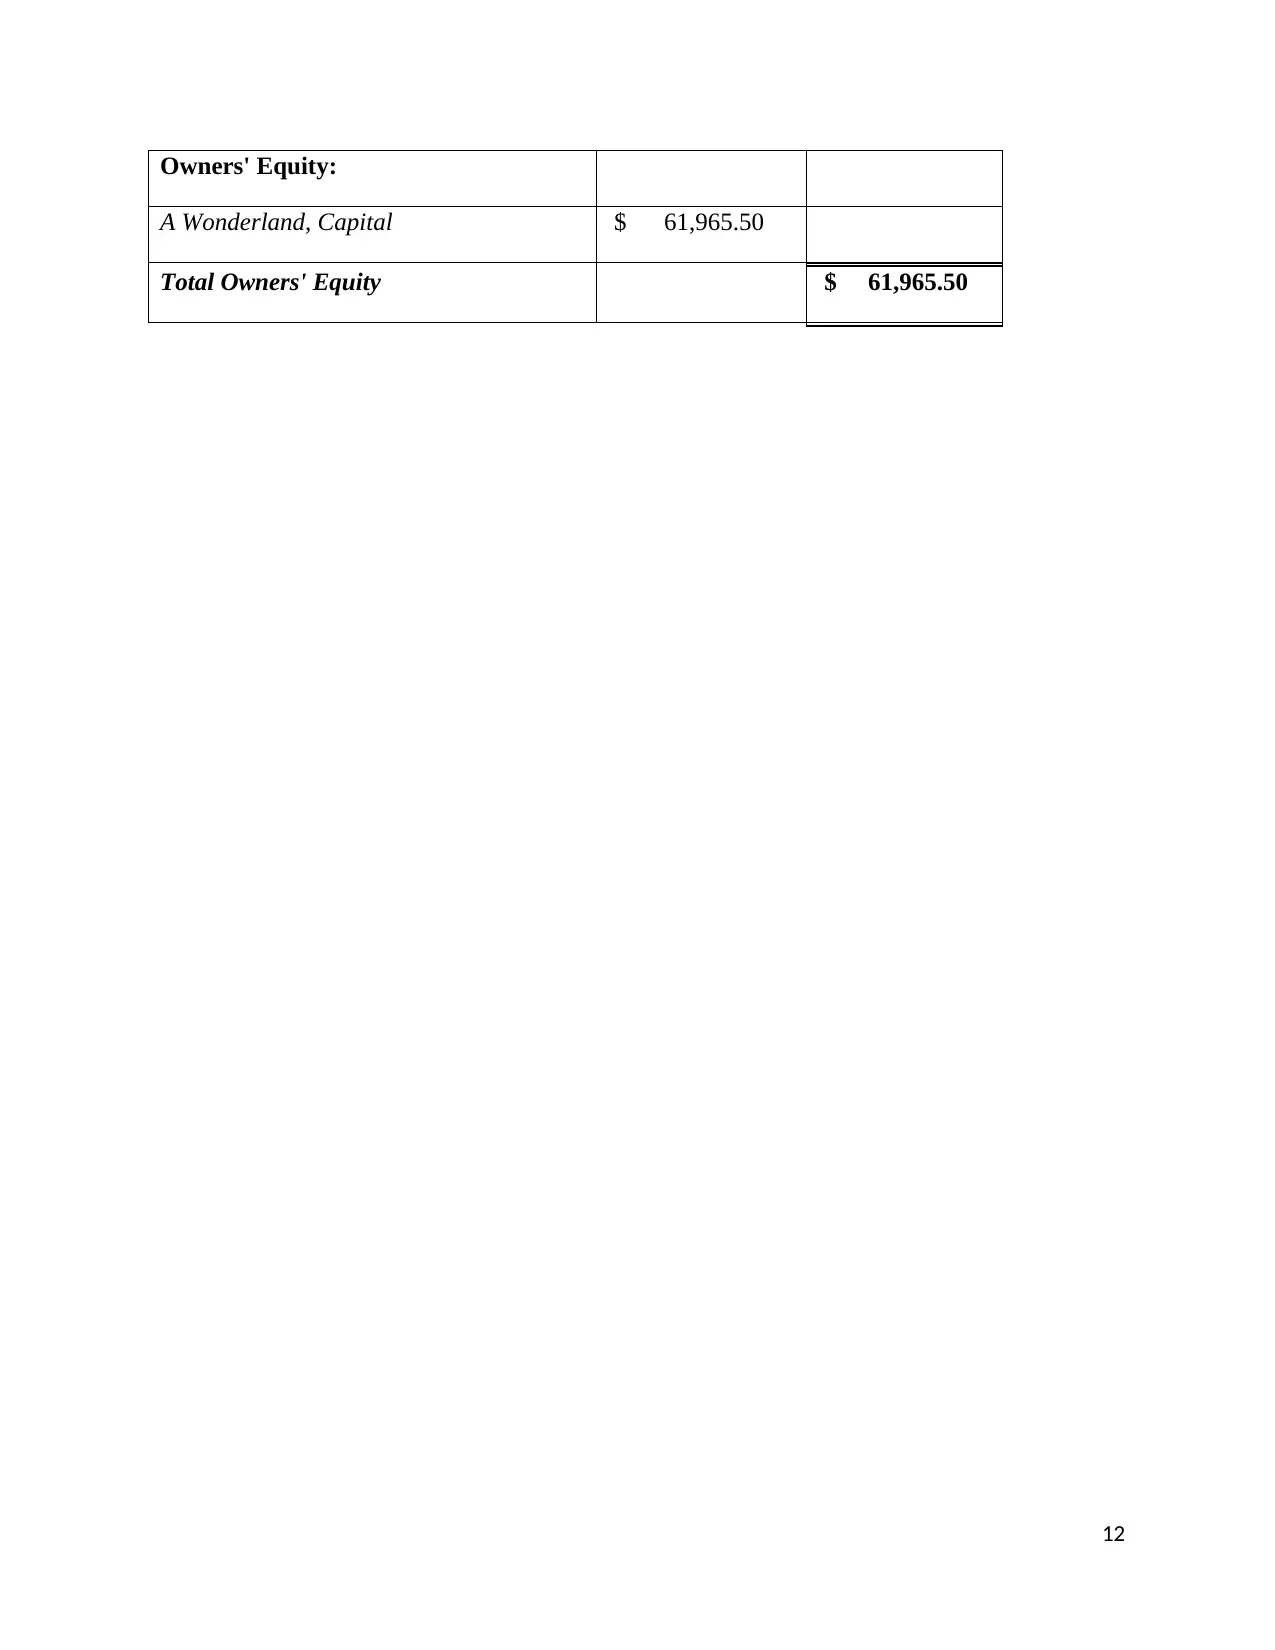
This financial report presents an analysis of Wonderland Construction Supplies' financial performance for the year 2017. The report begins with an executive summary and an introduction to the company, which started its business in July 2016. It includes an interpretation of the company's income statement, statement of equity change, and balance sheet. The analysis extends to the calculation and interpretation of key financial ratios, such as the current ratio and gross profit ratio, comparing them to industry competitors. Furthermore, the report outlines different depreciation methods, including the straight-line and reducing balance methods, and discusses inventory management techniques like FIFO and LIFO. It also touches upon internal control mechanisms, such as bank reconciliation statements and petty cash registers. The report concludes with recommendations for the company and includes the financial statements in the appendix. The report indicates the company's loss in the first year of business but suggests potential for future growth, and recommends the company to look after the sales price of goods and also to decrease the cost through applying various cost reducing methods.

Financial Report
Wonderland Construction Supplies
1
Wonderland Construction Supplies
1
Paraphrase This Document
Need a fresh take? Get an instant paraphrase of this document with our AI Paraphraser

Executive Summary
Financial analysis is most important to understand the true interpretation of the financial
statements. In this report financial analysis of the Wonderland Construction Supplies Company
has been carried out from the prepared financial statement for year 2017. This report will guide
to the comparison of selected company with their competitor. Various other accounting methods
are explained that are helpful to do accounting process.
2

Contents
Executive Summary.........................................................................................................................2
Introduction......................................................................................................................................4
Interpretation of the financial statements.....................................................................................4
Financial Ratios............................................................................................................................4
Depreciation Methods..................................................................................................................5
Inventory Management Method...................................................................................................6
Internal control mechanisms........................................................................................................6
Conclusion.......................................................................................................................................6
References........................................................................................................................................7
Appendix..........................................................................................................................................8
Financial Statements....................................................................................................................8
3
⊘ This is a preview!⊘
Do you want full access?
Subscribe today to unlock all pages.

Trusted by 1+ million students worldwide

Introduction
Wonderland Construction Supplies has started the business in July, 16 with the capital of
$70,000 and prepared the financial statements after completing all the year-end adjustments. In
this report financial analysis of the company has been done using the accounting ratios following
with the brief interpretation of the financial statements. This report also provided information on
depreciation methods used to accounts the fixed assets, methods used for inventory management
and internal control mechanisms.
Interpretation of the financial statements
ï‚· Income Statement: Income statement provides the amount of revenue generated and cost
of goods used to earned that revenue. Income statement also provided the information on
the various operating expenses that are incurred to carry out different operations in the
company such as administration work, rent to the owner etc. At the year end on June 30,
Wonderland has earned the revenue of $69,120.00 but the expenses are greater than the
revenue earned that turns into a loss in the current year.
ï‚· Statement of Equity change: This statement provides detail on the changes that are made
during the year to the capital or equity balance. Changes can occur due to addition or
withdrawal of capital and also due to profit or loss incurred in the year. Profit is regarded
as the increase in capital so it is added to the equity as retained earnings. On other hand
loss is subtracted more resources are used to generate the same level of revenue. There
has been capital contribution at the starting of year, $70,000 and $2000 withdrawal has
been in the form of drawings. Further equity is reduced to loss made by the company.
4
Paraphrase This Document
Need a fresh take? Get an instant paraphrase of this document with our AI Paraphraser

ï‚· Balance Sheet: This statement shows the year-end balances of all the assets and liabilities
that company owns at the balance sheet date. It contains value of different current assets,
non-current assets, current liabilities, non-current liabilities and shareholder’s equity. It
shows how balances of assets meet with the balances of the liabilities and equity capital
(Bull, 2007).
Financial Ratios
Current Ratio: Current ratio helps to measure the liquidity of the company as it shows current
assets divided by the current liabilities. It provides times the current assets the company has to
pay its short term liabilities.
Formula: Current Assets/Current Liabilities
Current ratio of Wonderland: $78,247.20/ $18,227.00 = 4.29 times
Current ratio of competitor: 1.5 times to 2.7 times
Current ratio of the Wonderland Company is far better than the current ratio of its competitors as
company has more than 4 times the current assets to pay the short term liabilities as compare to
1.5 to 2.7 times of their competitors.
Gross Profit Ratio: This ratio measures the percentage of gross profit earned by the company.
Gross profit is sales revenue less cost of goods sold.
Formula: Gross Profit/Sales Revenue *100
Gross profit of Wonderland: $20,664.00/ $69,120.00 = 29.90%
Gross profit of competitor: 38% to 43%
5

The gross profit percentage of the competitor is much better than the gross profit percentage of
the company (Drake and Fabozzi, 2012).
Depreciation Methods
There are mainly two important depreciation methods available. They are:
ï‚· Straight line method: In this method, depreciation is charged over the useful of life of
assets. Any salvage value of assets is subtracted from the cost of machine and remaining
value of assets is depreciated equally over the useful life of assets. The major benefit of
this method is that same portion of deprecation has to be charged to profit and loss
account, therefore easy to calculate.
ï‚· Reducing Balance Method: This method is also known as written down value method as
in this case depreciation is charged on the value of assets that is remained after charging
the each year depreciation. A fixed percentage of depreciation is charged to the value of
asset until the assets is sold or write off from the balance sheet. Every year calculation
needs to be done to calculate the depreciation (Fridson and Alvarez, 2011).
Inventory Management Method
There are two more methods used to value the inventory other than weighted average method:
ï‚· FIFO (First in First out): In this method goods that are first purchased will be sold first
and so on. Under this method value of inventory at the balance sheet date might increase
as it is lower value inventory is sold first as comparison or high value inventory. It is
assumed that company has paid more for buying the inventory as the business progress.
ï‚· LIFO (Last in Last out): In this method goods that are last brought will be sold first and
so on. It is will decrease the value of inventory at the balance date (Bull, 2007).
6
⊘ This is a preview!⊘
Do you want full access?
Subscribe today to unlock all pages.

Trusted by 1+ million students worldwide

Internal control mechanisms
Internal control mechanism helps to put control on the misuse of resources like bank
reconciliation statement provides the difference of balances in bank passbook and bank account
in general ledger. Other internal control mechanisms are petty cash register to record the
expenses made small expenses occurred on daily basis (Fridson and Alvarez, 2011).
Conclusion
It can hereby conclude that Wonderland has done perfectly fine in first year of business
despite of some loss. There is great hope that company will do much better in future years. It is
recommended to the company to look after the sales price of goods and also to decrease the cost
through applying various cost reducing methods.
7
Paraphrase This Document
Need a fresh take? Get an instant paraphrase of this document with our AI Paraphraser

References
Bull, R. 2007. Financial Ratios: How to use financial ratios to maximise value and success for
your business'. Elsevier.
Drake, P. P. and Fabozzi, F. J. 2012. Analysis of Financial Statements. John Wiley & Sons.
Fridson, M. S. and Alvarez, F. 2011. Financial Statement Analysis: A Practitioner's Guide. John
Wiley & Sons.
8

Appendix
Financial Statements
FINANCIAL STATEMENTS
Income Statement
1st July 2016 to 30th June 2017
$
REVENUE:
Sales Revenue $ 69,120.00
Less: Cost of goods Sold $ 48,956.00
$ 20,164.00
Add: Discount Received $ 500.00
Gross Profit $ 20,664.00
EXPENSES:
Advertising Expense $ 1,500.00
Bad Debts expense $ 120.30
Dep - Furniture $ 833.70
Discount Allowed Expense $ 855.50
Wages Expense $ 7,644.00
Supplies Expense $ 365.00
Inventory Loss $ 680.00
Rent Expense $ 12,000.00
Insurance Expense $ 2,700.00
9
⊘ This is a preview!⊘
Do you want full access?
Subscribe today to unlock all pages.

Trusted by 1+ million students worldwide

TOTAL EXPENSES $ 26,698.50
Net Profit or Loss -$ 6,034.50
Equity Statement
30th June 2017
$
Beginning Equity $ -
Add: Capital contributions $ 70,000.00
Less: Drawings $ 2,000.00
Less: Loss $ 6,034.50
Ending Equity $ 61,965.50
Balance Sheet
as at 30th June 2017
$
Current Assets:
Cash at Bank $ 55,119.50
Accounts Receivable $ 2,321.00
Less: Provision for Doubtful Debts $ (120.30)
Supplies $ 155.00
Inventory $ 11,744.00
Prepaid Insurance $ 900.00
10
Paraphrase This Document
Need a fresh take? Get an instant paraphrase of this document with our AI Paraphraser

Prepaid rent $ -
GST Paid $ 8,128.00
Total Current Assets $ 78,247.20
Non-current Assets:
Furniture at cost $ 2,779.00
Less: Accumulated Depreciation $ 833.70
Total Non-current Assets $ 1,945.30
Total Assets $ 80,192.50
Current Liabilities:
Accounts Payable $ 8,844.00
GST Collected $ 6,827.00
PAYG Tax Payable $ 312.00
Wages Payable $ 2,244.00
Total Current Liabilities $ 18,227.00
Non-current Liabilities: $ -
Total Non-current Liabilities $ -
Total Liabilities $ 18,227.00
NET ASSETS $ 61,965.50
11

Owners' Equity:
A Wonderland, Capital $ 61,965.50
Total Owners' Equity $ 61,965.50
12
A Wonderland, Capital $ 61,965.50
Total Owners' Equity $ 61,965.50
12
⊘ This is a preview!⊘
Do you want full access?
Subscribe today to unlock all pages.

Trusted by 1+ million students worldwide
1 out of 12
Related Documents

Your All-in-One AI-Powered Toolkit for Academic Success.
 +13062052269
info@desklib.com
Available 24*7 on WhatsApp / Email
Unlock your academic potential
Copyright © 2020–2025 A2Z Services. All Rights Reserved. Developed and managed by ZUCOL.