Woodside Petroleum Financial Analysis: Balance Sheet and Valuation
VerifiedAdded on 2023/06/11
|6
|855
|112
Case Study
AI Summary
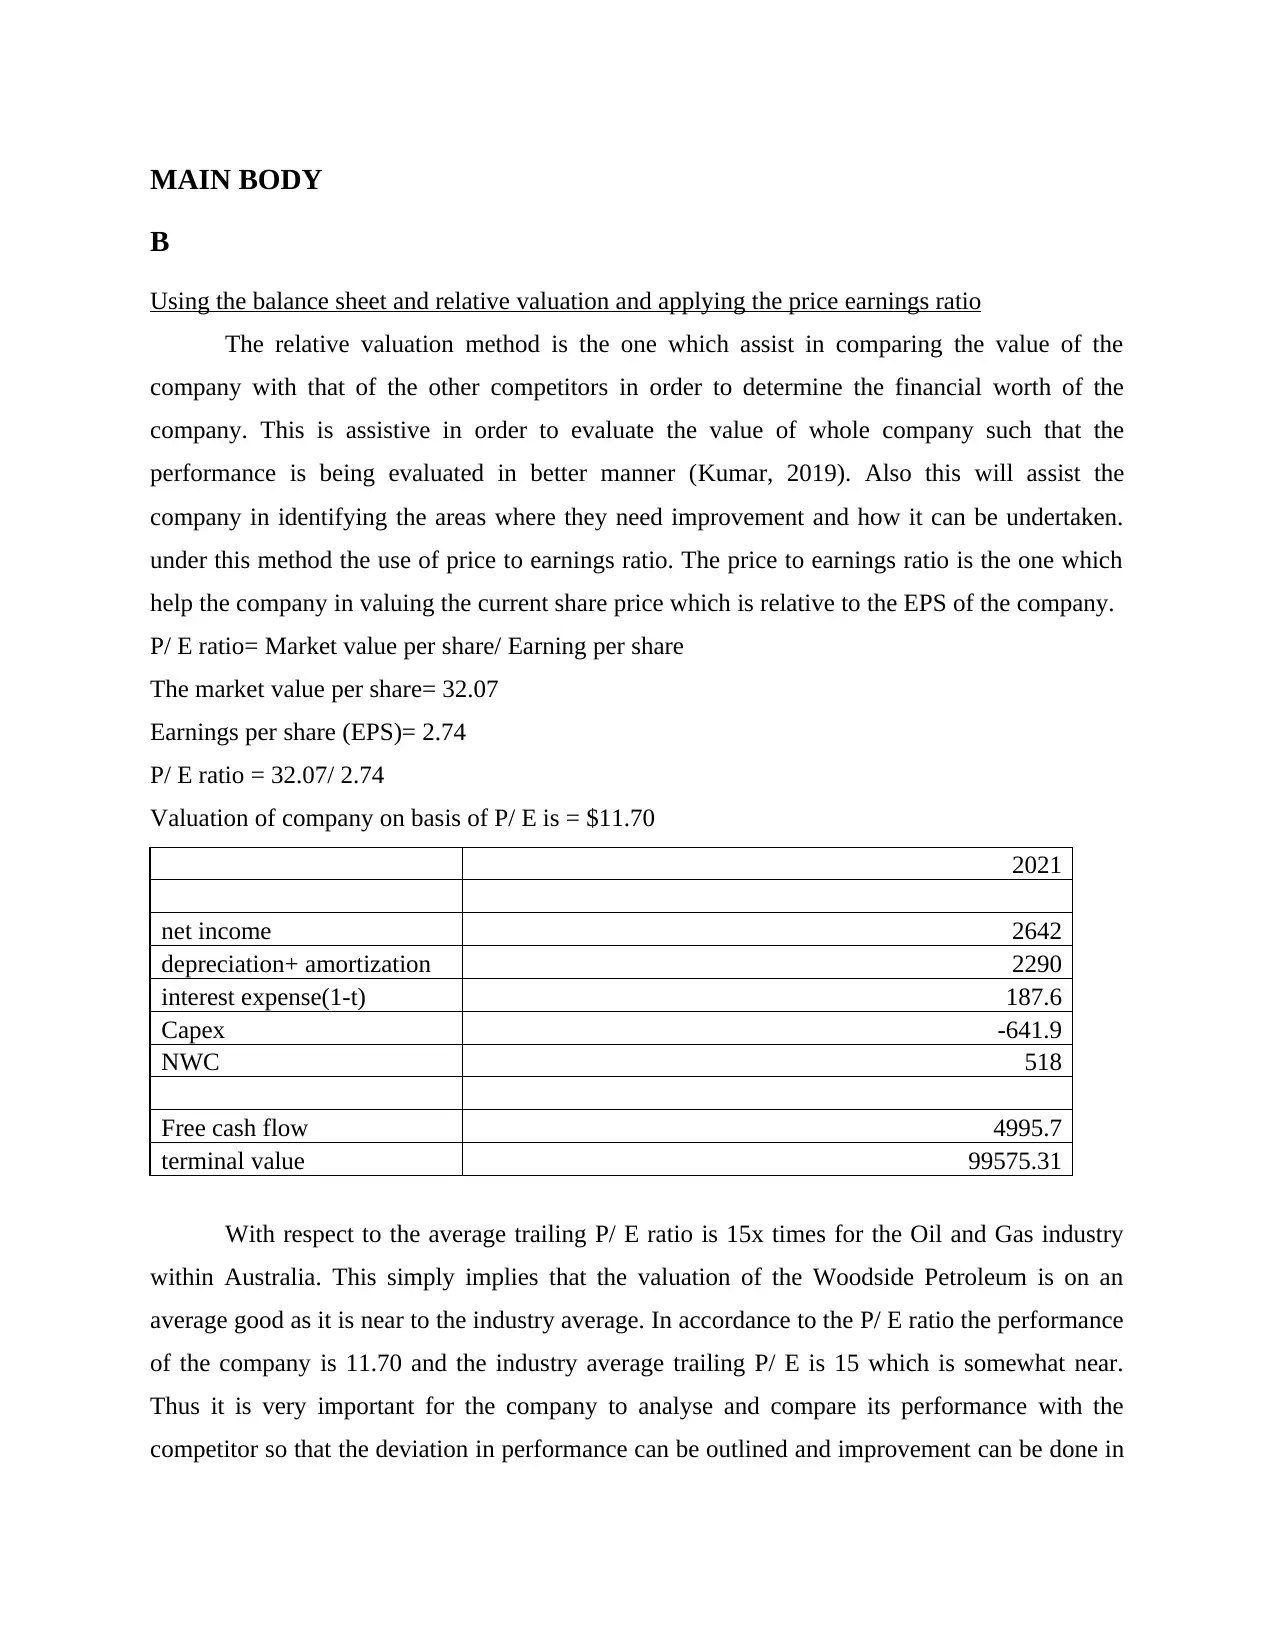
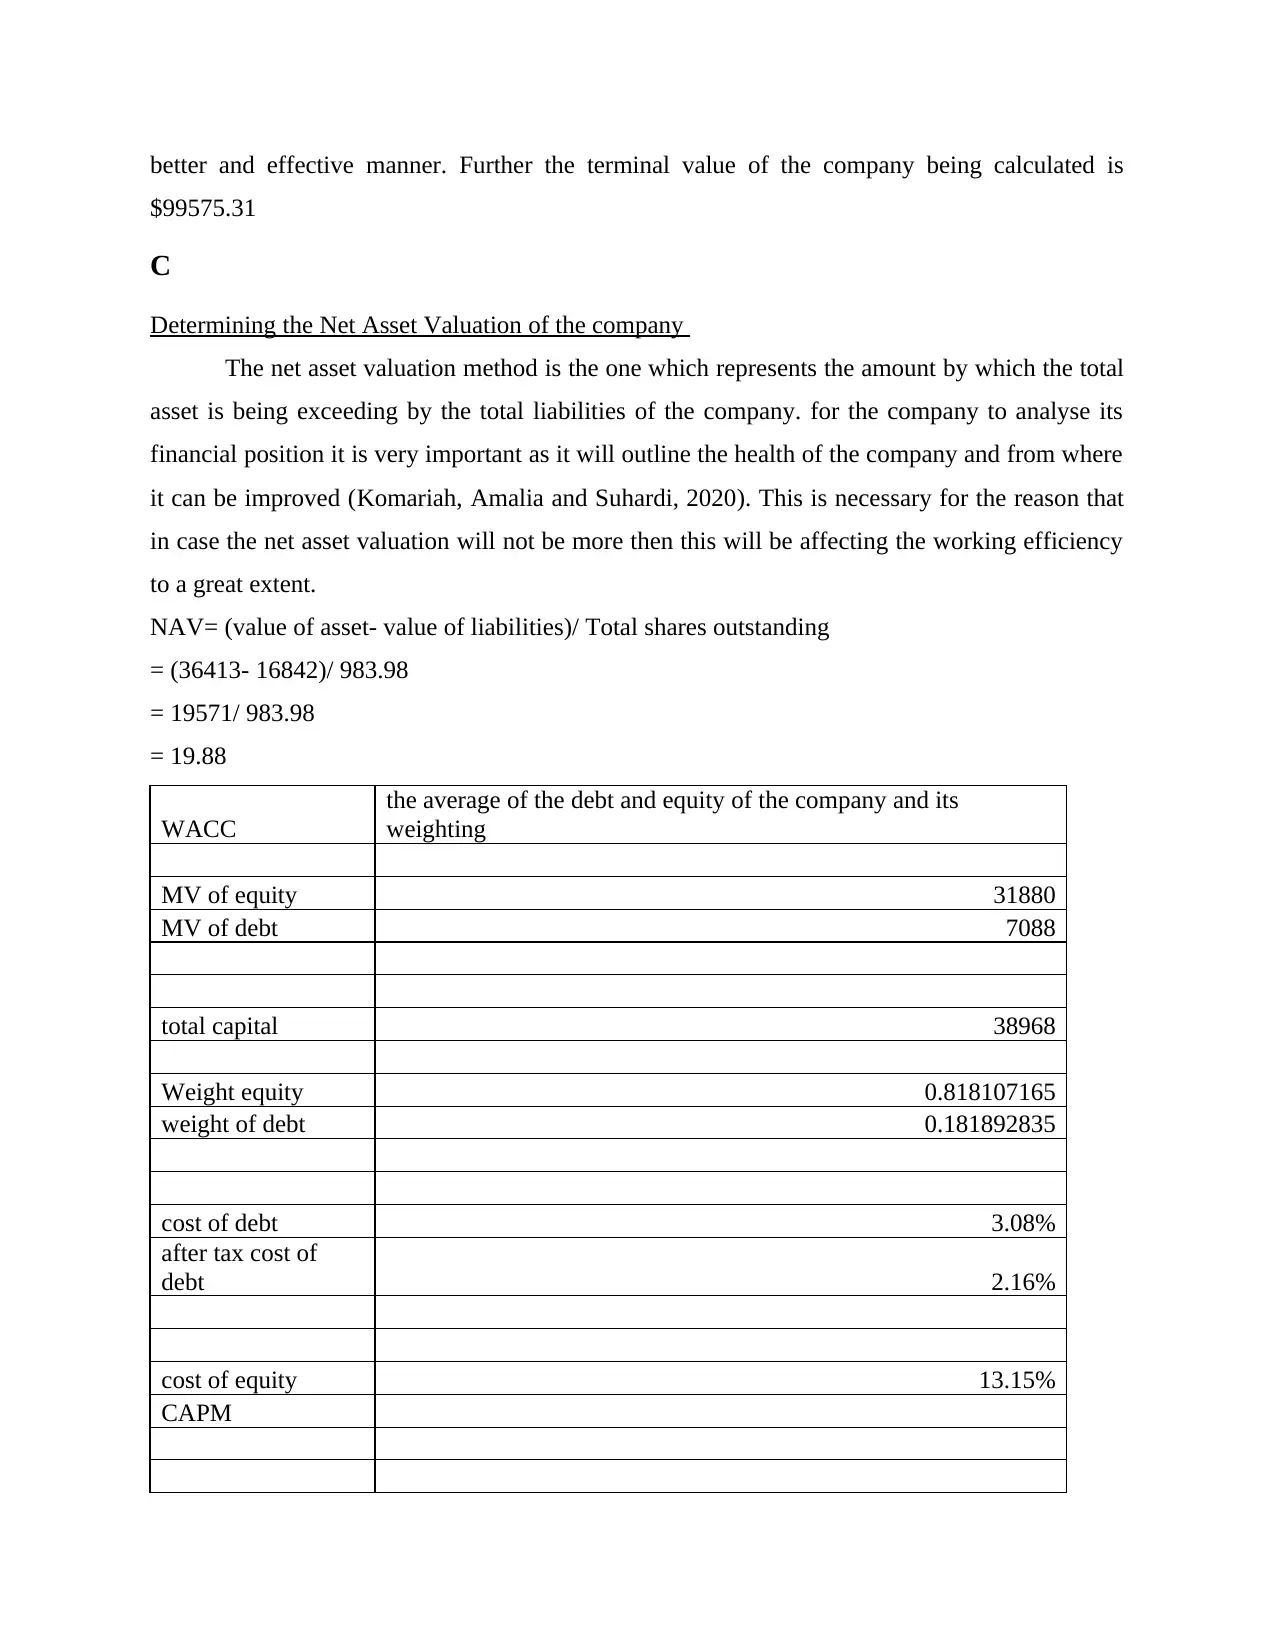
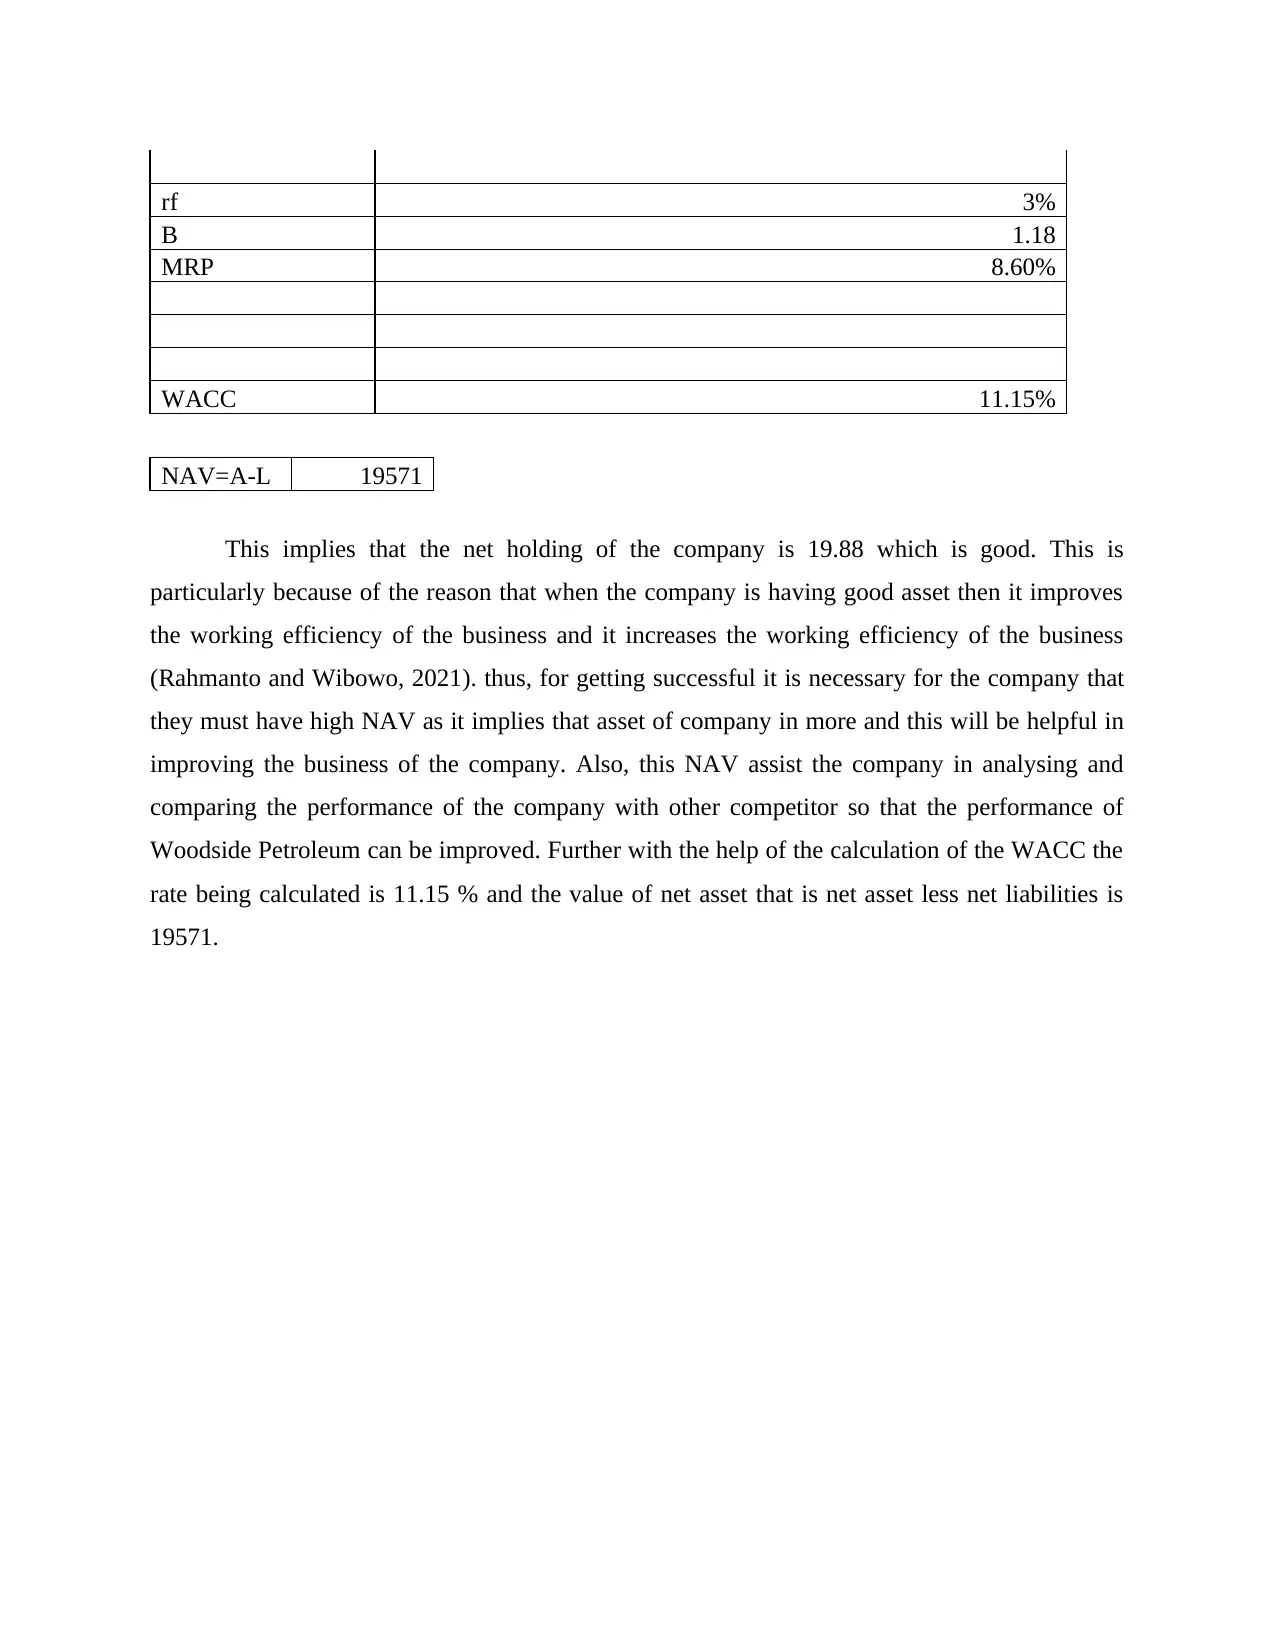
This case study provides a financial analysis of Woodside Petroleum, focusing on its balance sheet, relative valuation, and price-to-earnings (P/E) ratio. It evaluates the company's performance by comparing its P/E ratio to the industry average, determining the net asset valuation (NAV), and calculating the weighted average cost of capital (WACC). The analysis includes calculations for free cash flow and terminal value, providing insights into the company's financial health and areas for potential improvement. The study concludes that Woodside Petroleum's valuation is reasonably aligned with industry standards, emphasizing the importance of continuous performance comparison and strategic adjustments. Desklib provides access to this case study and other solved assignments to support student learning.

Case Analysis Group
Paraphrase This Document
Need a fresh take? Get an instant paraphrase of this document with our AI Paraphraser

TABLE OF CONTENTS
MAIN BODY...................................................................................................................................3
B.......................................................................................................................................................3
Using the balance sheet and relative valuation and applying the price earnings ratio................3
C.......................................................................................................................................................3
Determining the Net Asset Valuation of the company...............................................................3
REFERENCES................................................................................................................................5

MAIN BODY
B
Using the balance sheet and relative valuation and applying the price earnings ratio
The relative valuation method is the one which assist in comparing the value of the
company with that of the other competitors in order to determine the financial worth of the
company. This is assistive in order to evaluate the value of whole company such that the
performance is being evaluated in better manner (Kumar, 2019). Also this will assist the
company in identifying the areas where they need improvement and how it can be undertaken.
under this method the use of price to earnings ratio. The price to earnings ratio is the one which
help the company in valuing the current share price which is relative to the EPS of the company.
P/ E ratio= Market value per share/ Earning per share
The market value per share= 32.07
Earnings per share (EPS)= 2.74
P/ E ratio = 32.07/ 2.74
Valuation of company on basis of P/ E is = $11.70
2021
net income 2642
depreciation+ amortization 2290
interest expense(1-t) 187.6
Capex -641.9
NWC 518
Free cash flow 4995.7
terminal value 99575.31
With respect to the average trailing P/ E ratio is 15x times for the Oil and Gas industry
within Australia. This simply implies that the valuation of the Woodside Petroleum is on an
average good as it is near to the industry average. In accordance to the P/ E ratio the performance
of the company is 11.70 and the industry average trailing P/ E is 15 which is somewhat near.
Thus it is very important for the company to analyse and compare its performance with the
competitor so that the deviation in performance can be outlined and improvement can be done in
⊘ This is a preview!⊘
Do you want full access?
Subscribe today to unlock all pages.

Trusted by 1+ million students worldwide

better and effective manner. Further the terminal value of the company being calculated is
$99575.31
C
Determining the Net Asset Valuation of the company
The net asset valuation method is the one which represents the amount by which the total
asset is being exceeding by the total liabilities of the company. for the company to analyse its
financial position it is very important as it will outline the health of the company and from where
it can be improved (Komariah, Amalia and Suhardi, 2020). This is necessary for the reason that
in case the net asset valuation will not be more then this will be affecting the working efficiency
to a great extent.
NAV= (value of asset- value of liabilities)/ Total shares outstanding
= (36413- 16842)/ 983.98
= 19571/ 983.98
= 19.88
WACC
the average of the debt and equity of the company and its
weighting
MV of equity 31880
MV of debt 7088
total capital 38968
Weight equity 0.818107165
weight of debt 0.181892835
cost of debt 3.08%
after tax cost of
debt 2.16%
cost of equity 13.15%
CAPM
Paraphrase This Document
Need a fresh take? Get an instant paraphrase of this document with our AI Paraphraser

rf 3%
B 1.18
MRP 8.60%
WACC 11.15%
NAV=A-L 19571
This implies that the net holding of the company is 19.88 which is good. This is
particularly because of the reason that when the company is having good asset then it improves
the working efficiency of the business and it increases the working efficiency of the business
(Rahmanto and Wibowo, 2021). thus, for getting successful it is necessary for the company that
they must have high NAV as it implies that asset of company in more and this will be helpful in
improving the business of the company. Also, this NAV assist the company in analysing and
comparing the performance of the company with other competitor so that the performance of
Woodside Petroleum can be improved. Further with the help of the calculation of the WACC the
rate being calculated is 11.15 % and the value of net asset that is net asset less net liabilities is
19571.

REFERENCES
Books and Journals
Kumar, B. R., 2019. Determinants of relative valuation in different industry Sectors—An
empirical study. The Journal of Wealth Management. 22(1). pp.73-85.
Komariah, S., Amalia, S. and Suhardi, A., 2020. Macroeconomics and net asset value (NAV) on
equity mutual funds. International Journal of Psychosocial Rehabilitation. 24(2). pp.3164-
3172.
Rahmanto, A. and Wibowo, B., 2021. Analysis of the disparity factor of the Net Asset Value
(NAV) on the Exchange Trade Fund (ETF) and its market price on the Indonesia Stock
Exchange (IDX). In Contemporary Research on Business and Management (pp. 77-81).
CRC Press.
⊘ This is a preview!⊘
Do you want full access?
Subscribe today to unlock all pages.

Trusted by 1+ million students worldwide
1 out of 6
Related Documents

Your All-in-One AI-Powered Toolkit for Academic Success.
+13062052269
info@desklib.com
Available 24*7 on WhatsApp / Email
Unlock your academic potential
Copyright © 2020–2025 A2Z Services. All Rights Reserved. Developed and managed by ZUCOL.