Project Report: Financial Literacy, Company Perspective, and Valuation
VerifiedAdded on 2020/05/28
|30
|9019
|92
Project
AI Summary
This project report is a comprehensive financial analysis, encompassing financial literacy, company perspectives, and capital budgeting techniques. Part 2 examines financial literacy by comparing two cases involving home loans, calculating monthly repayments and total interest, and analyzing the factors influencing interest expenses. Part 3 focuses on Woodside Petroleum Limited, providing background information, calculating the cash conversion cycle, and assessing short-term and long-term debt financing. The report also includes bond and share valuations, along with an interest coverage ratio analysis. Task 4 involves capital budgeting, calculating free cash flows for two projects, determining discounted payback periods, and evaluating net present value and internal rate of return. The report concludes with a recommendation on which project to invest in, supported by detailed calculations and references.

RUNNING HEAD: Corporate finance 1
Project Report: Finance
Project Report: Finance
Paraphrase This Document
Need a fresh take? Get an instant paraphrase of this document with our AI Paraphraser
Corporate finance 2
Contents
Part 2.................................................................................................................................4
Financial Literacy:............................................................................................................4
Que 1:................................................................................................................................4
1.1 Calculation of monthly repayments:...........................................................................4
1.2 Calculation of Total interest cover:............................................................................5
Que 2:............................................................................................................................5
Why the differences has occurred in the interest expenses:..........................................5
Part 3.................................................................................................................................6
Company Perspective.......................................................................................................6
Que 1:............................................................................................................................6
Background:..................................................................................................................6
Que 2:............................................................................................................................6
Cash conversion cycle:..................................................................................................6
Que 3:............................................................................................................................7
Short term and long term debt financing:.....................................................................7
Que 4:............................................................................................................................8
Bond valuation:.............................................................................................................8
Interest coverage ratio:..................................................................................................8
Que 5:............................................................................................................................9
Share valuation:.............................................................................................................9
Task 4:............................................................................................................................10
Capital Budgeting:..........................................................................................................10
Corporate finance 3
Que 1:..........................................................................................................................10
Calculation of free cash flows of both the projects.....................................................10
Que 2:..........................................................................................................................11
Discounted Payback period:........................................................................................11
Que 3:..........................................................................................................................11
Net present value and internal rate of return...............................................................11
Que 3:..........................................................................................................................12
Recommendation:.......................................................................................................12
References.......................................................................................................................13
Appendix.........................................................................................................................14
⊘ This is a preview!⊘
Do you want full access?
Subscribe today to unlock all pages.
Trusted by 1+ million students worldwide
Corporate finance 4
Part 2
Financial Literacy:
Que 1:
The given express about the two cases which are quite similar but the outcome of both
the cases are different. Following is the calculations of both the cases:
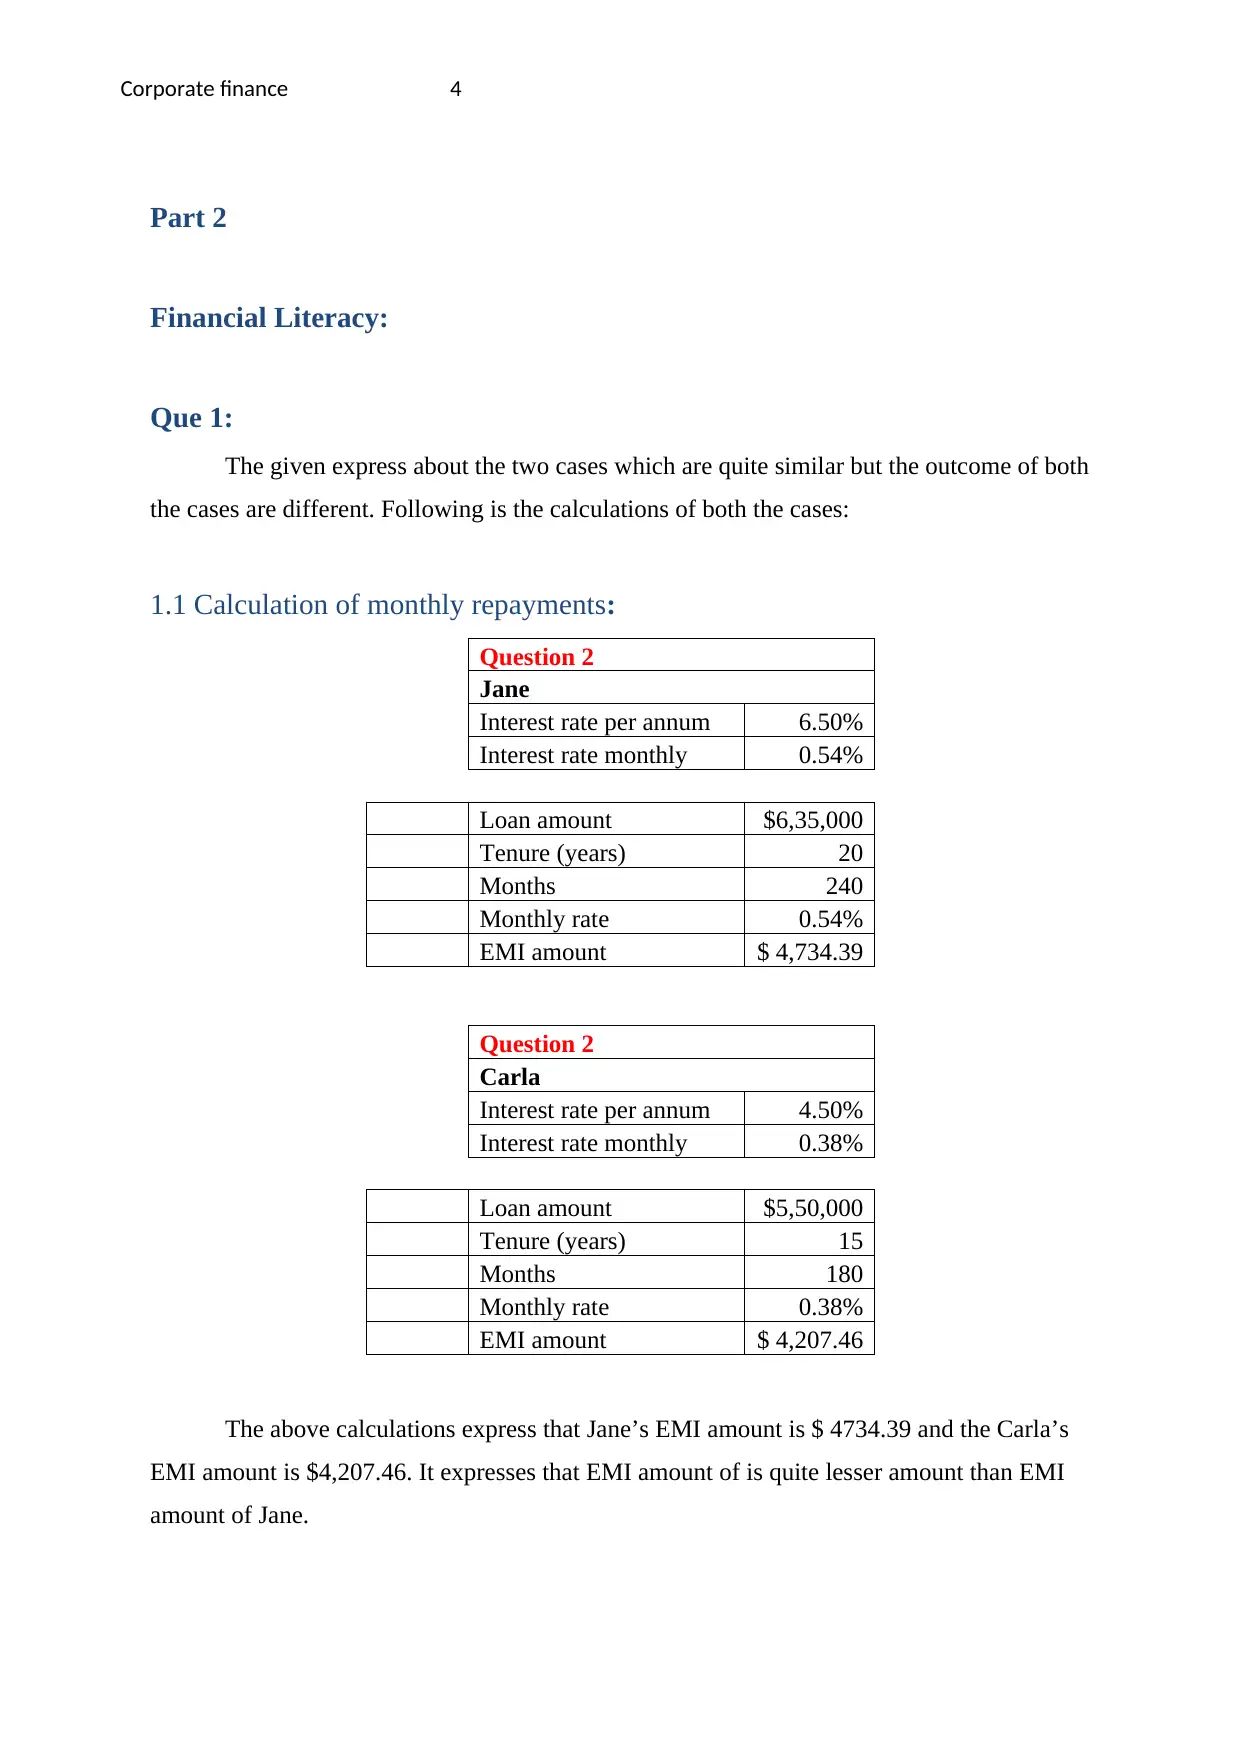
1.1 Calculation of monthly repayments:
Question 2
Jane
Interest rate per annum 6.50%
Interest rate monthly 0.54%
Loan amount $6,35,000
Tenure (years) 20
Months 240
Monthly rate 0.54%
EMI amount $ 4,734.39
Question 2
Carla
Interest rate per annum 4.50%
Interest rate monthly 0.38%
Loan amount $5,50,000
Tenure (years) 15
Months 180
Monthly rate 0.38%
EMI amount $ 4,207.46
The above calculations express that Jane’s EMI amount is $ 4734.39 and the Carla’s
EMI amount is $4,207.46. It expresses that EMI amount of is quite lesser amount than EMI
amount of Jane.
Part 2
Financial Literacy:
Que 1:
The given express about the two cases which are quite similar but the outcome of both
the cases are different. Following is the calculations of both the cases:
1.1 Calculation of monthly repayments:
Question 2
Jane
Interest rate per annum 6.50%
Interest rate monthly 0.54%
Loan amount $6,35,000
Tenure (years) 20
Months 240
Monthly rate 0.54%
EMI amount $ 4,734.39
Question 2
Carla
Interest rate per annum 4.50%
Interest rate monthly 0.38%
Loan amount $5,50,000
Tenure (years) 15
Months 180
Monthly rate 0.38%
EMI amount $ 4,207.46
The above calculations express that Jane’s EMI amount is $ 4734.39 and the Carla’s
EMI amount is $4,207.46. It expresses that EMI amount of is quite lesser amount than EMI
amount of Jane.
Paraphrase This Document
Need a fresh take? Get an instant paraphrase of this document with our AI Paraphraser
Corporate finance 5
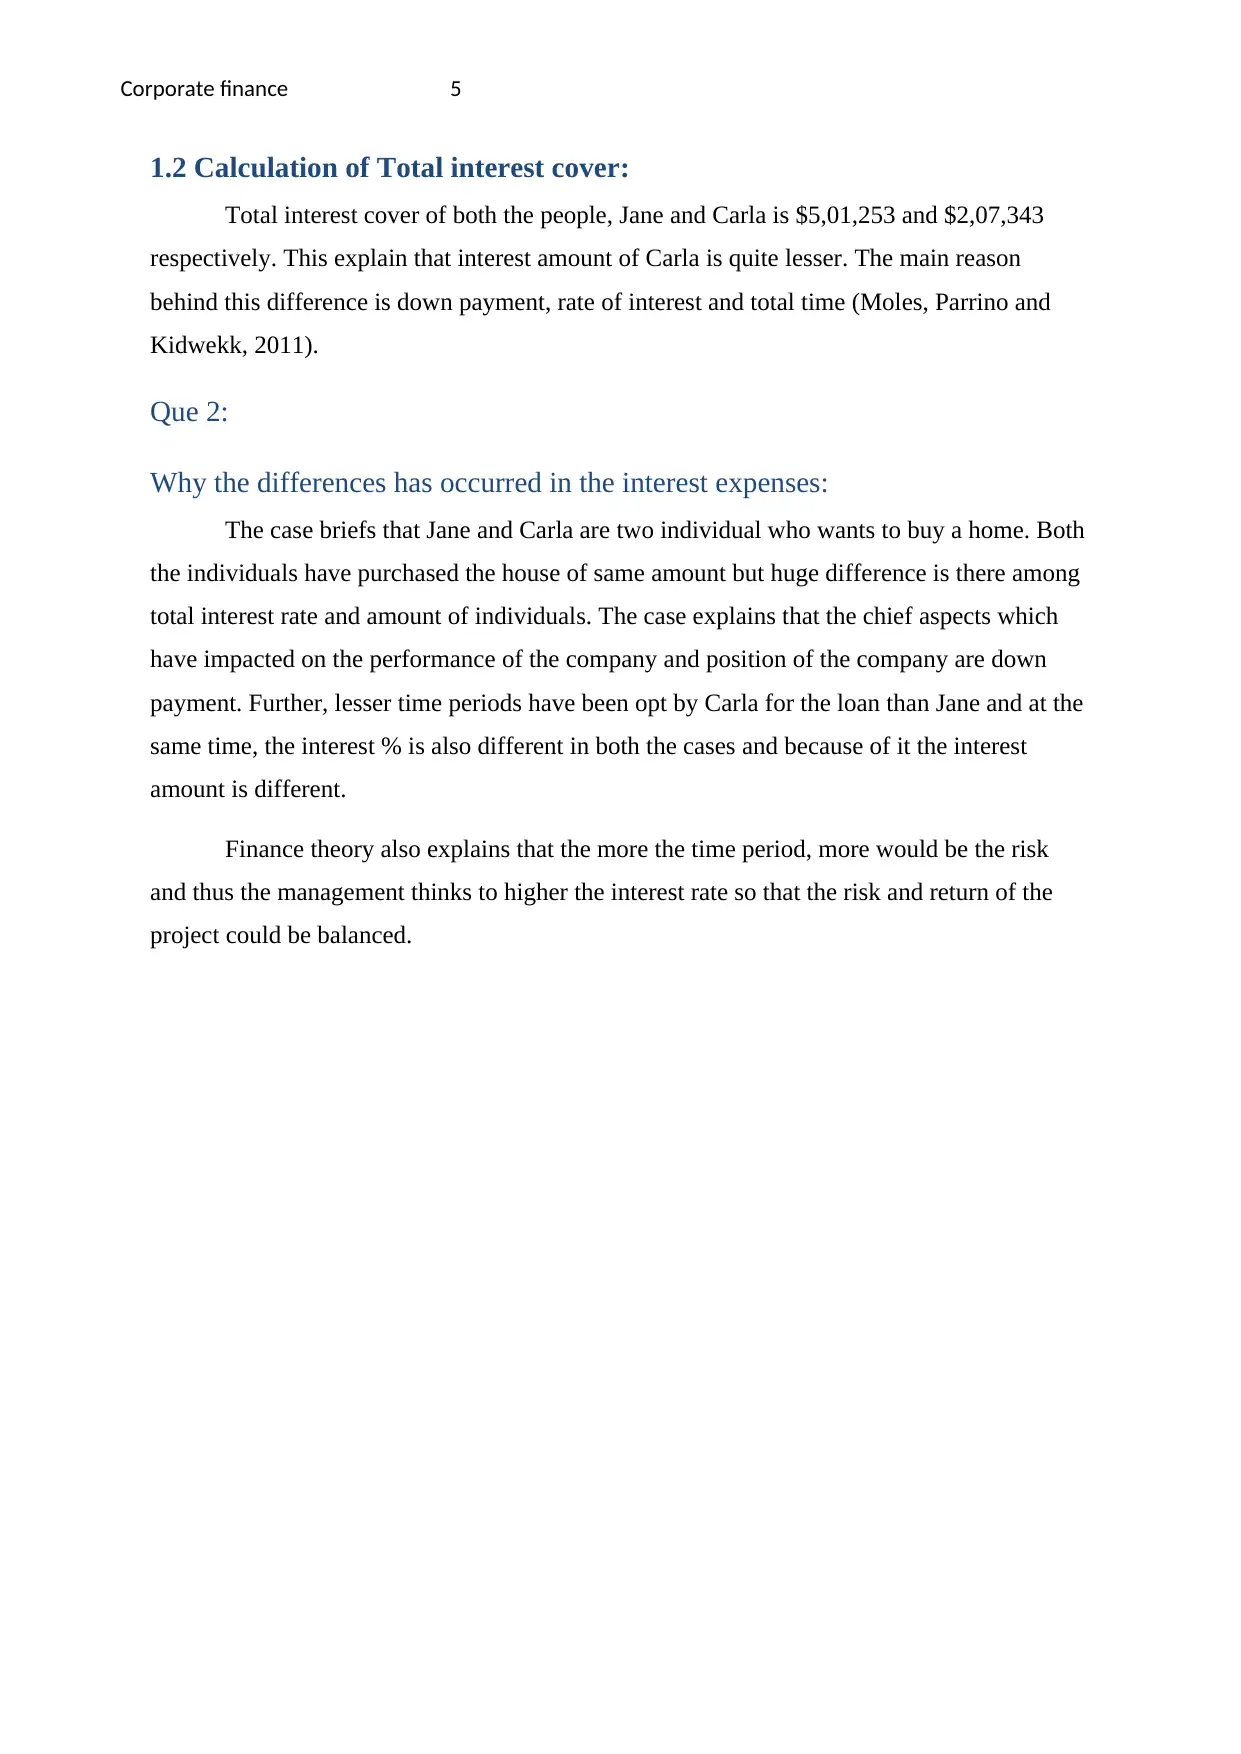
1.2 Calculation of Total interest cover:
Total interest cover of both the people, Jane and Carla is $5,01,253 and $2,07,343
respectively. This explain that interest amount of Carla is quite lesser. The main reason
behind this difference is down payment, rate of interest and total time (Moles, Parrino and
Kidwekk, 2011).
Que 2:
Why the differences has occurred in the interest expenses:
The case briefs that Jane and Carla are two individual who wants to buy a home. Both
the individuals have purchased the house of same amount but huge difference is there among
total interest rate and amount of individuals. The case explains that the chief aspects which
have impacted on the performance of the company and position of the company are down
payment. Further, lesser time periods have been opt by Carla for the loan than Jane and at the
same time, the interest % is also different in both the cases and because of it the interest
amount is different.
Finance theory also explains that the more the time period, more would be the risk
and thus the management thinks to higher the interest rate so that the risk and return of the
project could be balanced.
Corporate finance 6
Part 3:
Company Perspective:
Que 1:
Background:
Woodside Petroleum Limited is an oil and gas exploration organization. The main
business is operated by this company in Australian market. Now days, the company has
became the largest oil and gas production and oil and gas exploration company. Main office
of the business is situated at Perth in Australia. The stock of the business has been registered
in ASX (Australian stock exchange). Mainly, the company has diversified its market into
various new countries and the location to grab the mining, projects and enhance the market
share of the company. Currently, the biggest project of mining industry is held by Woodside
limited. The current report of oil and gas exploration industry of Australia brief that the
Woodside Limited held 13.5% share of oil and gas industry which is highest share in the
Australian market. The company has made few changes into its operations and the strategies
to manage the position and performance of the business in marketplace.
The main strength of the company is its highest share in the Australian market (gas
and exploration industry). The largest and biggest projects are held by this company and it
would help the company to enhance the market share as well as total revenue of the company.
Further, the weakness of the company is its bad corporate social responsibility, this company
is continuously harming the natural resources of the Australia and further, this company has
failed to manage a good relationship with its stakeholders (Nobes and Parker, 2008).
Company is supposed to look over these threats and make few changes to save itself from
sudden risk and consequences. If the company would not look over these threats now than the
market share of the company could be grabbed by its competitors.
Que 2:
Cash conversion cycle:
Cash conversion cycle calculations of the company are as follows:
Calculation of cash conversion cycle of 2016
⊘ This is a preview!⊘
Do you want full access?
Subscribe today to unlock all pages.
Trusted by 1+ million students worldwide
Corporate finance 7
Sales
£
4,075
COGS
£
2,234
Inventor
ies
£
5
AR
£
172
AP
£
546
Days/
year 365
Cash conversion
cycle (CCC) =
Inventory
conversion period +
Receivables
collection
period
-
Payables
deferral period
=
Inventory/Sales per
day +
AR/Sales per
day -
AP/COGS per
day
= £ 0.45 +
£
15.41 -
£
48.91
= -£ 33.05
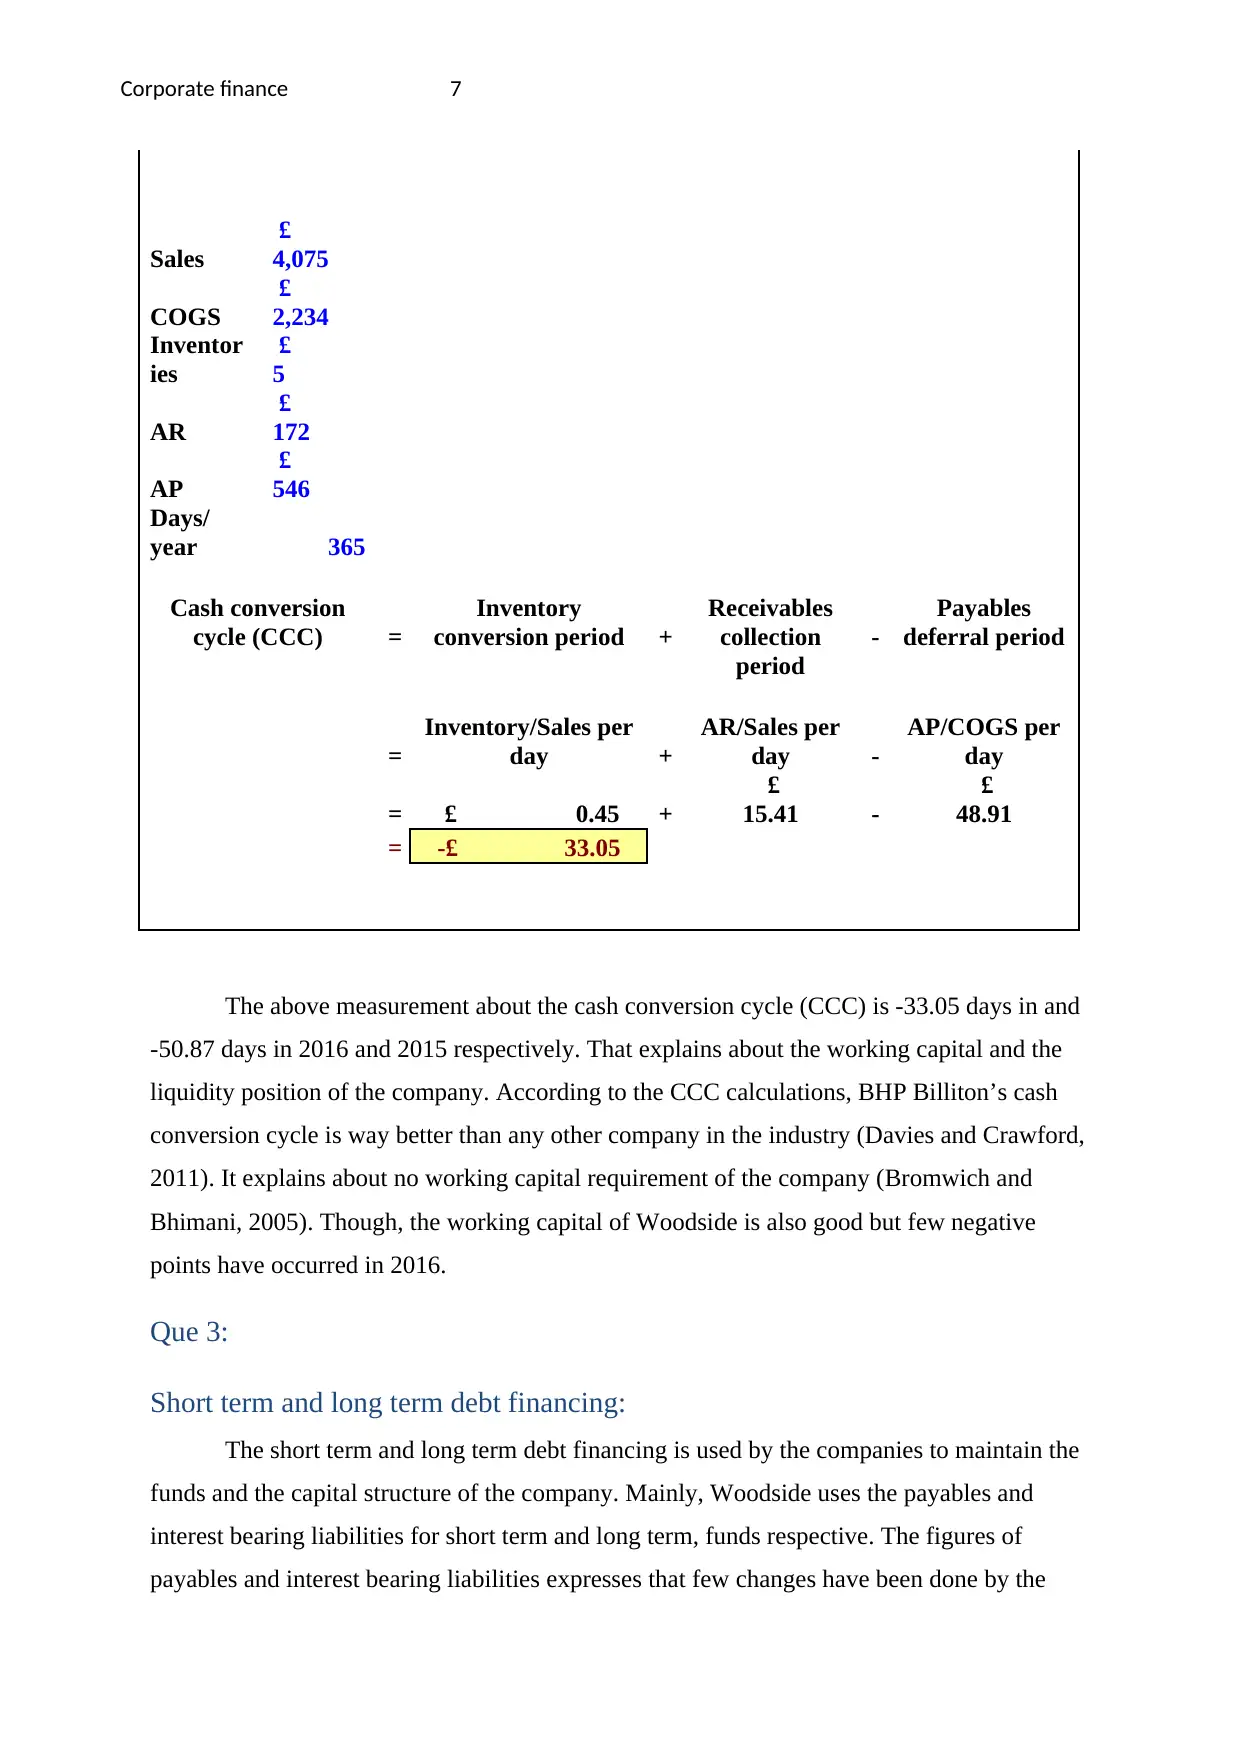
The above measurement about the cash conversion cycle (CCC) is -33.05 days in and
-50.87 days in 2016 and 2015 respectively. That explains about the working capital and the
liquidity position of the company. According to the CCC calculations, BHP Billiton’s cash
conversion cycle is way better than any other company in the industry (Davies and Crawford,
2011). It explains about no working capital requirement of the company (Bromwich and
Bhimani, 2005). Though, the working capital of Woodside is also good but few negative
points have occurred in 2016.
Que 3:
Short term and long term debt financing:
The short term and long term debt financing is used by the companies to maintain the
funds and the capital structure of the company. Mainly, Woodside uses the payables and
interest bearing liabilities for short term and long term, funds respective. The figures of
payables and interest bearing liabilities expresses that few changes have been done by the
Sales
£
4,075
COGS
£
2,234
Inventor
ies
£
5
AR
£
172
AP
£
546
Days/
year 365
Cash conversion
cycle (CCC) =
Inventory
conversion period +
Receivables
collection
period
-
Payables
deferral period
=
Inventory/Sales per
day +
AR/Sales per
day -
AP/COGS per
day
= £ 0.45 +
£
15.41 -
£
48.91
= -£ 33.05
The above measurement about the cash conversion cycle (CCC) is -33.05 days in and
-50.87 days in 2016 and 2015 respectively. That explains about the working capital and the
liquidity position of the company. According to the CCC calculations, BHP Billiton’s cash
conversion cycle is way better than any other company in the industry (Davies and Crawford,
2011). It explains about no working capital requirement of the company (Bromwich and
Bhimani, 2005). Though, the working capital of Woodside is also good but few negative
points have occurred in 2016.
Que 3:
Short term and long term debt financing:
The short term and long term debt financing is used by the companies to maintain the
funds and the capital structure of the company. Mainly, Woodside uses the payables and
interest bearing liabilities for short term and long term, funds respective. The figures of
payables and interest bearing liabilities expresses that few changes have been done by the
Paraphrase This Document
Need a fresh take? Get an instant paraphrase of this document with our AI Paraphraser
Corporate finance 8
management of the company in its short term and long term liabilities but still the company
uses the debt most to manage the funds and the performance of the company (Damodaran,
2011).
Que 4:
Bond valuation:
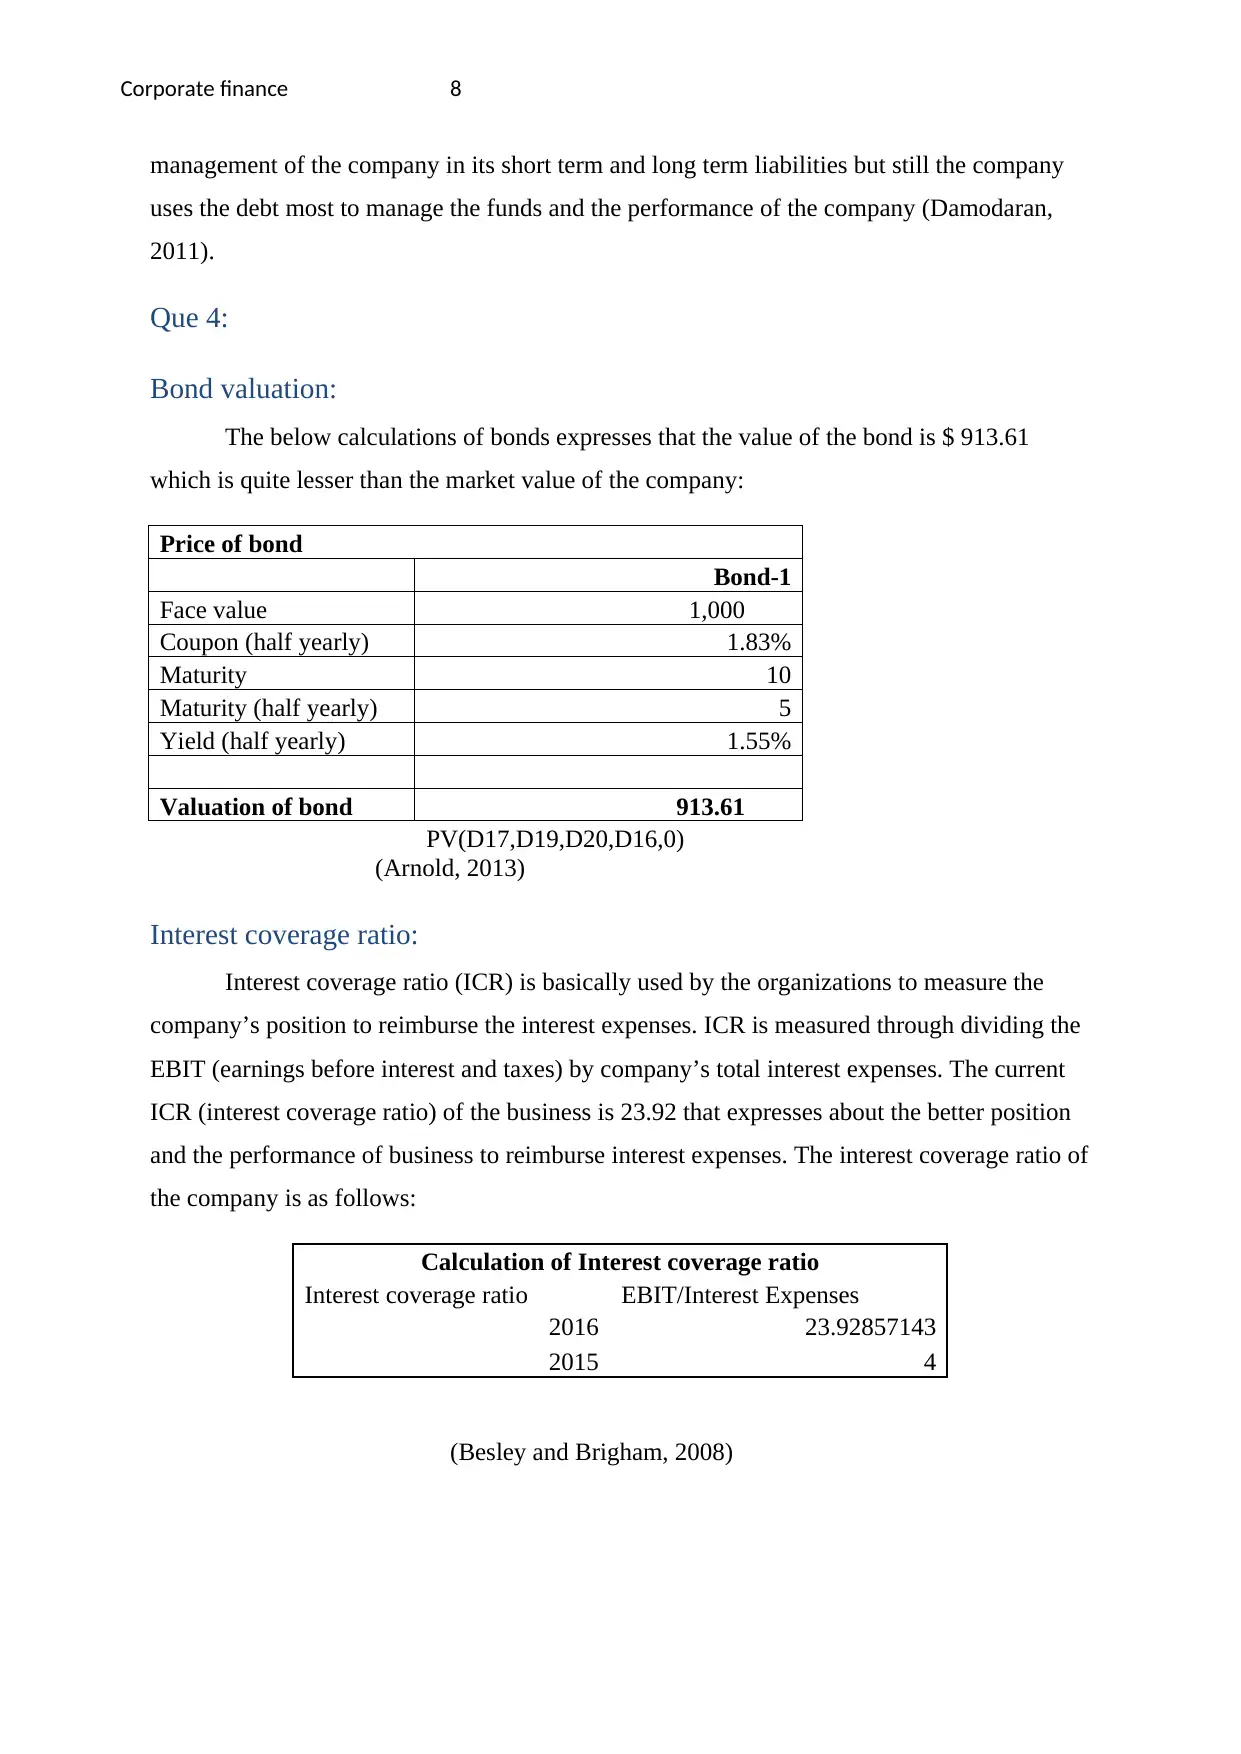
The below calculations of bonds expresses that the value of the bond is $ 913.61
which is quite lesser than the market value of the company:
Price of bond
Bond-1
Face value 1,000
Coupon (half yearly) 1.83%
Maturity 10
Maturity (half yearly) 5
Yield (half yearly) 1.55%
Valuation of bond 913.61
PV(D17,D19,D20,D16,0)
(Arnold, 2013)
Interest coverage ratio:
Interest coverage ratio (ICR) is basically used by the organizations to measure the
company’s position to reimburse the interest expenses. ICR is measured through dividing the
EBIT (earnings before interest and taxes) by company’s total interest expenses. The current
ICR (interest coverage ratio) of the business is 23.92 that expresses about the better position
and the performance of business to reimburse interest expenses. The interest coverage ratio of
the company is as follows:
Calculation of Interest coverage ratio
Interest coverage ratio EBIT/Interest Expenses
2016 23.92857143
2015 4
(Besley and Brigham, 2008)
management of the company in its short term and long term liabilities but still the company
uses the debt most to manage the funds and the performance of the company (Damodaran,
2011).
Que 4:
Bond valuation:
The below calculations of bonds expresses that the value of the bond is $ 913.61
which is quite lesser than the market value of the company:
Price of bond
Bond-1
Face value 1,000
Coupon (half yearly) 1.83%
Maturity 10
Maturity (half yearly) 5
Yield (half yearly) 1.55%
Valuation of bond 913.61
PV(D17,D19,D20,D16,0)
(Arnold, 2013)
Interest coverage ratio:
Interest coverage ratio (ICR) is basically used by the organizations to measure the
company’s position to reimburse the interest expenses. ICR is measured through dividing the
EBIT (earnings before interest and taxes) by company’s total interest expenses. The current
ICR (interest coverage ratio) of the business is 23.92 that expresses about the better position
and the performance of business to reimburse interest expenses. The interest coverage ratio of
the company is as follows:
Calculation of Interest coverage ratio
Interest coverage ratio EBIT/Interest Expenses
2016 23.92857143
2015 4
(Besley and Brigham, 2008)
Corporate finance 9
Que 5:
Share valuation:
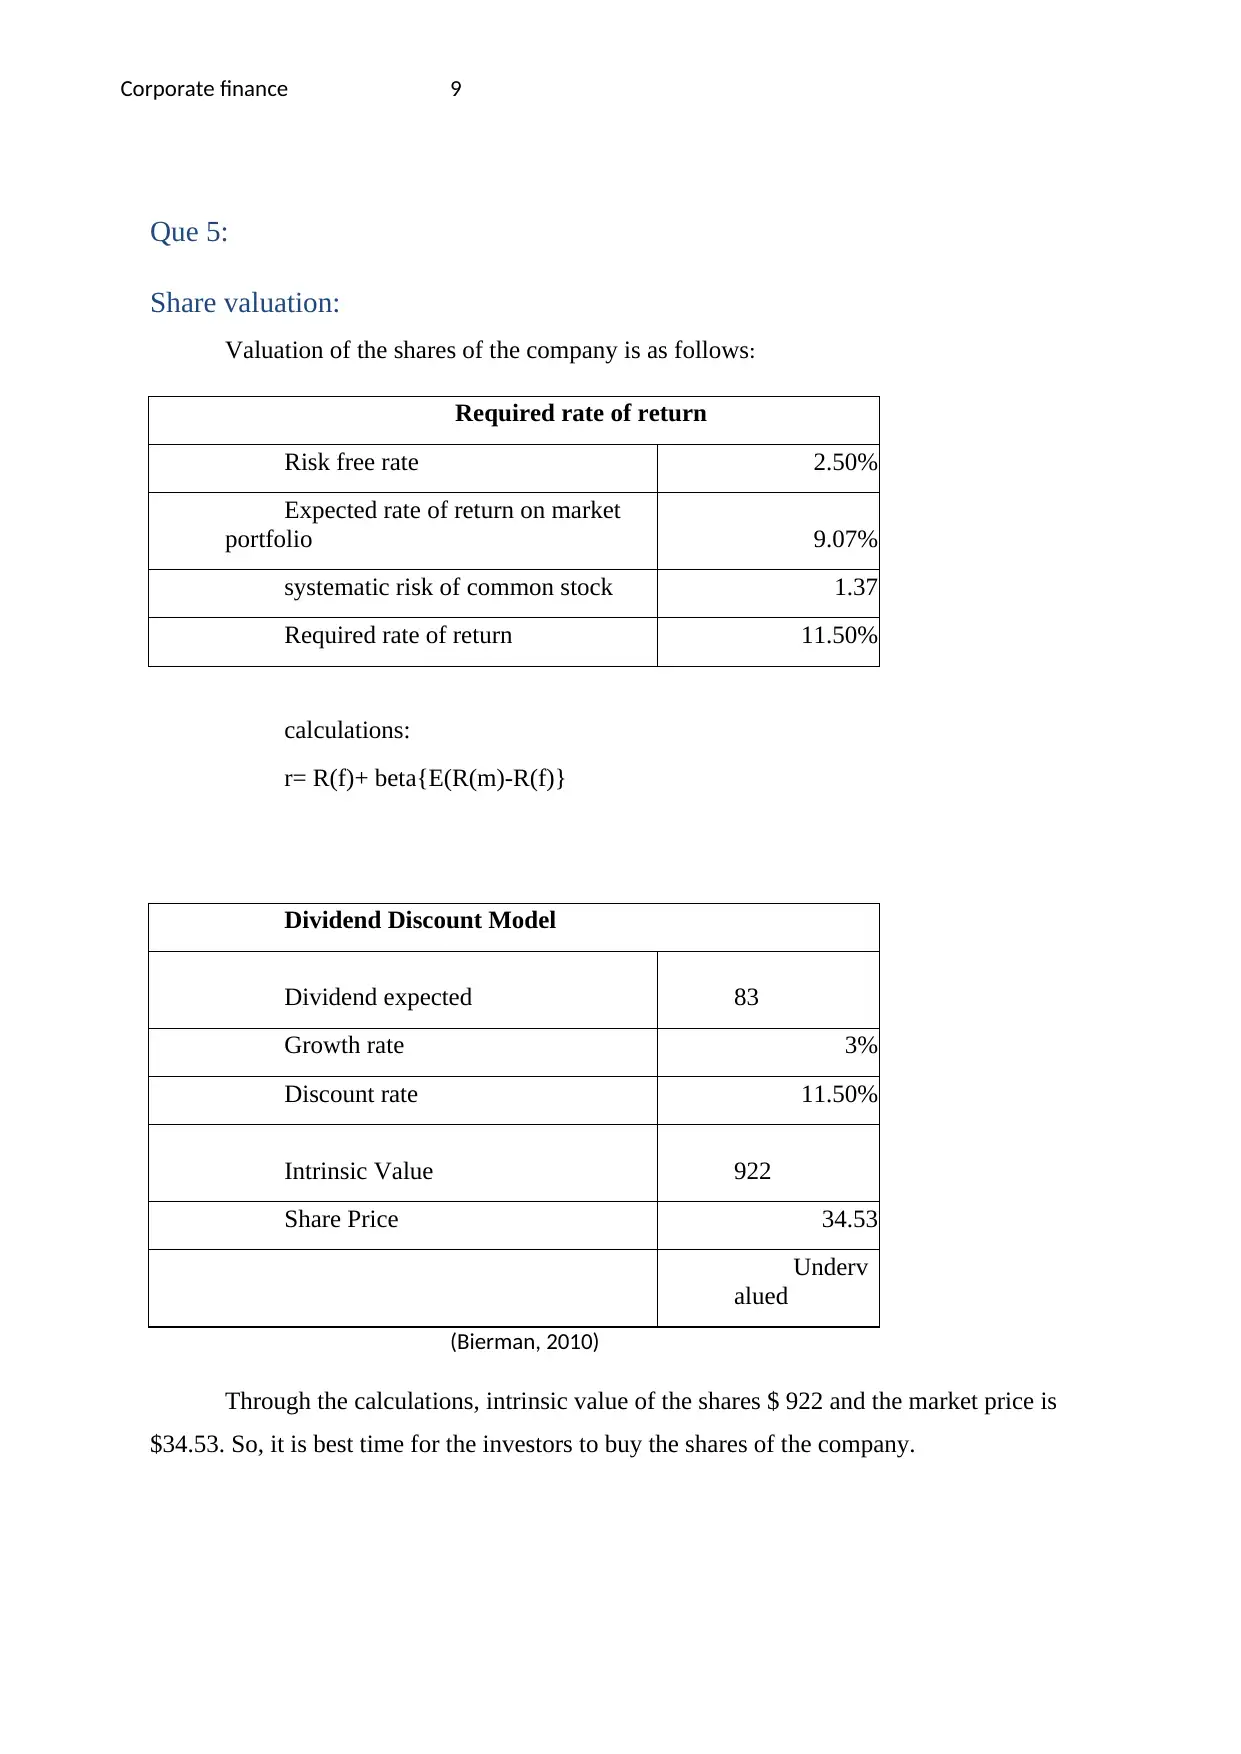
Valuation of the shares of the company is as follows:
Required rate of return
Risk free rate 2.50%
Expected rate of return on market
portfolio 9.07%
systematic risk of common stock 1.37
Required rate of return 11.50%
calculations:
r= R(f)+ beta{E(R(m)-R(f)}
Dividend Discount Model
Dividend expected 83
Growth rate 3%
Discount rate 11.50%
Intrinsic Value 922
Share Price 34.53
Underv
alued
(Bierman, 2010)
Through the calculations, intrinsic value of the shares $ 922 and the market price is
$34.53. So, it is best time for the investors to buy the shares of the company.
Que 5:
Share valuation:
Valuation of the shares of the company is as follows:
Required rate of return
Risk free rate 2.50%
Expected rate of return on market
portfolio 9.07%
systematic risk of common stock 1.37
Required rate of return 11.50%
calculations:
r= R(f)+ beta{E(R(m)-R(f)}
Dividend Discount Model
Dividend expected 83
Growth rate 3%
Discount rate 11.50%
Intrinsic Value 922
Share Price 34.53
Underv
alued
(Bierman, 2010)
Through the calculations, intrinsic value of the shares $ 922 and the market price is
$34.53. So, it is best time for the investors to buy the shares of the company.
⊘ This is a preview!⊘
Do you want full access?
Subscribe today to unlock all pages.
Trusted by 1+ million students worldwide
Corporate finance 10
Task 4:
Capital Budgeting:
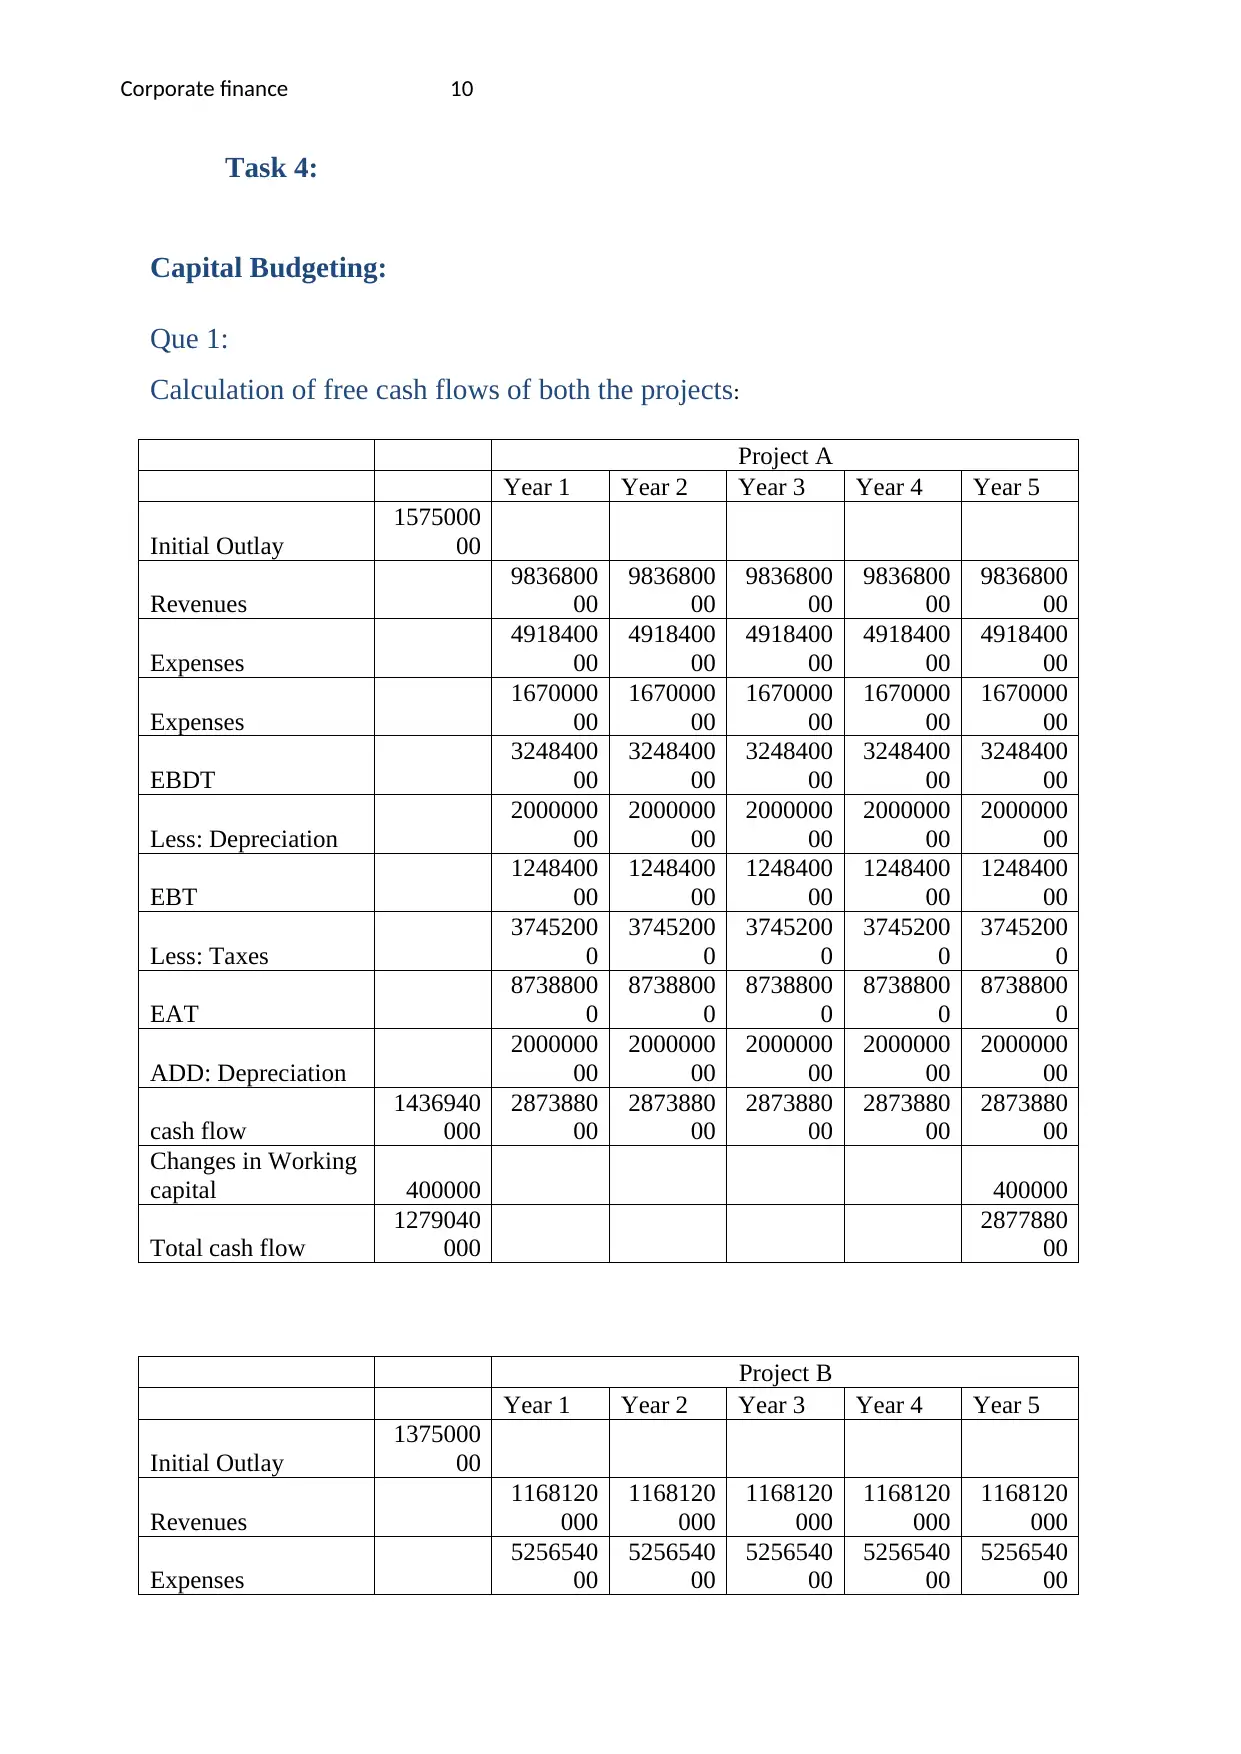
Que 1:
Calculation of free cash flows of both the projects:
Project A
Year 1 Year 2 Year 3 Year 4 Year 5
Initial Outlay
1575000
00
Revenues
9836800
00
9836800
00
9836800
00
9836800
00
9836800
00
Expenses
4918400
00
4918400
00
4918400
00
4918400
00
4918400
00
Expenses
1670000
00
1670000
00
1670000
00
1670000
00
1670000
00
EBDT
3248400
00
3248400
00
3248400
00
3248400
00
3248400
00
Less: Depreciation
2000000
00
2000000
00
2000000
00
2000000
00
2000000
00
EBT
1248400
00
1248400
00
1248400
00
1248400
00
1248400
00
Less: Taxes
3745200
0
3745200
0
3745200
0
3745200
0
3745200
0
EAT
8738800
0
8738800
0
8738800
0
8738800
0
8738800
0
ADD: Depreciation
2000000
00
2000000
00
2000000
00
2000000
00
2000000
00
cash flow
1436940
000
2873880
00
2873880
00
2873880
00
2873880
00
2873880
00
Changes in Working
capital 400000 400000
Total cash flow
1279040
000
2877880
00
Project B
Year 1 Year 2 Year 3 Year 4 Year 5
Initial Outlay
1375000
00
Revenues
1168120
000
1168120
000
1168120
000
1168120
000
1168120
000
Expenses
5256540
00
5256540
00
5256540
00
5256540
00
5256540
00
Task 4:
Capital Budgeting:
Que 1:
Calculation of free cash flows of both the projects:
Project A
Year 1 Year 2 Year 3 Year 4 Year 5
Initial Outlay
1575000
00
Revenues
9836800
00
9836800
00
9836800
00
9836800
00
9836800
00
Expenses
4918400
00
4918400
00
4918400
00
4918400
00
4918400
00
Expenses
1670000
00
1670000
00
1670000
00
1670000
00
1670000
00
EBDT
3248400
00
3248400
00
3248400
00
3248400
00
3248400
00
Less: Depreciation
2000000
00
2000000
00
2000000
00
2000000
00
2000000
00
EBT
1248400
00
1248400
00
1248400
00
1248400
00
1248400
00
Less: Taxes
3745200
0
3745200
0
3745200
0
3745200
0
3745200
0
EAT
8738800
0
8738800
0
8738800
0
8738800
0
8738800
0
ADD: Depreciation
2000000
00
2000000
00
2000000
00
2000000
00
2000000
00
cash flow
1436940
000
2873880
00
2873880
00
2873880
00
2873880
00
2873880
00
Changes in Working
capital 400000 400000
Total cash flow
1279040
000
2877880
00
Project B
Year 1 Year 2 Year 3 Year 4 Year 5
Initial Outlay
1375000
00
Revenues
1168120
000
1168120
000
1168120
000
1168120
000
1168120
000
Expenses
5256540
00
5256540
00
5256540
00
5256540
00
5256540
00
Paraphrase This Document
Need a fresh take? Get an instant paraphrase of this document with our AI Paraphraser
Corporate finance 11
Expenses
1252500
00
1252500
00
1252500
00
1252500
00
1252500
00
EBDT
5172160
00
5172160
00
5172160
00
5172160
00
5172160
00
Less: Depreciation
2000000
00
2000000
00
2000000
00
2000000
00
2000000
00
EBT
3172160
00
3172160
00
3172160
00
3172160
00
3172160
00
Less: Taxes
9516480
0
9516480
0
9516480
0
9516480
0
9516480
0
EAT
2220512
00
2220512
00
2220512
00
2220512
00
2220512
00
ADD: Depreciation
2000000
00
2000000
00
2000000
00
2000000
00
2000000
00
cash flow
2110256
000
4220512
00
4220512
00
4220512
00
4220512
00
4220512
00
Changes in Working
capital 400000 400000
Total cash flow
1972356
000
4224512
00
(Arnold, 2013)
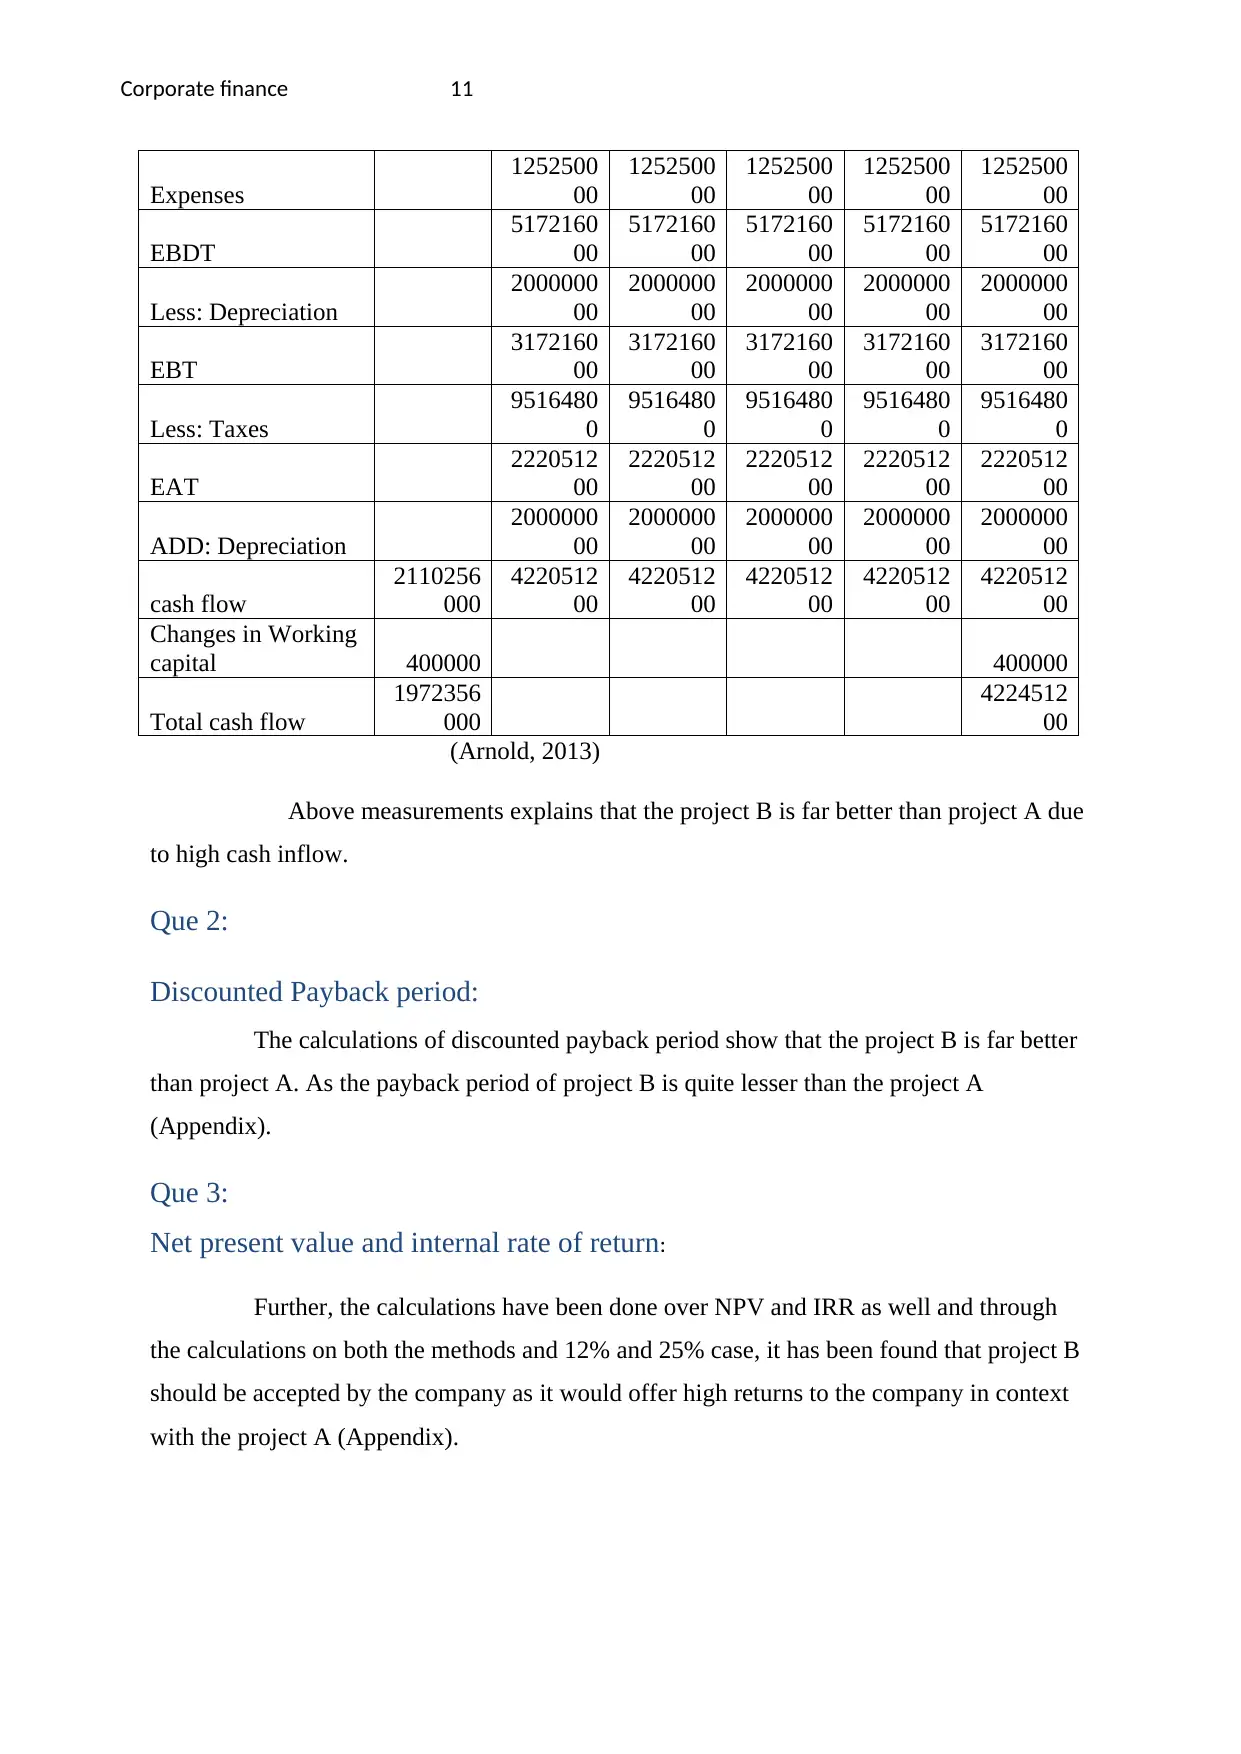
Above measurements explains that the project B is far better than project A due
to high cash inflow.
Que 2:
Discounted Payback period:
The calculations of discounted payback period show that the project B is far better
than project A. As the payback period of project B is quite lesser than the project A
(Appendix).
Que 3:
Net present value and internal rate of return:
Further, the calculations have been done over NPV and IRR as well and through
the calculations on both the methods and 12% and 25% case, it has been found that project B
should be accepted by the company as it would offer high returns to the company in context
with the project A (Appendix).
Expenses
1252500
00
1252500
00
1252500
00
1252500
00
1252500
00
EBDT
5172160
00
5172160
00
5172160
00
5172160
00
5172160
00
Less: Depreciation
2000000
00
2000000
00
2000000
00
2000000
00
2000000
00
EBT
3172160
00
3172160
00
3172160
00
3172160
00
3172160
00
Less: Taxes
9516480
0
9516480
0
9516480
0
9516480
0
9516480
0
EAT
2220512
00
2220512
00
2220512
00
2220512
00
2220512
00
ADD: Depreciation
2000000
00
2000000
00
2000000
00
2000000
00
2000000
00
cash flow
2110256
000
4220512
00
4220512
00
4220512
00
4220512
00
4220512
00
Changes in Working
capital 400000 400000
Total cash flow
1972356
000
4224512
00
(Arnold, 2013)
Above measurements explains that the project B is far better than project A due
to high cash inflow.
Que 2:
Discounted Payback period:
The calculations of discounted payback period show that the project B is far better
than project A. As the payback period of project B is quite lesser than the project A
(Appendix).
Que 3:
Net present value and internal rate of return:
Further, the calculations have been done over NPV and IRR as well and through
the calculations on both the methods and 12% and 25% case, it has been found that project B
should be accepted by the company as it would offer high returns to the company in context
with the project A (Appendix).

Corporate finance 12
Que 3:
Recommendation:
Thus, through the above evaluation, it has been suggested to the investors to
invest into project B. if the WACC of the company is 12% than both the projects would offer
huge loss to the company as IRR of both the companies are quite lesser than the WACC f the
company. Though, the NPV and payback period of project B is better than project A.
⊘ This is a preview!⊘
Do you want full access?
Subscribe today to unlock all pages.
Trusted by 1+ million students worldwide
1 out of 30
Related Documents


Your All-in-One AI-Powered Toolkit for Academic Success.
+13062052269
info@desklib.com
Available 24*7 on WhatsApp / Email
![[object Object]](/_next/static/media/star-bottom.7253800d.svg)
Unlock your academic potential
Copyright © 2020–2026 A2Z Services. All Rights Reserved. Developed and managed by ZUCOL.