Financial Analysis: Woodside Petroleum Ltd. Performance and Ratios

Verified

Added on  2022/09/29

|15
|713
|21
Report
AI Summary
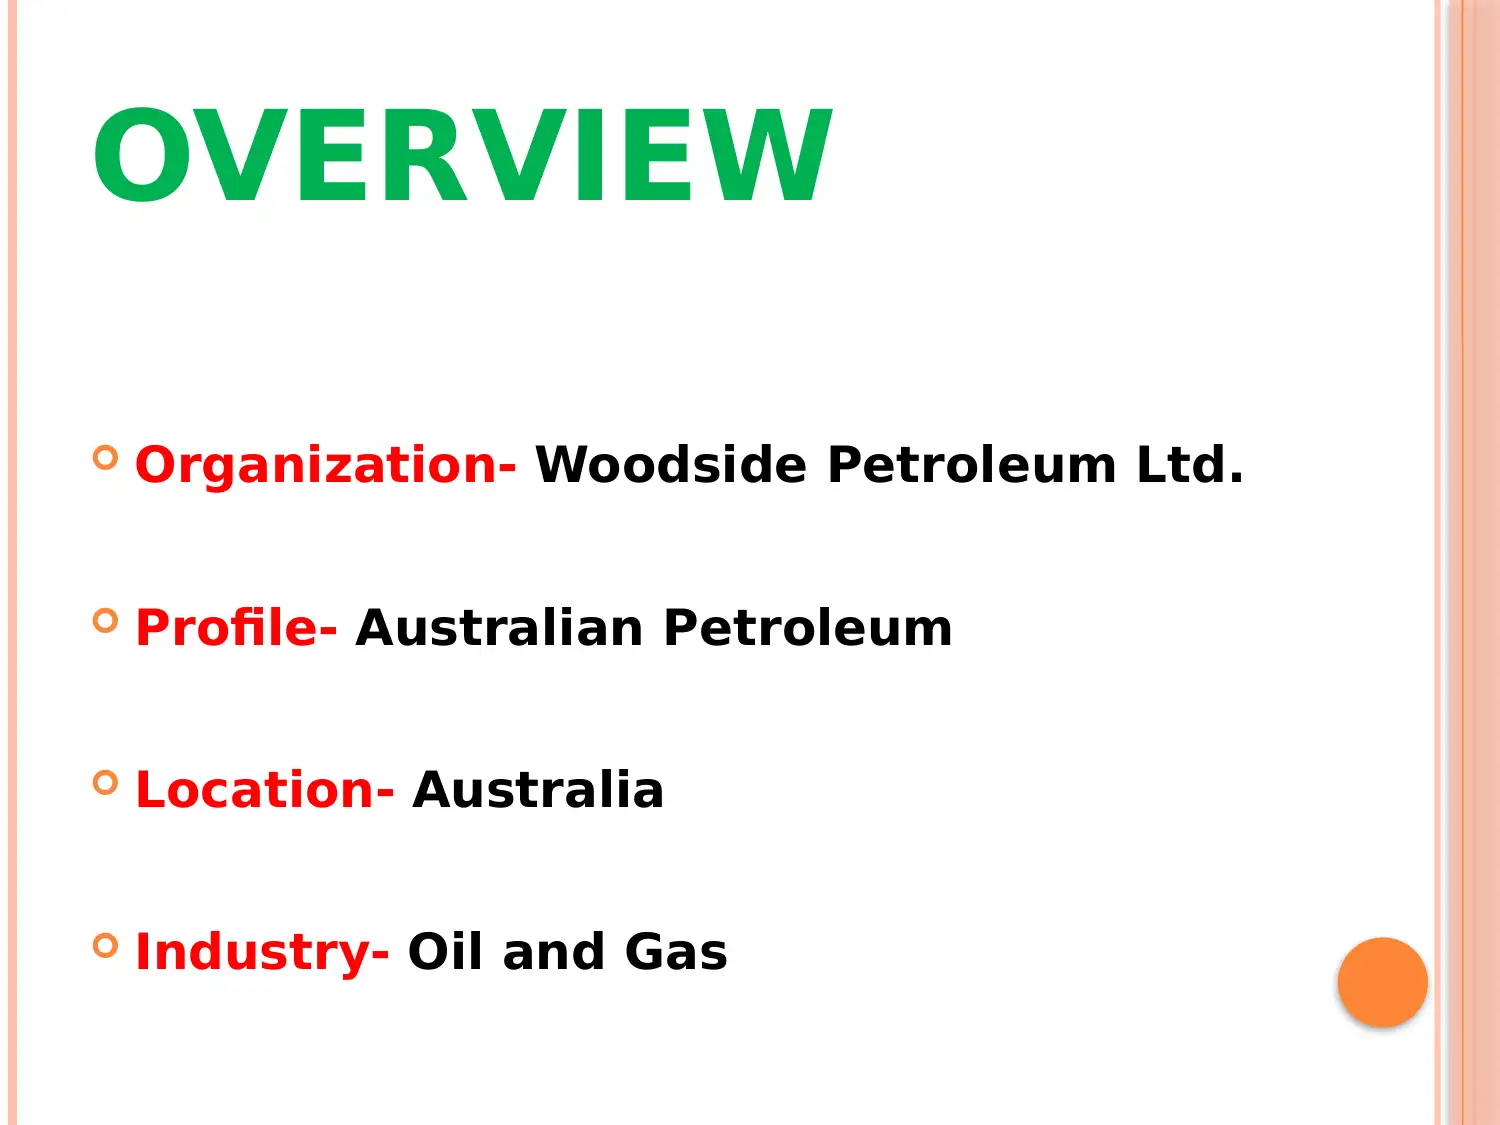
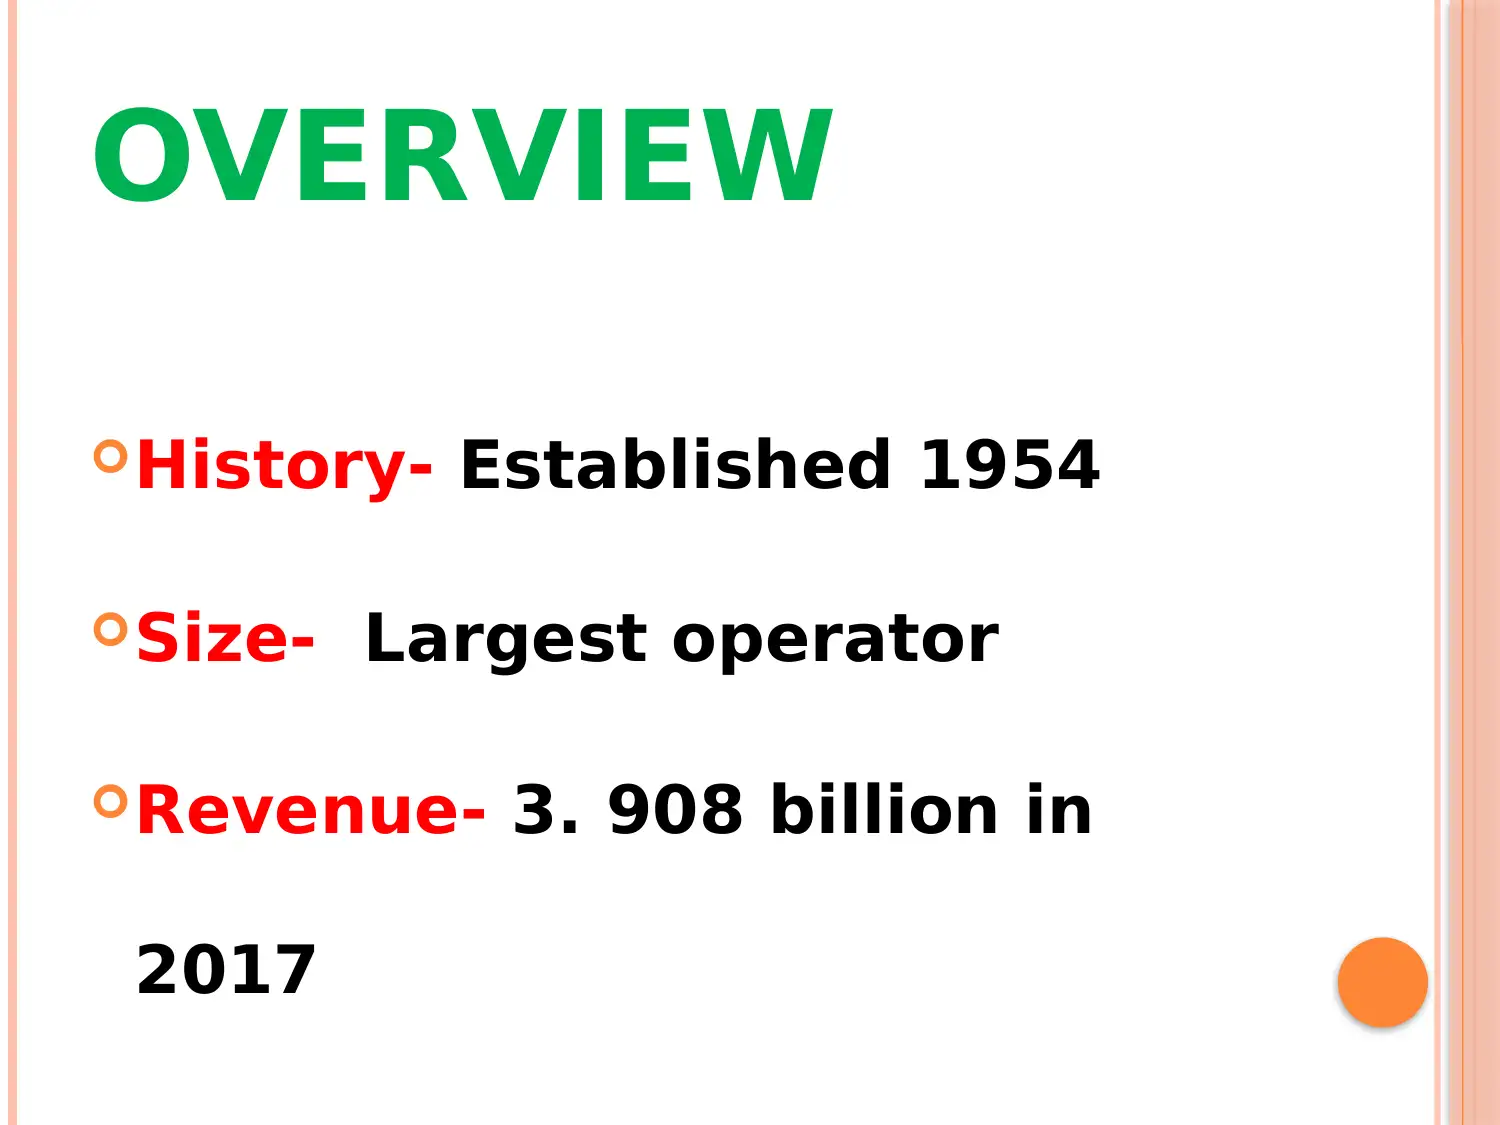
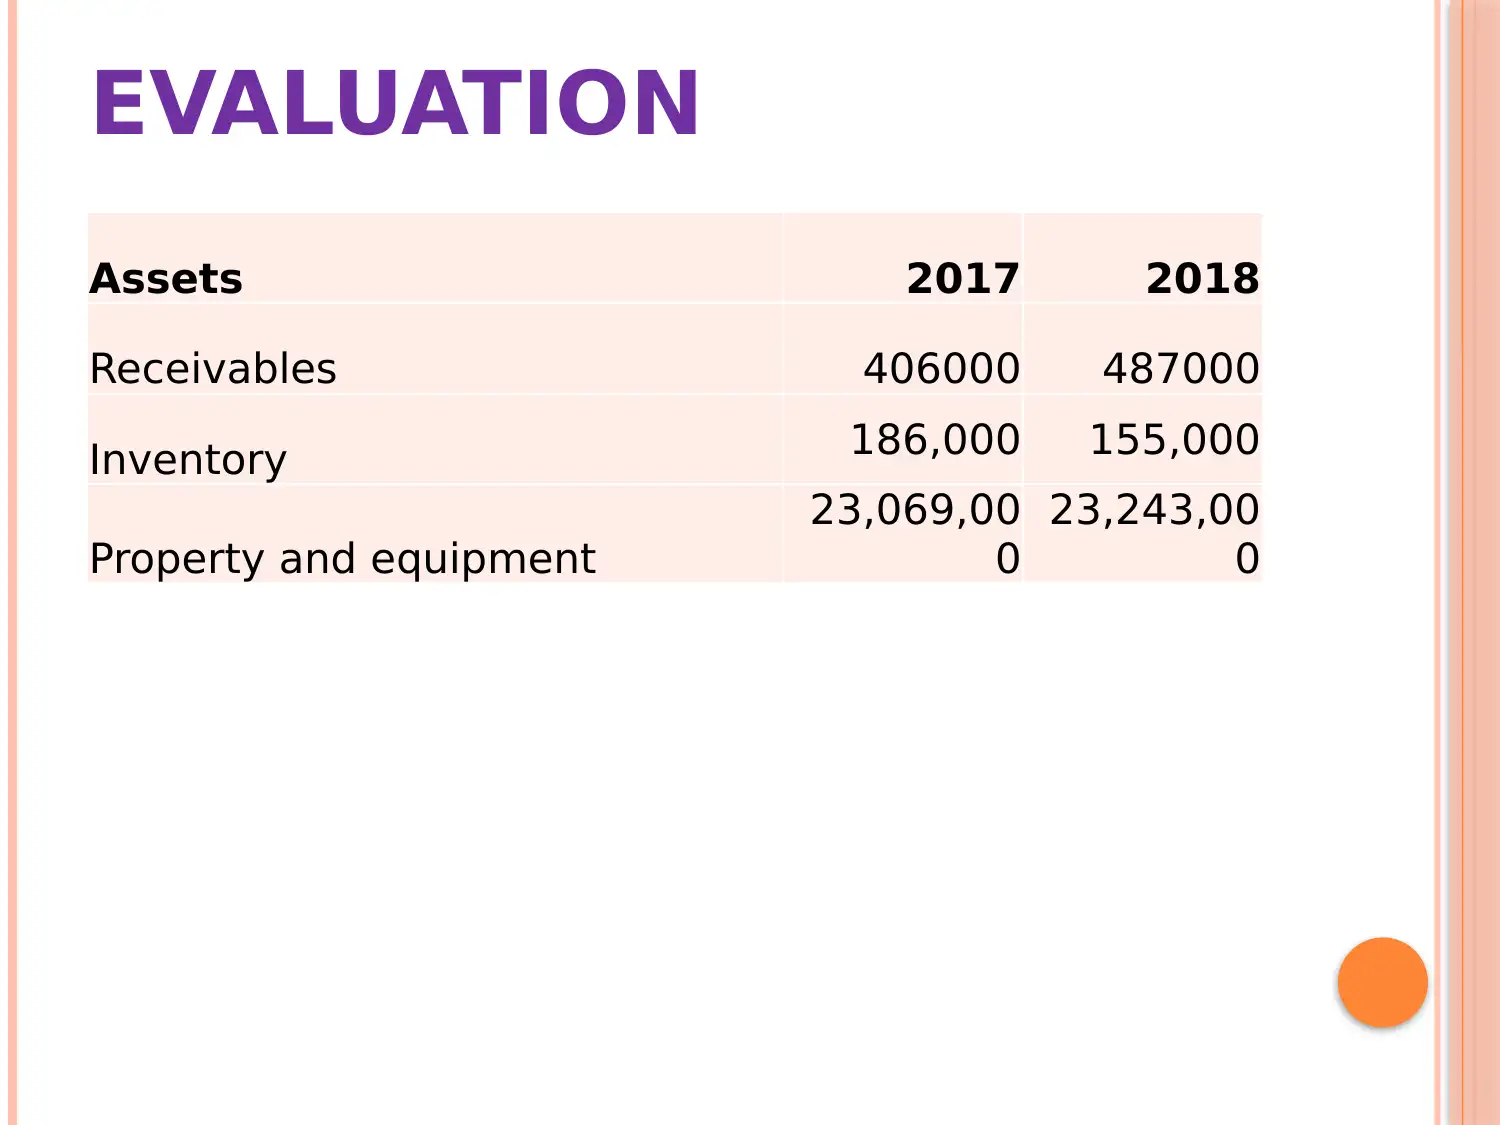
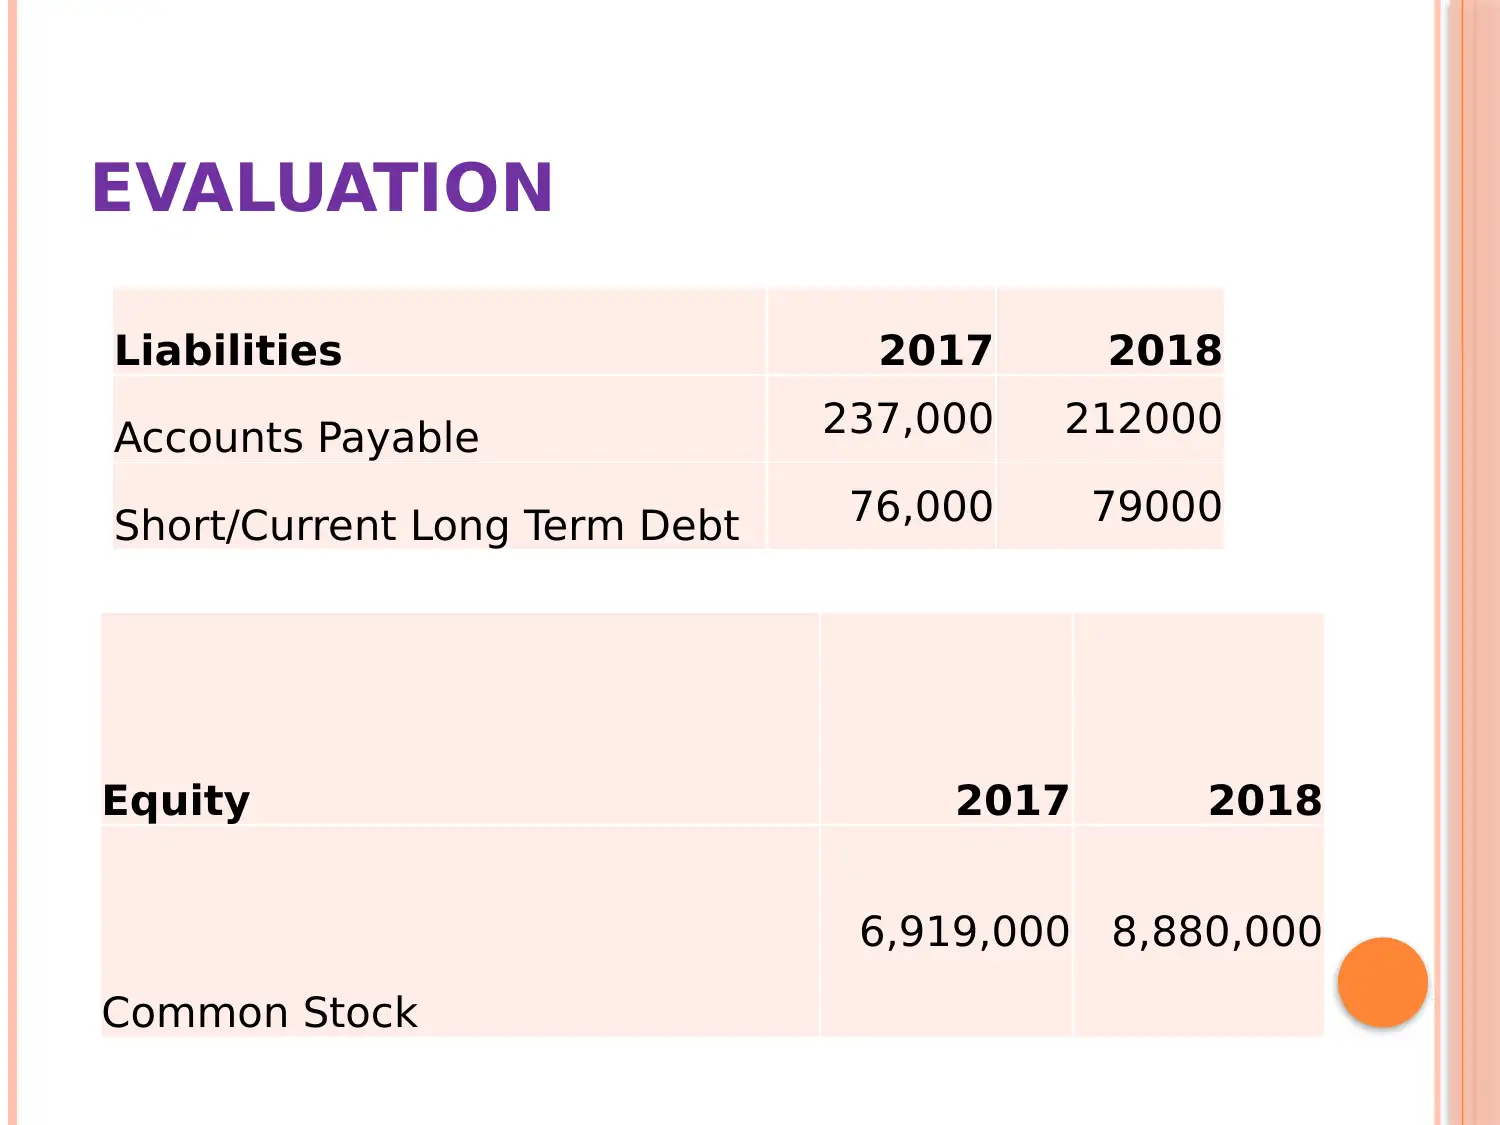
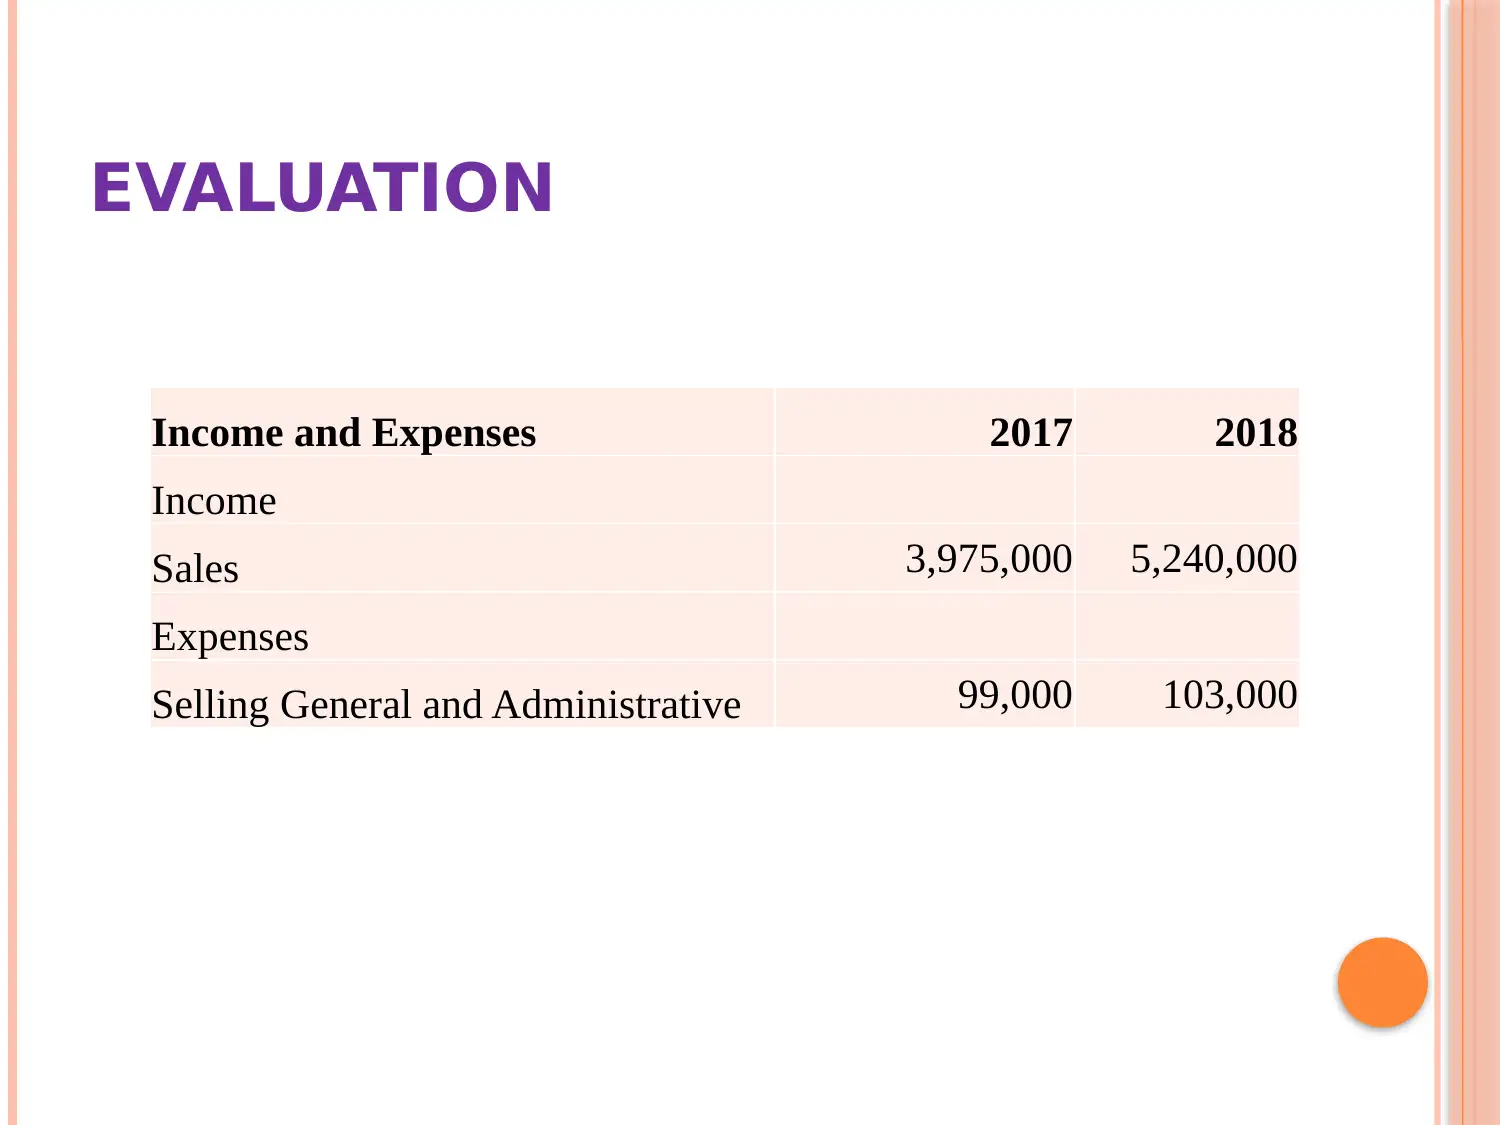
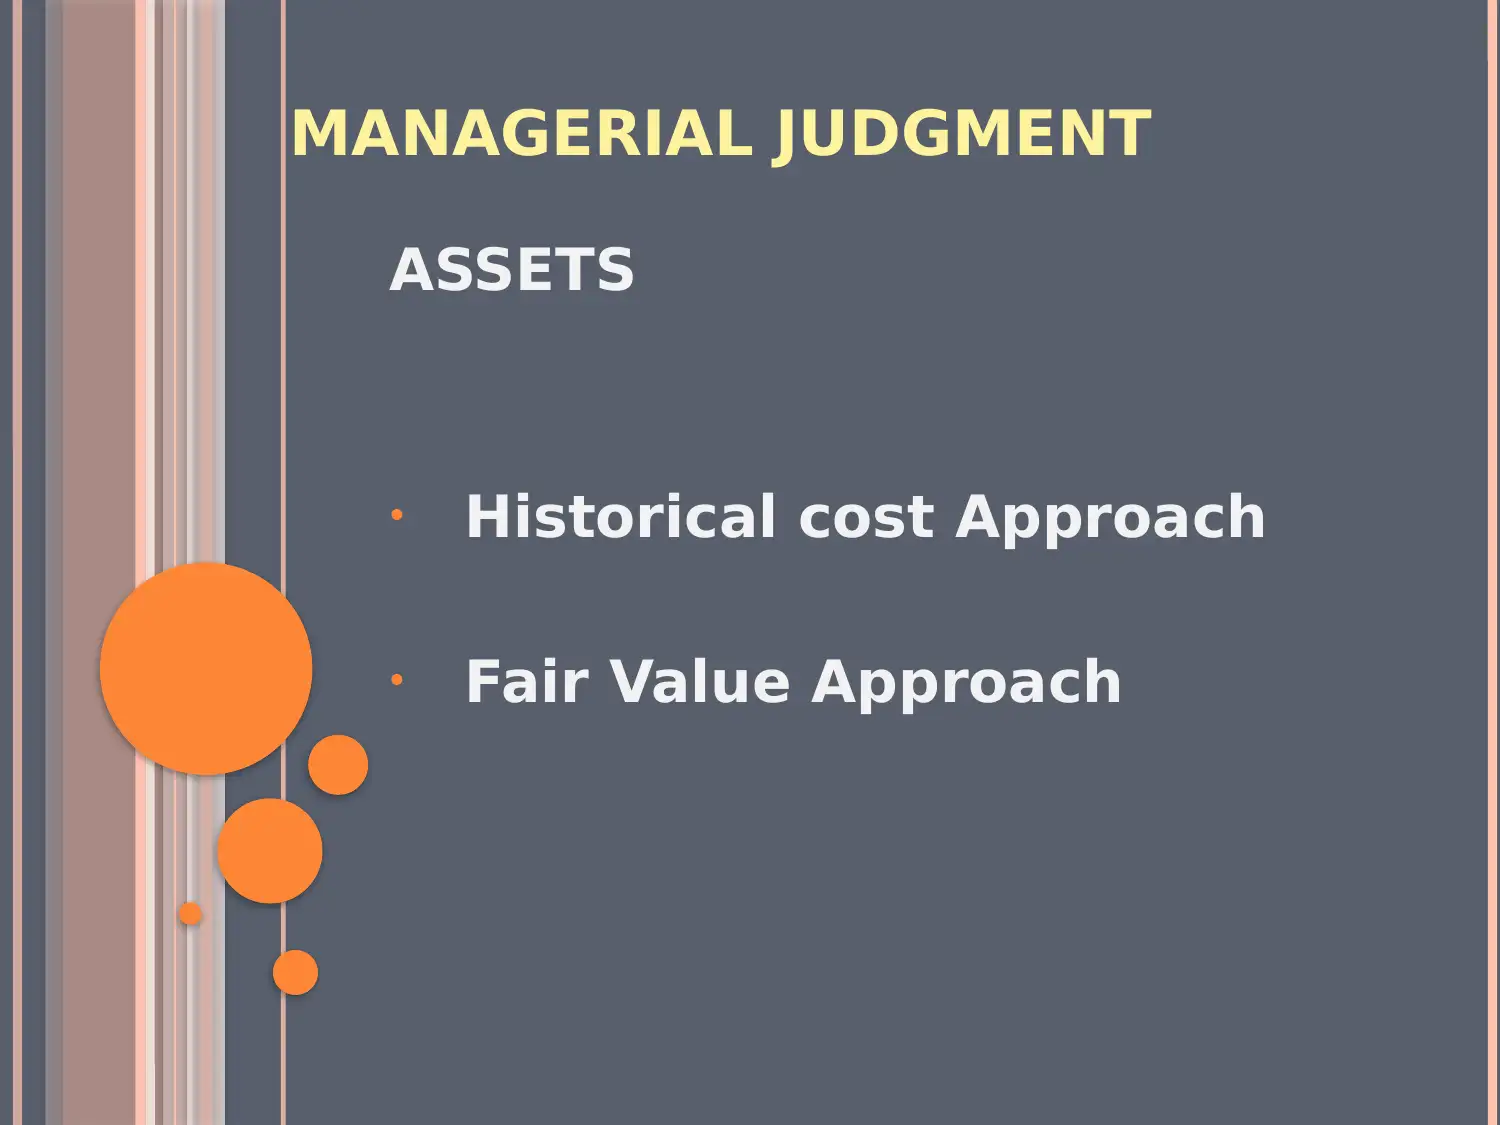
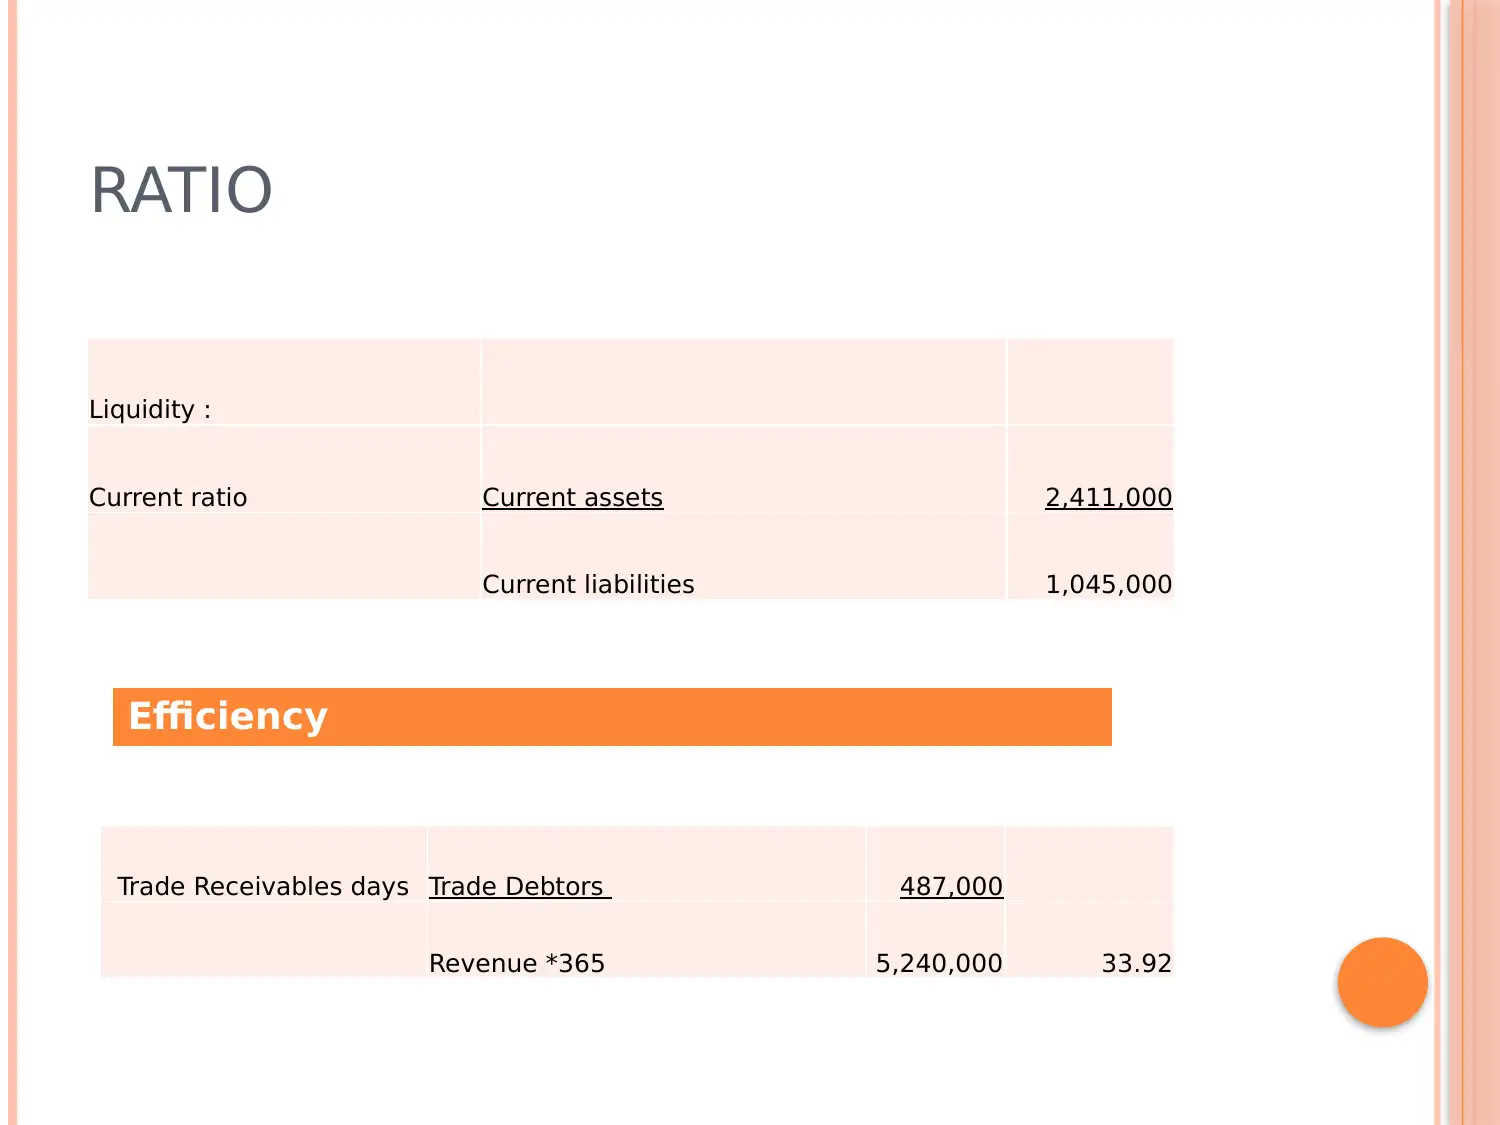
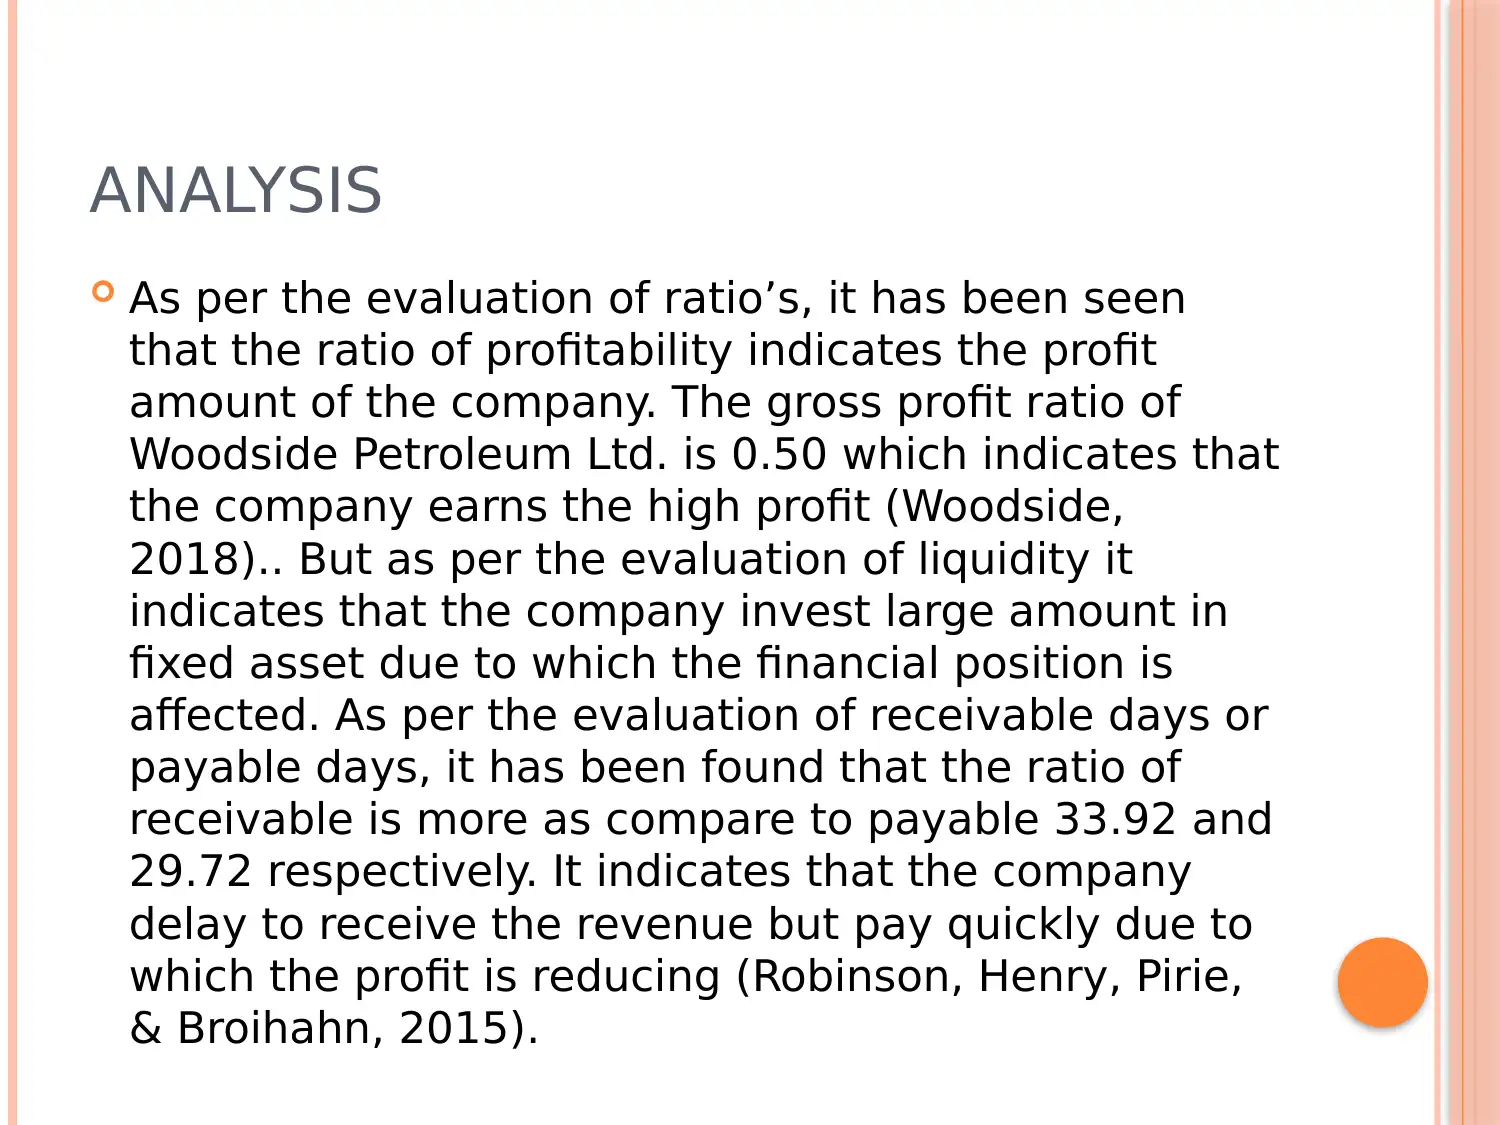
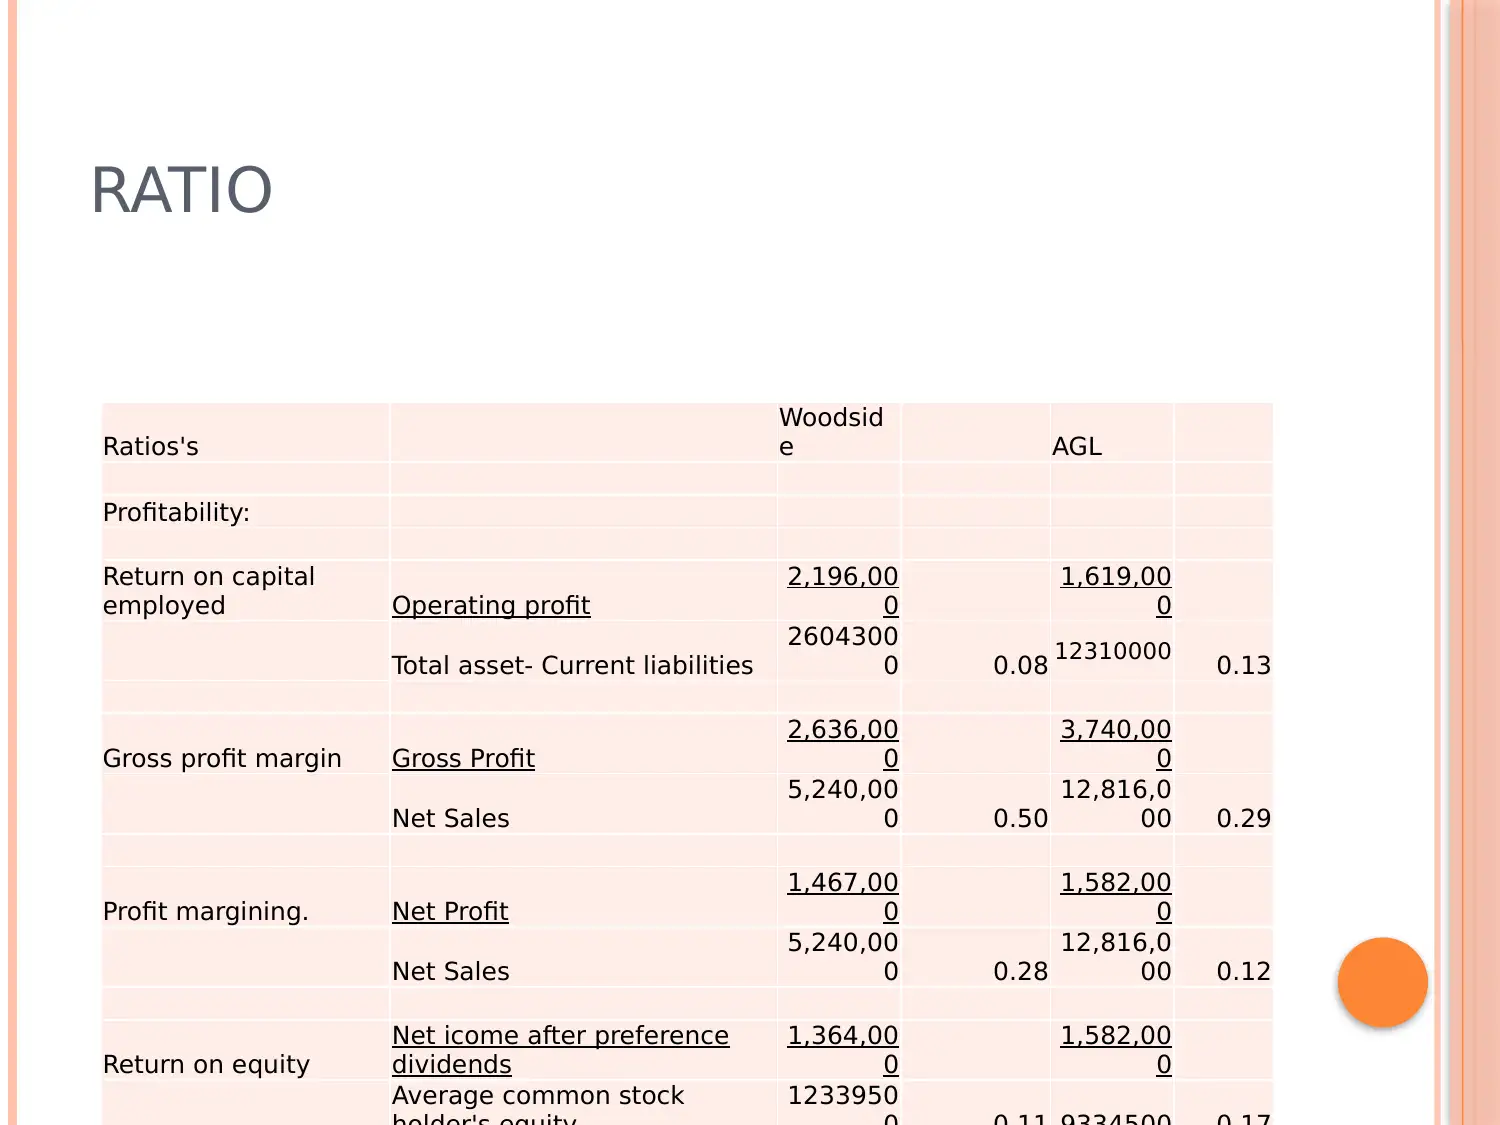
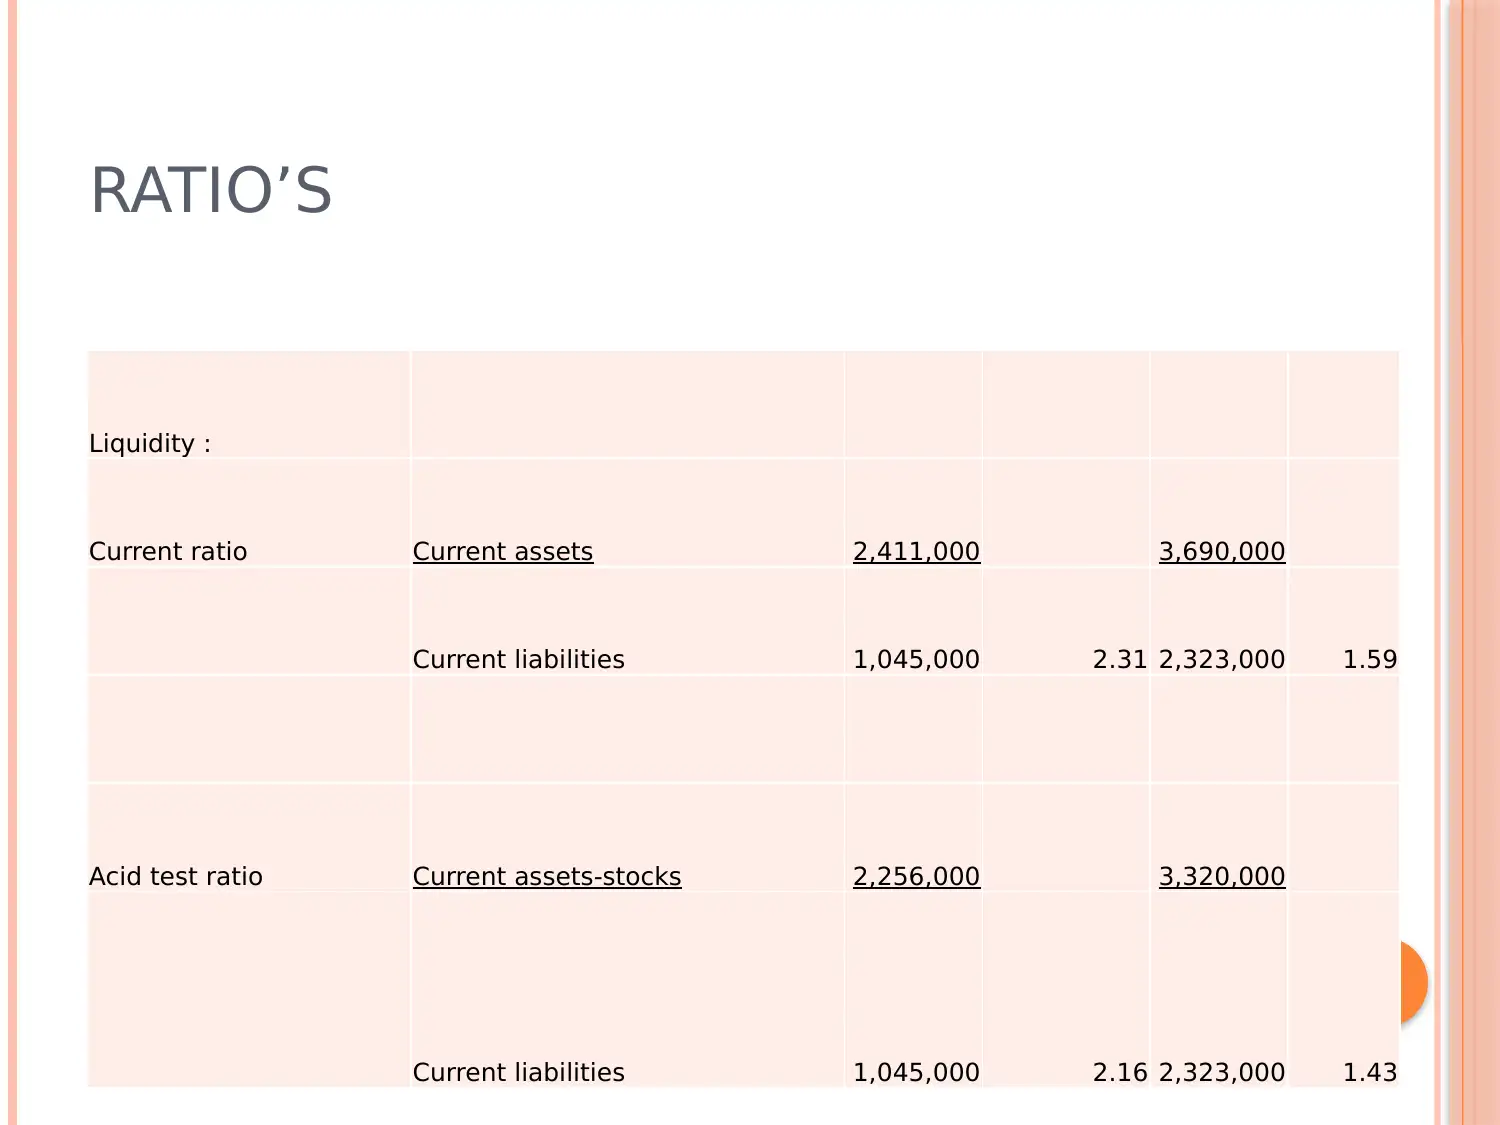
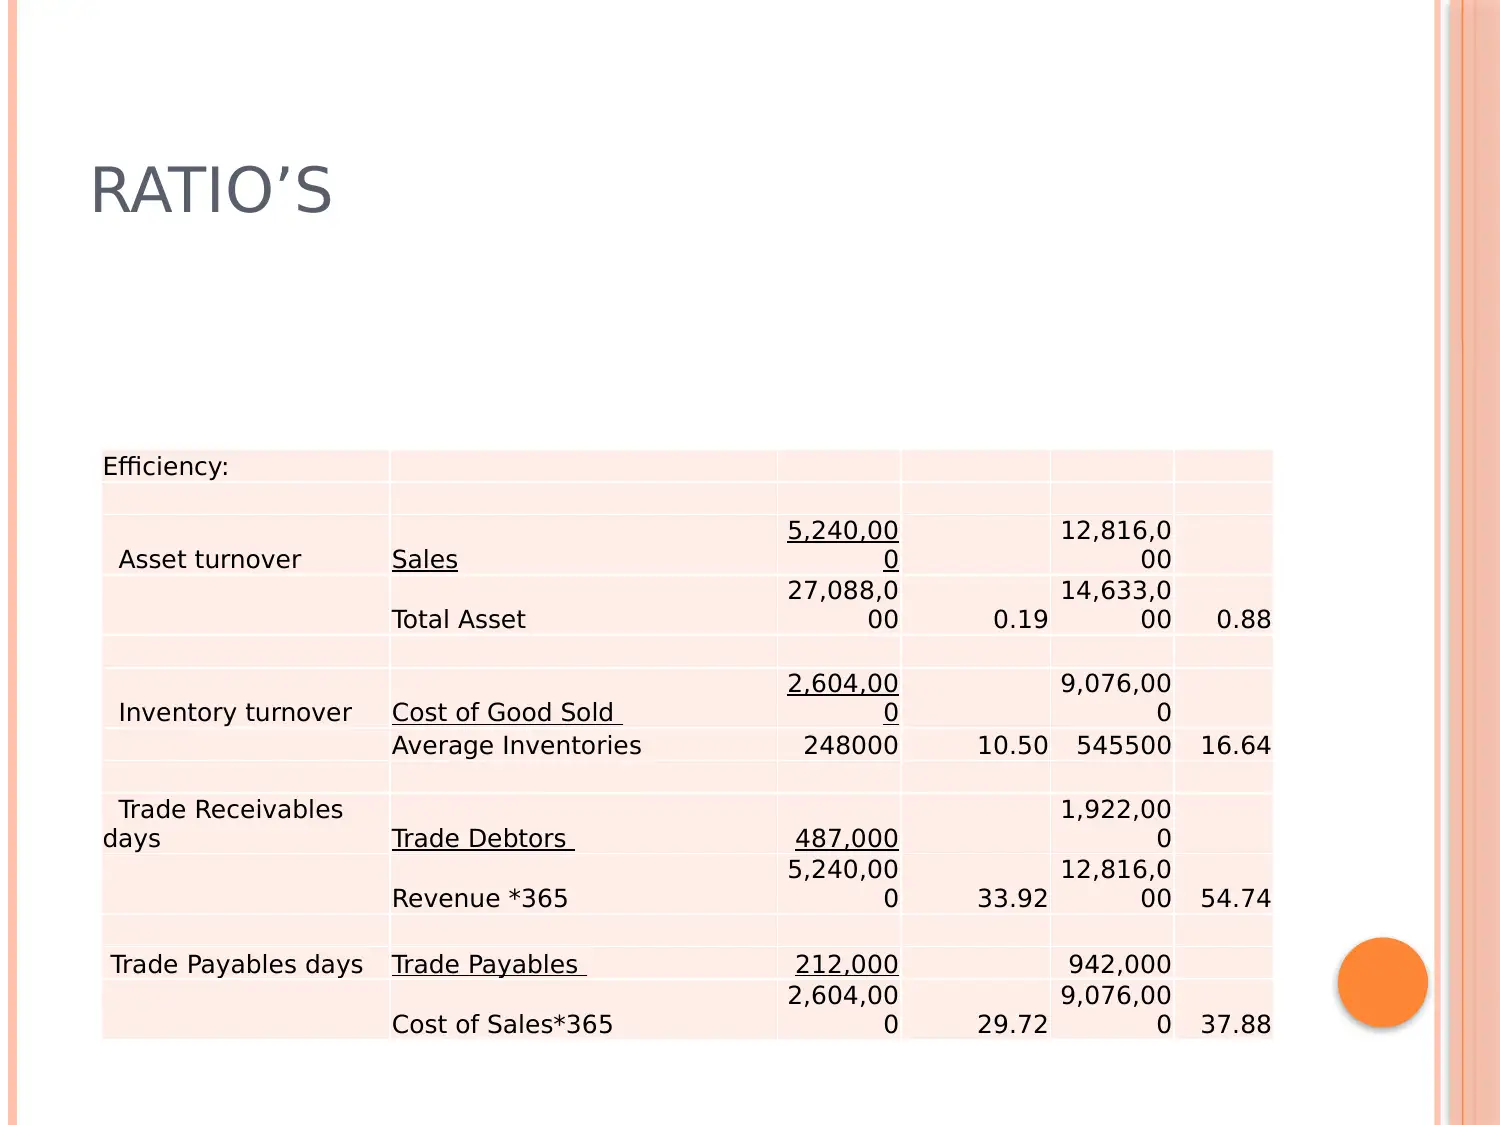
This report presents a financial analysis of Woodside Petroleum Ltd., evaluating its performance based on various financial ratios and comparing it with AGL. The analysis includes an overview of Woodside's history, size, and industry position, followed by an evaluation of its financial statements using historical cost and fair value approaches. The report focuses on key ratios such as profitability, liquidity, and efficiency, comparing Woodside's performance to AGL's in these areas. The profitability analysis highlights Woodside's strong gross profit margin, while the liquidity analysis reveals a significant investment in fixed assets. Efficiency is assessed through trade receivable and payable days, indicating Woodside's efficient collection of receivables. The report concludes by emphasizing Woodside's overall efficiency compared to AGL, supported by references to relevant financial literature and annual reports.
Document Page
WOODSIDE PETROLEUM
LTD.
tabler-icon-diamond-filled.svg

Paraphrase This Document

Need a fresh take? Get an instant paraphrase of this document with our AI Paraphraser
Document Page
OVERVIEW
Organization- Woodside Petroleum Ltd.
Profile- Australian Petroleum
Location- Australia
Industry- Oil and Gas
Document Page
OVERVIEW
History- Established 1954
Size- Largest operator
Revenue- 3. 908 billion in
2017
Document Page
EVALUATION
Assets 2017 2018
Receivables 406000 487000
Inventory 186,000 155,000
Property and equipment
23,069,00
0
23,243,00
0
tabler-icon-diamond-filled.svg

Paraphrase This Document

Need a fresh take? Get an instant paraphrase of this document with our AI Paraphraser
Document Page
EVALUATION
Equity 2017 2018
Common Stock
6,919,000 8,880,000
Liabilities 2017 2018
Accounts Payable 237,000 212000
Short/Current Long Term Debt 76,000 79000
Document Page
EVALUATION
Income and Expenses 2017 2018
Income
Sales 3,975,000 5,240,000
Expenses
Selling General and Administrative 99,000 103,000
Document Page
MANAGERIAL JUDGMENT
ASSETS
Historical cost Approach
Fair Value Approach
tabler-icon-diamond-filled.svg

Paraphrase This Document

Need a fresh take? Get an instant paraphrase of this document with our AI Paraphraser
Document Page
RATIO
Liquidity :
Current ratio Current assets 2,411,000
Current liabilities 1,045,000
Trade Receivables days Trade Debtors 487,000
Revenue *365 5,240,000 33.92
Efficiency
Document Page
ANALYSIS
As per the evaluation of ratio’s, it has been seen
that the ratio of profitability indicates the profit
amount of the company. The gross profit ratio of
Woodside Petroleum Ltd. is 0.50 which indicates that
the company earns the high profit (Woodside,
2018).. But as per the evaluation of liquidity it
indicates that the company invest large amount in
fixed asset due to which the financial position is
affected. As per the evaluation of receivable days or
payable days, it has been found that the ratio of
receivable is more as compare to payable 33.92 and
29.72 respectively. It indicates that the company
delay to receive the revenue but pay quickly due to
which the profit is reducing (Robinson, Henry, Pirie,
& Broihahn, 2015).
Document Page
RATIO
Ratios's
Woodsid
e AGL
Profitability:
Return on capital
employed Operating profit
2,196,00
0
1,619,00
0
Total asset- Current liabilities
2604300
0 0.08 12310000 0.13
Gross profit margin Gross Profit
2,636,00
0
3,740,00
0
Net Sales
5,240,00
0 0.50
12,816,0
00 0.29
Profit margining. Net Profit
1,467,00
0
1,582,00
0
Net Sales
5,240,00
0 0.28
12,816,0
00 0.12
Return on equity
Net icome after preference
dividends
1,364,00
0
1,582,00
0
Average common stock 1233950
tabler-icon-diamond-filled.svg

Paraphrase This Document

Need a fresh take? Get an instant paraphrase of this document with our AI Paraphraser
Document Page
RATIO’S
Liquidity :
Current ratio Current assets 2,411,000 3,690,000
Current liabilities 1,045,000 2.31 2,323,000 1.59
Acid test ratio Current assets-stocks 2,256,000 3,320,000
Current liabilities 1,045,000 2.16 2,323,000 1.43
Document Page
RATIO’S
Efficiency:
Asset turnover Sales
5,240,00
0
12,816,0
00
Total Asset
27,088,0
00 0.19
14,633,0
00 0.88
Inventory turnover Cost of Good Sold
2,604,00
0
9,076,00
0
Average Inventories 248000 10.50 545500 16.64
Trade Receivables
days Trade Debtors 487,000
1,922,00
0
Revenue *365
5,240,00
0 33.92
12,816,0
00 54.74
Trade Payables days Trade Payables 212,000 942,000
Cost of Sales*365
2,604,00
0 29.72
9,076,00
0 37.88
chevron_up_icon
1 out of 15
circle_padding
hide_on_mobile
zoom_out_icon
[object Object]