Woodside Petroleum Limited: A Comprehensive Financial Analysis Report
VerifiedAdded on 2022/12/21
|10
|3720
|85
Report
AI Summary
This report provides a detailed financial analysis of Woodside Petroleum Limited, a company listed on the Australian Stock Exchange. The analysis covers the company's business segments, goals, and risk characteristics, including systematic and unsystematic risks, as well as environmental and market risks. The report also delves into the concept of the time value of money, illustrating its application through an investment scenario involving Woodside's stock. Furthermore, it evaluates the company's financial performance over a three-year period, examining key financial statements such as the income statement and balance sheet, and highlighting trends in revenue, cost of revenue, operating expenses, and net income. The analysis includes a common-size statement to assess the company's financial health and growth trajectory, including its debt-to-equity ratio, reserves, and asset composition. The report concludes by summarizing the key findings and insights into Woodside Petroleum's financial performance.
Analysis of Woodside Petroleum Limited
Introduction
Woodside Petroleum is listed on Australian Stock Exchange and is one of the company under
ASX 2000. The company is engaged in exploration of oil and gas along with its development,
production and marketing. Woodside Petroleum has three business segment comprising of
production, development and trading and shipping activities. The production segment of the
company is in North West Shelf. Pluto Liquefied Natural Gas and Australia Oil.
Development segment consists of Floating Liquefied Natural Gas and Liquefied Natural Gas
(Wheatstone). Further, the marketing segment of the business comprise of major markets like
USA, Canada, Myanmar, Senegal and other countries. The company is the largest operator of
oil and gas production in entire Australia and also Australia’s largest independent and
dedicated oil company. The company is headquartered in Perth, Australia.
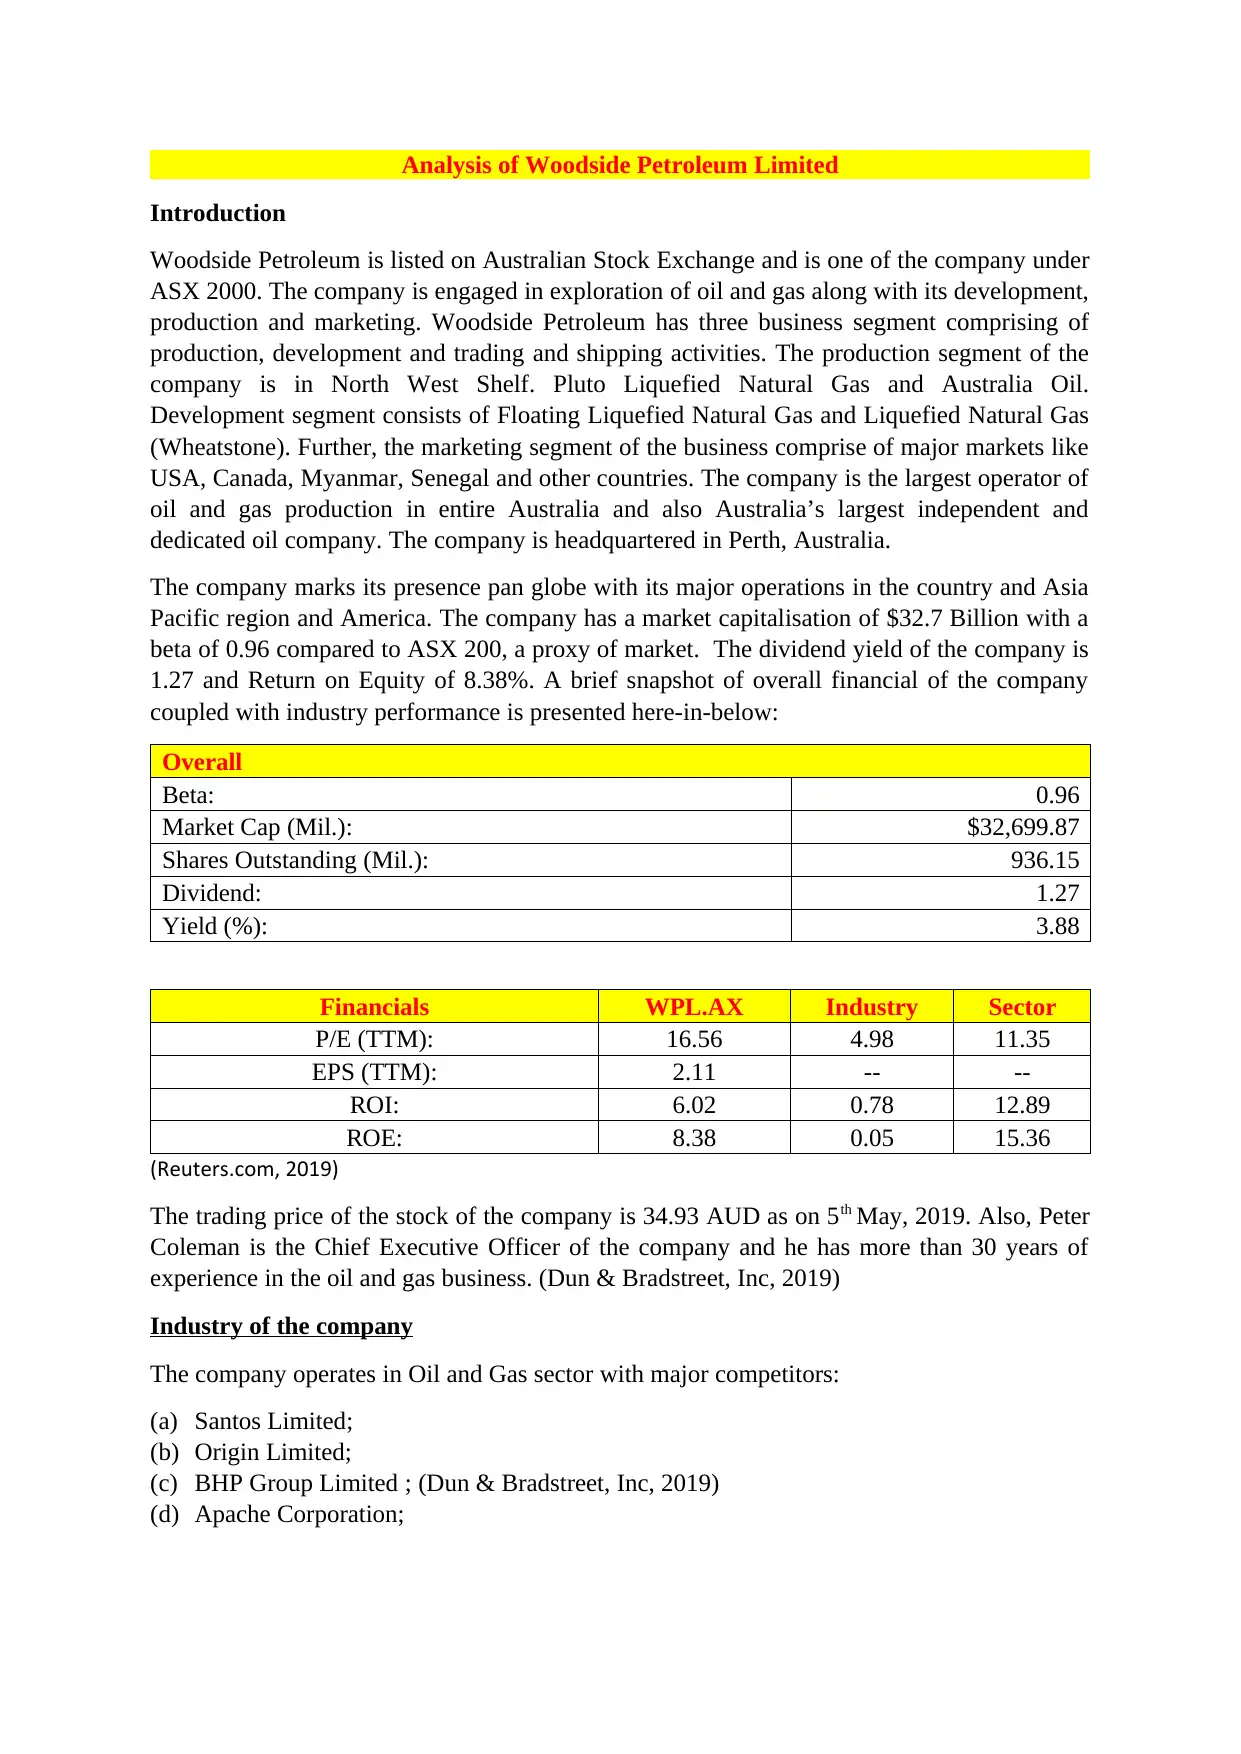
The company marks its presence pan globe with its major operations in the country and Asia
Pacific region and America. The company has a market capitalisation of $32.7 Billion with a
beta of 0.96 compared to ASX 200, a proxy of market. The dividend yield of the company is
1.27 and Return on Equity of 8.38%. A brief snapshot of overall financial of the company
coupled with industry performance is presented here-in-below:
Overall
Beta: 0.96
Market Cap (Mil.): $32,699.87
Shares Outstanding (Mil.): 936.15
Dividend: 1.27
Yield (%): 3.88
Financials WPL.AX Industry Sector
P/E (TTM): 16.56 4.98 11.35
EPS (TTM): 2.11 -- --
ROI: 6.02 0.78 12.89
ROE: 8.38 0.05 15.36
(Reuters.com, 2019)
The trading price of the stock of the company is 34.93 AUD as on 5th May, 2019. Also, Peter
Coleman is the Chief Executive Officer of the company and he has more than 30 years of
experience in the oil and gas business. (Dun & Bradstreet, Inc, 2019)
Industry of the company
The company operates in Oil and Gas sector with major competitors:
(a) Santos Limited;
(b) Origin Limited;
(c) BHP Group Limited ; (Dun & Bradstreet, Inc, 2019)
(d) Apache Corporation;
Introduction
Woodside Petroleum is listed on Australian Stock Exchange and is one of the company under
ASX 2000. The company is engaged in exploration of oil and gas along with its development,
production and marketing. Woodside Petroleum has three business segment comprising of
production, development and trading and shipping activities. The production segment of the
company is in North West Shelf. Pluto Liquefied Natural Gas and Australia Oil.
Development segment consists of Floating Liquefied Natural Gas and Liquefied Natural Gas
(Wheatstone). Further, the marketing segment of the business comprise of major markets like
USA, Canada, Myanmar, Senegal and other countries. The company is the largest operator of
oil and gas production in entire Australia and also Australia’s largest independent and
dedicated oil company. The company is headquartered in Perth, Australia.
The company marks its presence pan globe with its major operations in the country and Asia
Pacific region and America. The company has a market capitalisation of $32.7 Billion with a
beta of 0.96 compared to ASX 200, a proxy of market. The dividend yield of the company is
1.27 and Return on Equity of 8.38%. A brief snapshot of overall financial of the company
coupled with industry performance is presented here-in-below:
Overall
Beta: 0.96
Market Cap (Mil.): $32,699.87
Shares Outstanding (Mil.): 936.15
Dividend: 1.27
Yield (%): 3.88
Financials WPL.AX Industry Sector
P/E (TTM): 16.56 4.98 11.35
EPS (TTM): 2.11 -- --
ROI: 6.02 0.78 12.89
ROE: 8.38 0.05 15.36
(Reuters.com, 2019)
The trading price of the stock of the company is 34.93 AUD as on 5th May, 2019. Also, Peter
Coleman is the Chief Executive Officer of the company and he has more than 30 years of
experience in the oil and gas business. (Dun & Bradstreet, Inc, 2019)
Industry of the company
The company operates in Oil and Gas sector with major competitors:
(a) Santos Limited;
(b) Origin Limited;
(c) BHP Group Limited ; (Dun & Bradstreet, Inc, 2019)
(d) Apache Corporation;
Paraphrase This Document
Need a fresh take? Get an instant paraphrase of this document with our AI Paraphraser
(Dun & Bradstreet, Inc, 2019)
Goals of the company
The major goals of the company is to create an enduring value for the shareholders with
superior returns across three distinct time horizon i.e
(a) Horizon 1 comprising of 2017-2021 wherein the company seeks to explore new revenue
streams, expanding the LNG market, exploration and acquisition for inorganic growth.
(b) Horizon 2 comprising of 2022-2026 wherein the company seeks to explore new revenue
streams, leverage existing infrastructure and increase supply to the existing market and
customer
(c) Horizon 3 starts from 2027 and has no end period wherein the company seeks to make
capital efficient development and explore new major hubs for business.
These are the major steps through which the company seeks to develop the market and
increase the return to shareholders. (Woodside, 2019)
Analysis
Risk Characteristic of the company
Systematic risk refers to the risk which cannot be diversified and shall always be present
while unsystematic risk refers to the risk which accrue on account of unplanned activity.
Woodside Limited is engaged in business of oil exploration which is subject to large
environmental impacts. As a result, lot of precautionary measures are required to be taken by
the company to be in compliance with various environmental risk
Second, the business of oil and gas is majorly an oligopoly market and prices are determines
by cartel running in Middle East. The huge volatility in the prices of oil and gas creates a
deep impact on the profitability of the business.
The third risk that underlines the company is the declining reserves of oil and gas in the
disposal of company on account of scarcity. The company had approximately 14 years of
reserve life as on 2015. (Pearson, 2019)
Changing climate also has significant impact on the business which shall impact the oil
reserves in the globe.
Other risk which are natural to every business includes currency risk, credit risk and market
risk etc.
Time Value of Money
The concept of time value revolves around the fundamental that money in hand today is of
higher worth than money in hand tomorrow. The concept is based on inflation and risk.
Further, it is believed static money value decrease with period of time on account of inflation
and earning capacity of money.
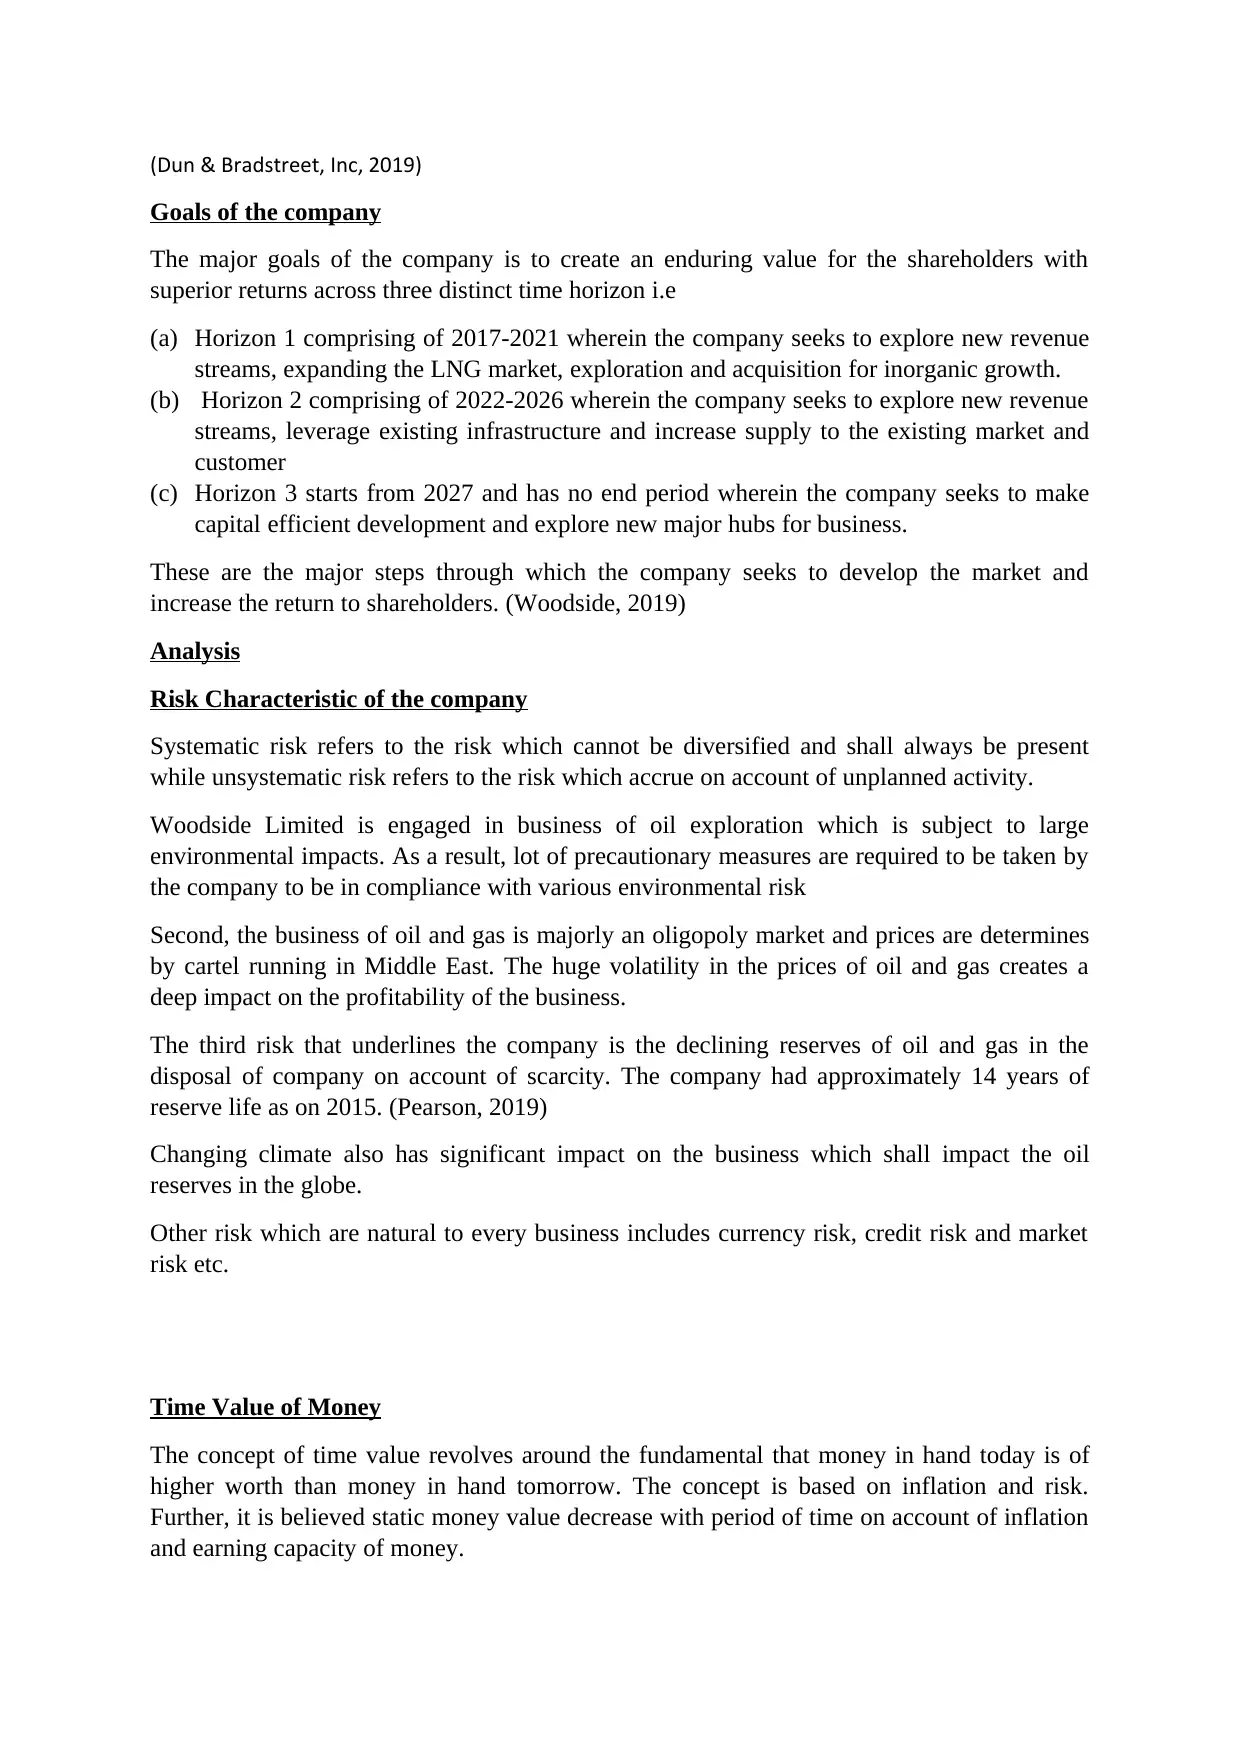
The concept of time value of money is the core of finance and states that money in hand can
be invested to earn interest, dividend etc. The key terms that are used in the theory of time
value of money has been detailed as under:
(a) Present Value of Money: It represents the worth today;
(b) Future Value of Money: It represents the future worth of the present money;
(c) Interest: the rate generally the return on treasury securities is considered.
In case of Woodside Limited, if $ 100 has been invested three years ago, the same would
have resulted in the following:
Particulars Amount
Notional Principal 100
price on 05-05-16 23.63
No of shares 4.231909
Value on 02-05-19 34.93
Capital Appreciation 147.8
Dividend paid per share 4.34
Total dividend 18.36648
Total Capital on 02-05-2019 166.2
Return 66%
Return on treasury securities 2.29%
Return in 3 years 7.03%
(Verizon Media, 2019)
Thus, on the basis of above, it can be inferred that the stock investment on the shares of Orica
Limited has generated a 66% return over the period of three years compared to a meagre 7%
return in the treasury securities over the period. Thus, the company has been able to retain the
time value of money for the investors.
Further, the said concept can also be used for determining the future cash flows and
determining the present value of the company on the basis of computing free cash flow of
equity of the company for future years. The computation shall involve computing the
estimated growth rate of the company for future years and the stable growth rate, Post above,
computing of required rate of return on equity. Accordingly, the method can be applied to
determine the value of the company and the future prospects.
However, the above concept is equally proved in the above case wherein the investor has
earned a return higher than the return on treasury securities.
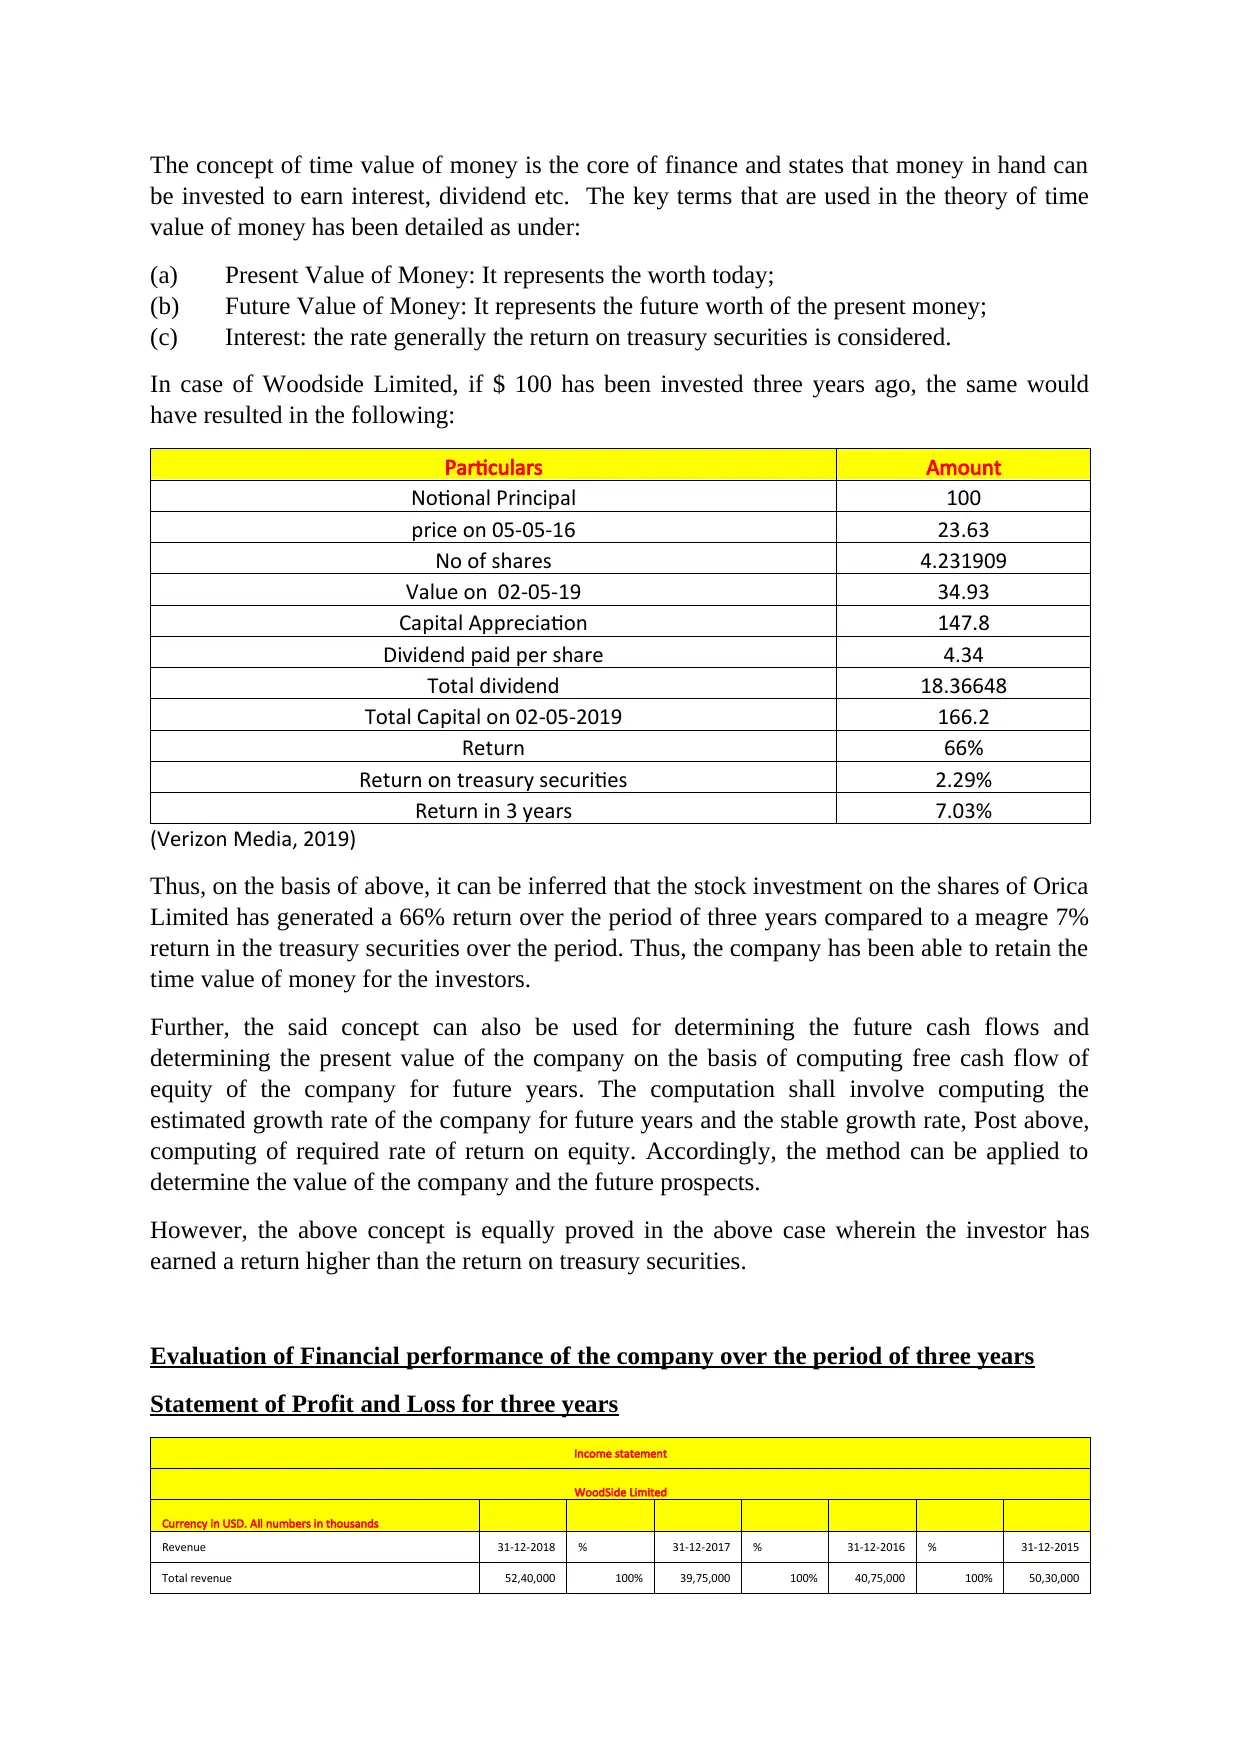
Evaluation of Financial performance of the company over the period of three years
Statement of Profit and Loss for three years
Income statement
WoodSide Limited
Currency in USD. All numbers in thousands
Revenue 31-12-2018 % 31-12-2017 % 31-12-2016 % 31-12-2015
Total revenue 52,40,000 100% 39,75,000 100% 40,75,000 100% 50,30,000
be invested to earn interest, dividend etc. The key terms that are used in the theory of time
value of money has been detailed as under:
(a) Present Value of Money: It represents the worth today;
(b) Future Value of Money: It represents the future worth of the present money;
(c) Interest: the rate generally the return on treasury securities is considered.
In case of Woodside Limited, if $ 100 has been invested three years ago, the same would
have resulted in the following:
Particulars Amount
Notional Principal 100
price on 05-05-16 23.63
No of shares 4.231909
Value on 02-05-19 34.93
Capital Appreciation 147.8
Dividend paid per share 4.34
Total dividend 18.36648
Total Capital on 02-05-2019 166.2
Return 66%
Return on treasury securities 2.29%
Return in 3 years 7.03%
(Verizon Media, 2019)
Thus, on the basis of above, it can be inferred that the stock investment on the shares of Orica
Limited has generated a 66% return over the period of three years compared to a meagre 7%
return in the treasury securities over the period. Thus, the company has been able to retain the
time value of money for the investors.
Further, the said concept can also be used for determining the future cash flows and
determining the present value of the company on the basis of computing free cash flow of
equity of the company for future years. The computation shall involve computing the
estimated growth rate of the company for future years and the stable growth rate, Post above,
computing of required rate of return on equity. Accordingly, the method can be applied to
determine the value of the company and the future prospects.
However, the above concept is equally proved in the above case wherein the investor has
earned a return higher than the return on treasury securities.
Evaluation of Financial performance of the company over the period of three years
Statement of Profit and Loss for three years
Income statement
WoodSide Limited
Currency in USD. All numbers in thousands
Revenue 31-12-2018 % 31-12-2017 % 31-12-2016 % 31-12-2015
Total revenue 52,40,000 100% 39,75,000 100% 40,75,000 100% 50,30,000
⊘ This is a preview!⊘
Do you want full access?
Subscribe today to unlock all pages.
Trusted by 1+ million students worldwide
Cost of revenue 26,04,000 50% 20,83,000 52% 22,34,000 55% 30,73,000
Gross profit 26,36,000 50% 18,92,000 48% 18,41,000 45% 19,57,000
Operating expenses
Research development - - - -
Selling general and administrative 1,03,000 2% 99,000 2% 1,33,000 3% 28,000
Non-recurring - - - -
Others 90,000 2% 57,000 1% 1,25,000 3% 80,000
Total operating expenses 30,44,000 58% 24,36,000 61% 27,83,000 68% 46,66,000
Operating income or loss 21,96,000 42% 15,39,000 39% 12,92,000 32% 3,64,000
Income from continuing operations
Total other income/expenses net -1,01,000 -2% 91,000 2% 48,000 1% -8,000
Earnings before interest and taxes 21,96,000 42% 15,39,000 39% 12,92,000 32% 3,64,000
Interest expense -1,47,000 -3% -35,000 -1% -35,000 -1% -22,000
Income before tax 20,95,000 40% 16,30,000 41% 13,40,000 33% 3,56,000
Income tax expense 6,28,000 12% 4,65,000 12% 3,67,000 9% 2,43,000
Minority interest 8,33,000 16% 8,30,000 21% 8,23,000 20% 7,99,000
Net income from continuing ops 14,67,000 28% 11,65,000 29% 9,73,000 24% 1,13,000
Non-recurring events
Discontinued operations - - - -
Extraordinary items - - - -
Effect of accounting changes - - - -
Other items - - - -
Net income
Net income 13,64,000 26% 10,69,000 27% 8,68,000 21% 26,000
Preferred stock and other adjustments - - - -
Net income applicable to common shares 13,64,000 26% 10,69,000 27% 8,68,000 21% 26,000
Paraphrase This Document
Need a fresh take? Get an instant paraphrase of this document with our AI Paraphraser
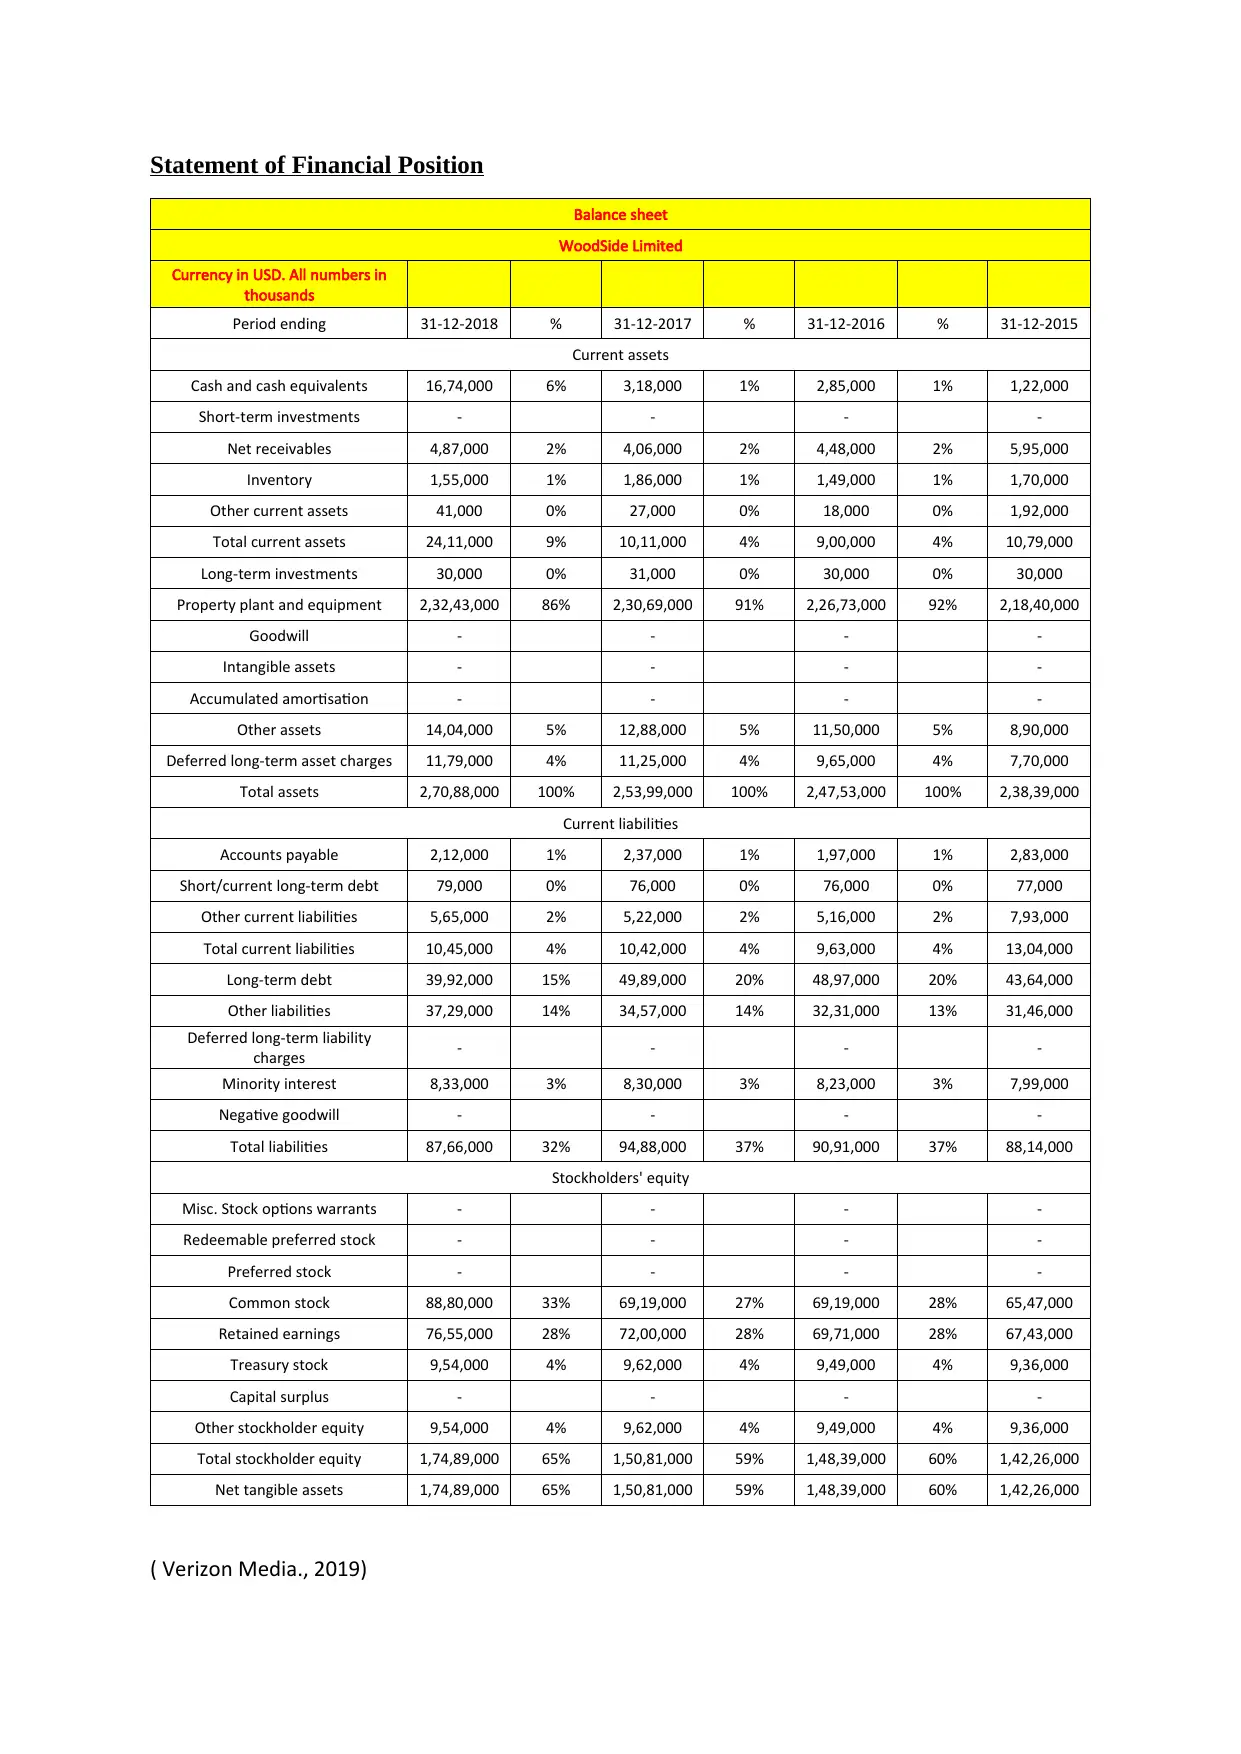
Statement of Financial Position
Balance sheet
WoodSide Limited
Currency in USD. All numbers in
thousands
Period ending 31-12-2018 % 31-12-2017 % 31-12-2016 % 31-12-2015
Current assets
Cash and cash equivalents 16,74,000 6% 3,18,000 1% 2,85,000 1% 1,22,000
Short-term investments - - - -
Net receivables 4,87,000 2% 4,06,000 2% 4,48,000 2% 5,95,000
Inventory 1,55,000 1% 1,86,000 1% 1,49,000 1% 1,70,000
Other current assets 41,000 0% 27,000 0% 18,000 0% 1,92,000
Total current assets 24,11,000 9% 10,11,000 4% 9,00,000 4% 10,79,000
Long-term investments 30,000 0% 31,000 0% 30,000 0% 30,000
Property plant and equipment 2,32,43,000 86% 2,30,69,000 91% 2,26,73,000 92% 2,18,40,000
Goodwill - - - -
Intangible assets - - - -
Accumulated amortisation - - - -
Other assets 14,04,000 5% 12,88,000 5% 11,50,000 5% 8,90,000
Deferred long-term asset charges 11,79,000 4% 11,25,000 4% 9,65,000 4% 7,70,000
Total assets 2,70,88,000 100% 2,53,99,000 100% 2,47,53,000 100% 2,38,39,000
Current liabilities
Accounts payable 2,12,000 1% 2,37,000 1% 1,97,000 1% 2,83,000
Short/current long-term debt 79,000 0% 76,000 0% 76,000 0% 77,000
Other current liabilities 5,65,000 2% 5,22,000 2% 5,16,000 2% 7,93,000
Total current liabilities 10,45,000 4% 10,42,000 4% 9,63,000 4% 13,04,000
Long-term debt 39,92,000 15% 49,89,000 20% 48,97,000 20% 43,64,000
Other liabilities 37,29,000 14% 34,57,000 14% 32,31,000 13% 31,46,000
Deferred long-term liability
charges - - - -
Minority interest 8,33,000 3% 8,30,000 3% 8,23,000 3% 7,99,000
Negative goodwill - - - -
Total liabilities 87,66,000 32% 94,88,000 37% 90,91,000 37% 88,14,000
Stockholders' equity
Misc. Stock options warrants - - - -
Redeemable preferred stock - - - -
Preferred stock - - - -
Common stock 88,80,000 33% 69,19,000 27% 69,19,000 28% 65,47,000
Retained earnings 76,55,000 28% 72,00,000 28% 69,71,000 28% 67,43,000
Treasury stock 9,54,000 4% 9,62,000 4% 9,49,000 4% 9,36,000
Capital surplus - - - -
Other stockholder equity 9,54,000 4% 9,62,000 4% 9,49,000 4% 9,36,000
Total stockholder equity 1,74,89,000 65% 1,50,81,000 59% 1,48,39,000 60% 1,42,26,000
Net tangible assets 1,74,89,000 65% 1,50,81,000 59% 1,48,39,000 60% 1,42,26,000
( Verizon Media., 2019)
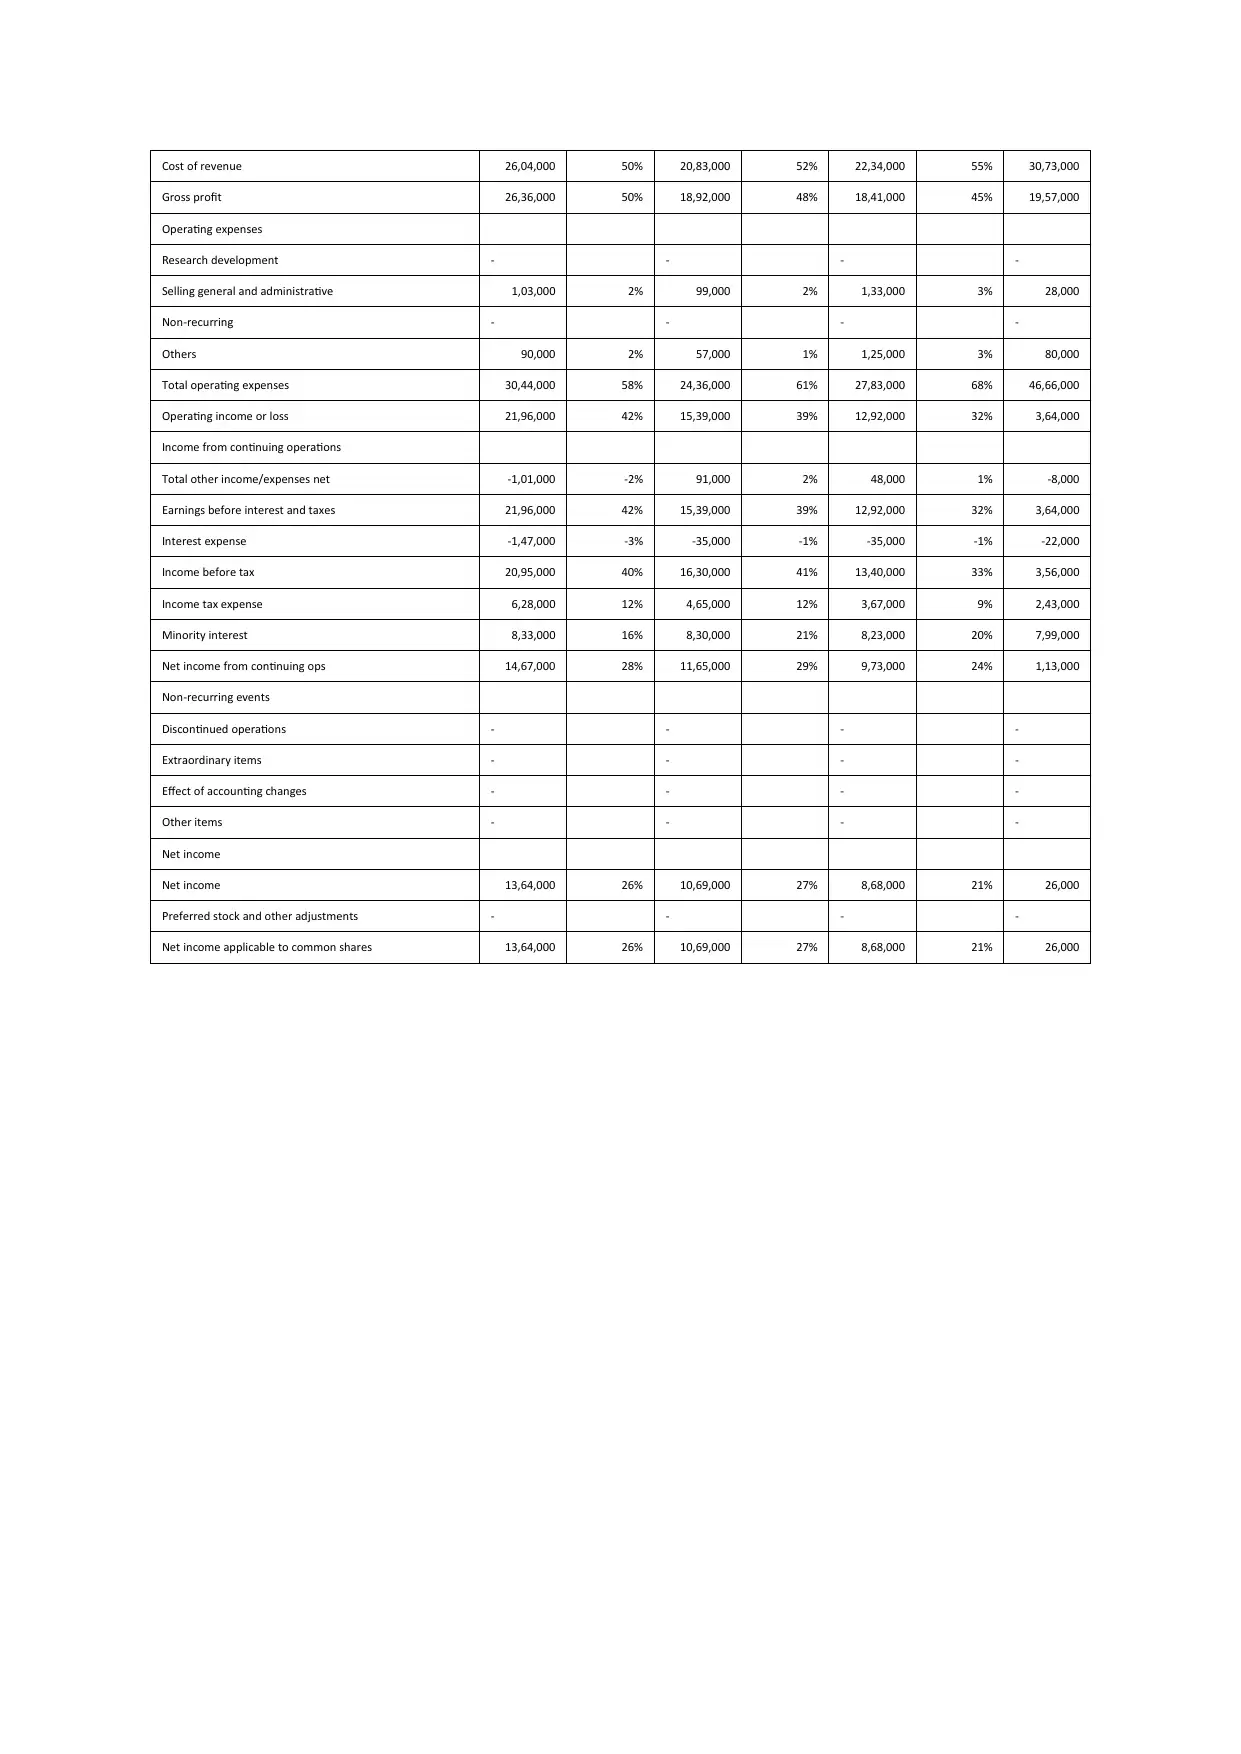
On perusal of the common size statement of financial statement of the company, it can be
understood the following:
(a) Gross profit of the company has shown an upsurge from 45% to 50% in the period of
three years which is a good sign for the company as it is able to control its direct cost
very effective on year on year basis.
(b) Net Income of the company has increase from 21% to 26% in the period of three years
which is a good sign for the company as it is able to control its direct and indirect cost
very effective on year on year basis.
(c) Sales of the company has grown by approximately over 20% in the period of three years
which is a good sign for the company. Thus, the company is able to expand its business
rapidly;
(d) Operating Income of the company has increase from 32% to 42% in the period of three
years which is a good sign for the company as it is able to control its operating cost very
effective on year on year basis.
(e) Interest expense of the company has seen a sharp surge which is not good but benefit of
trading of equity shall be available to company;
(f) Current Asset form 9% of total asset of the company while current liability of the
company forms 4% of total asset , thus current ratio of the company is high which is
good for the company;
(g) Return on Asset of the company of the company has increased from 4% to 5% over the
year. Thus, the company has been on a good growth trajectory.
(h) Company is funded by 65% by equity and 35% by debt which symbolise that company is
not highly leveraged. Thus the debt to equity ratio of company is 0.5 to 1 which is below
the ideal ratio of 2:1;
(i) The company has huge amount of reserves and reserve forms 28% of total asset of the
company implying company has earned huge reserves over the years.
(j) Fixed assets of the company forms a major part of the assets of the company implying
that company has huge assets under its hold.
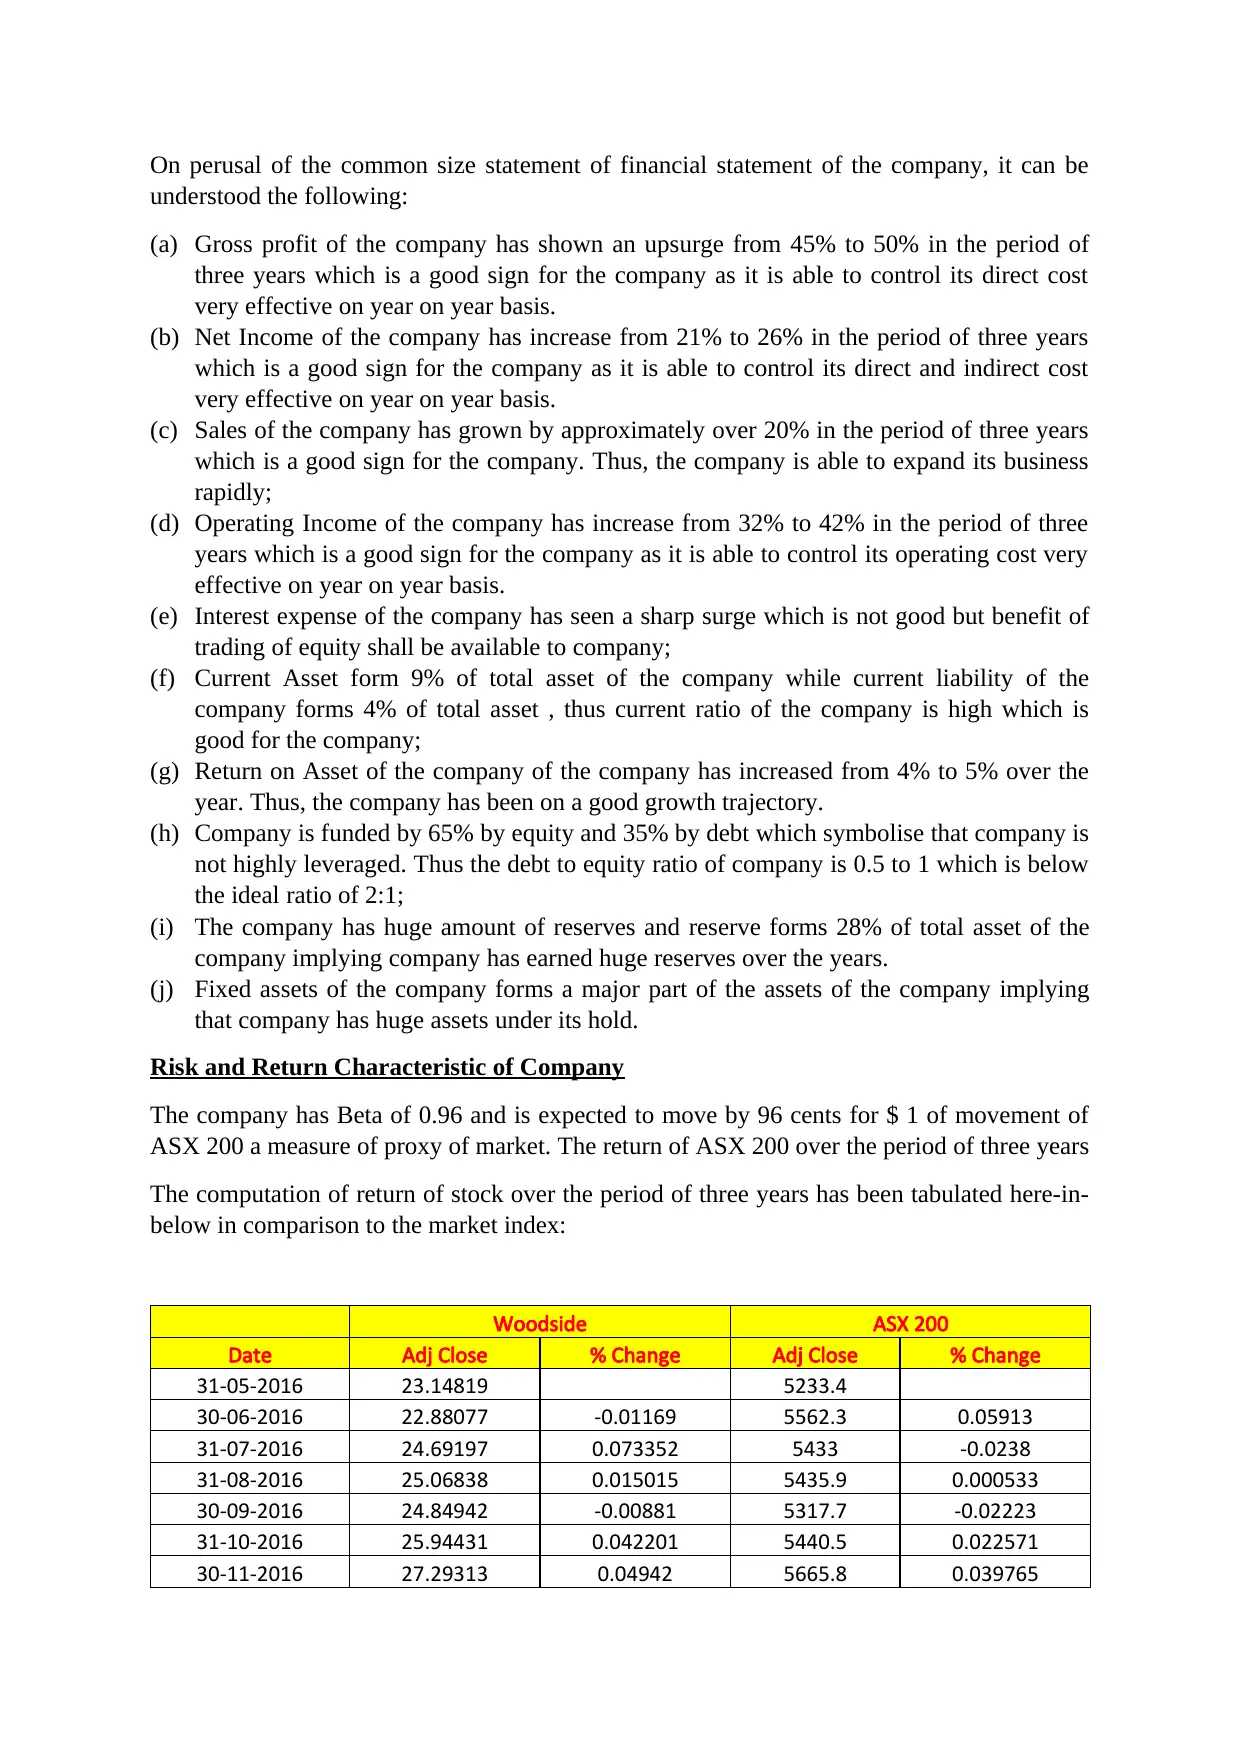
Risk and Return Characteristic of Company
The company has Beta of 0.96 and is expected to move by 96 cents for $ 1 of movement of
ASX 200 a measure of proxy of market. The return of ASX 200 over the period of three years
The computation of return of stock over the period of three years has been tabulated here-in-
below in comparison to the market index:
Woodside ASX 200
Date Adj Close % Change Adj Close % Change
31-05-2016 23.14819 5233.4
30-06-2016 22.88077 -0.01169 5562.3 0.05913
31-07-2016 24.69197 0.073352 5433 -0.0238
31-08-2016 25.06838 0.015015 5435.9 0.000533
30-09-2016 24.84942 -0.00881 5317.7 -0.02223
31-10-2016 25.94431 0.042201 5440.5 0.022571
30-11-2016 27.29313 0.04942 5665.8 0.039765
understood the following:
(a) Gross profit of the company has shown an upsurge from 45% to 50% in the period of
three years which is a good sign for the company as it is able to control its direct cost
very effective on year on year basis.
(b) Net Income of the company has increase from 21% to 26% in the period of three years
which is a good sign for the company as it is able to control its direct and indirect cost
very effective on year on year basis.
(c) Sales of the company has grown by approximately over 20% in the period of three years
which is a good sign for the company. Thus, the company is able to expand its business
rapidly;
(d) Operating Income of the company has increase from 32% to 42% in the period of three
years which is a good sign for the company as it is able to control its operating cost very
effective on year on year basis.
(e) Interest expense of the company has seen a sharp surge which is not good but benefit of
trading of equity shall be available to company;
(f) Current Asset form 9% of total asset of the company while current liability of the
company forms 4% of total asset , thus current ratio of the company is high which is
good for the company;
(g) Return on Asset of the company of the company has increased from 4% to 5% over the
year. Thus, the company has been on a good growth trajectory.
(h) Company is funded by 65% by equity and 35% by debt which symbolise that company is
not highly leveraged. Thus the debt to equity ratio of company is 0.5 to 1 which is below
the ideal ratio of 2:1;
(i) The company has huge amount of reserves and reserve forms 28% of total asset of the
company implying company has earned huge reserves over the years.
(j) Fixed assets of the company forms a major part of the assets of the company implying
that company has huge assets under its hold.
Risk and Return Characteristic of Company
The company has Beta of 0.96 and is expected to move by 96 cents for $ 1 of movement of
ASX 200 a measure of proxy of market. The return of ASX 200 over the period of three years
The computation of return of stock over the period of three years has been tabulated here-in-
below in comparison to the market index:
Woodside ASX 200
Date Adj Close % Change Adj Close % Change
31-05-2016 23.14819 5233.4
30-06-2016 22.88077 -0.01169 5562.3 0.05913
31-07-2016 24.69197 0.073352 5433 -0.0238
31-08-2016 25.06838 0.015015 5435.9 0.000533
30-09-2016 24.84942 -0.00881 5317.7 -0.02223
31-10-2016 25.94431 0.042201 5440.5 0.022571
30-11-2016 27.29313 0.04942 5665.8 0.039765
⊘ This is a preview!⊘
Do you want full access?
Subscribe today to unlock all pages.
Trusted by 1+ million students worldwide
Woodside ASX 200
Date Adj Close % Change Adj Close % Change
31-12-2016 27.64353 0.012676 5620.9 -0.00799
31-01-2017 27.45085 -0.00702 5712.2 0.015983
28-02-2017 28.09903 0.023068 5864.9 0.026036
31-03-2017 28.79931 0.024316 5924.1 0.009993
30-04-2017 28.77238 -0.00094 5724.6 -0.03485
31-05-2017 26.73197 -0.07633 5721.5 -0.00054
30-06-2017 26.10552 -0.024 5720.6 -0.00016
31-07-2017 25.80118 -0.0118 5714.5 -0.00107
31-08-2017 26.60445 0.030193 5681.6 -0.00579
30-09-2017 28.09466 0.053042 5909 0.038484
31-10-2017 28.34155 0.008711 5969.9 0.010201
30-11-2017 30.24309 0.062875 6065.1 0.015696
31-12-2017 30.27968 0.001208 6037.7 -0.00454
31-01-2018 27.03245 -0.12012 6016 -0.00361
28-02-2018 27.67706 0.02329 5759.4 -0.04455
31-03-2018 30.49777 0.092489 5982.7 0.037324
30-04-2018 30.67762 0.005862 6011.9 0.004857
31-05-2018 33.56459 0.086012 6194.6 0.029493
30-06-2018 34.20824 0.018816 6280.2 0.01363
31-07-2018 34.89922 0.019799 6319.5 0.006219
31-08-2018 37.2573 0.063292 6207.6 -0.01803
30-09-2018 33.65518 -0.10703 5830.3 -0.06471
31-10-2018 29.99512 -0.12202 5667.2 -0.02878
30-11-2018 30.2462 0.008301 5646.4 -0.00368
31-12-2018 33.14335 0.087413 5864.7 0.037223
31-01-2019 35.00718 0.053241 6169 0.049327
28-02-2019 34.62 -0.01118 6180.7 0.001893
31-03-2019 35.39 0.021758 6325.5 0.022891
30-04-2019 34.93 -0.01317 6335.8 0.001626
03-05-2019 34.93 0 6335.8 0
Mean 1% 0%
Annual 12% 6%
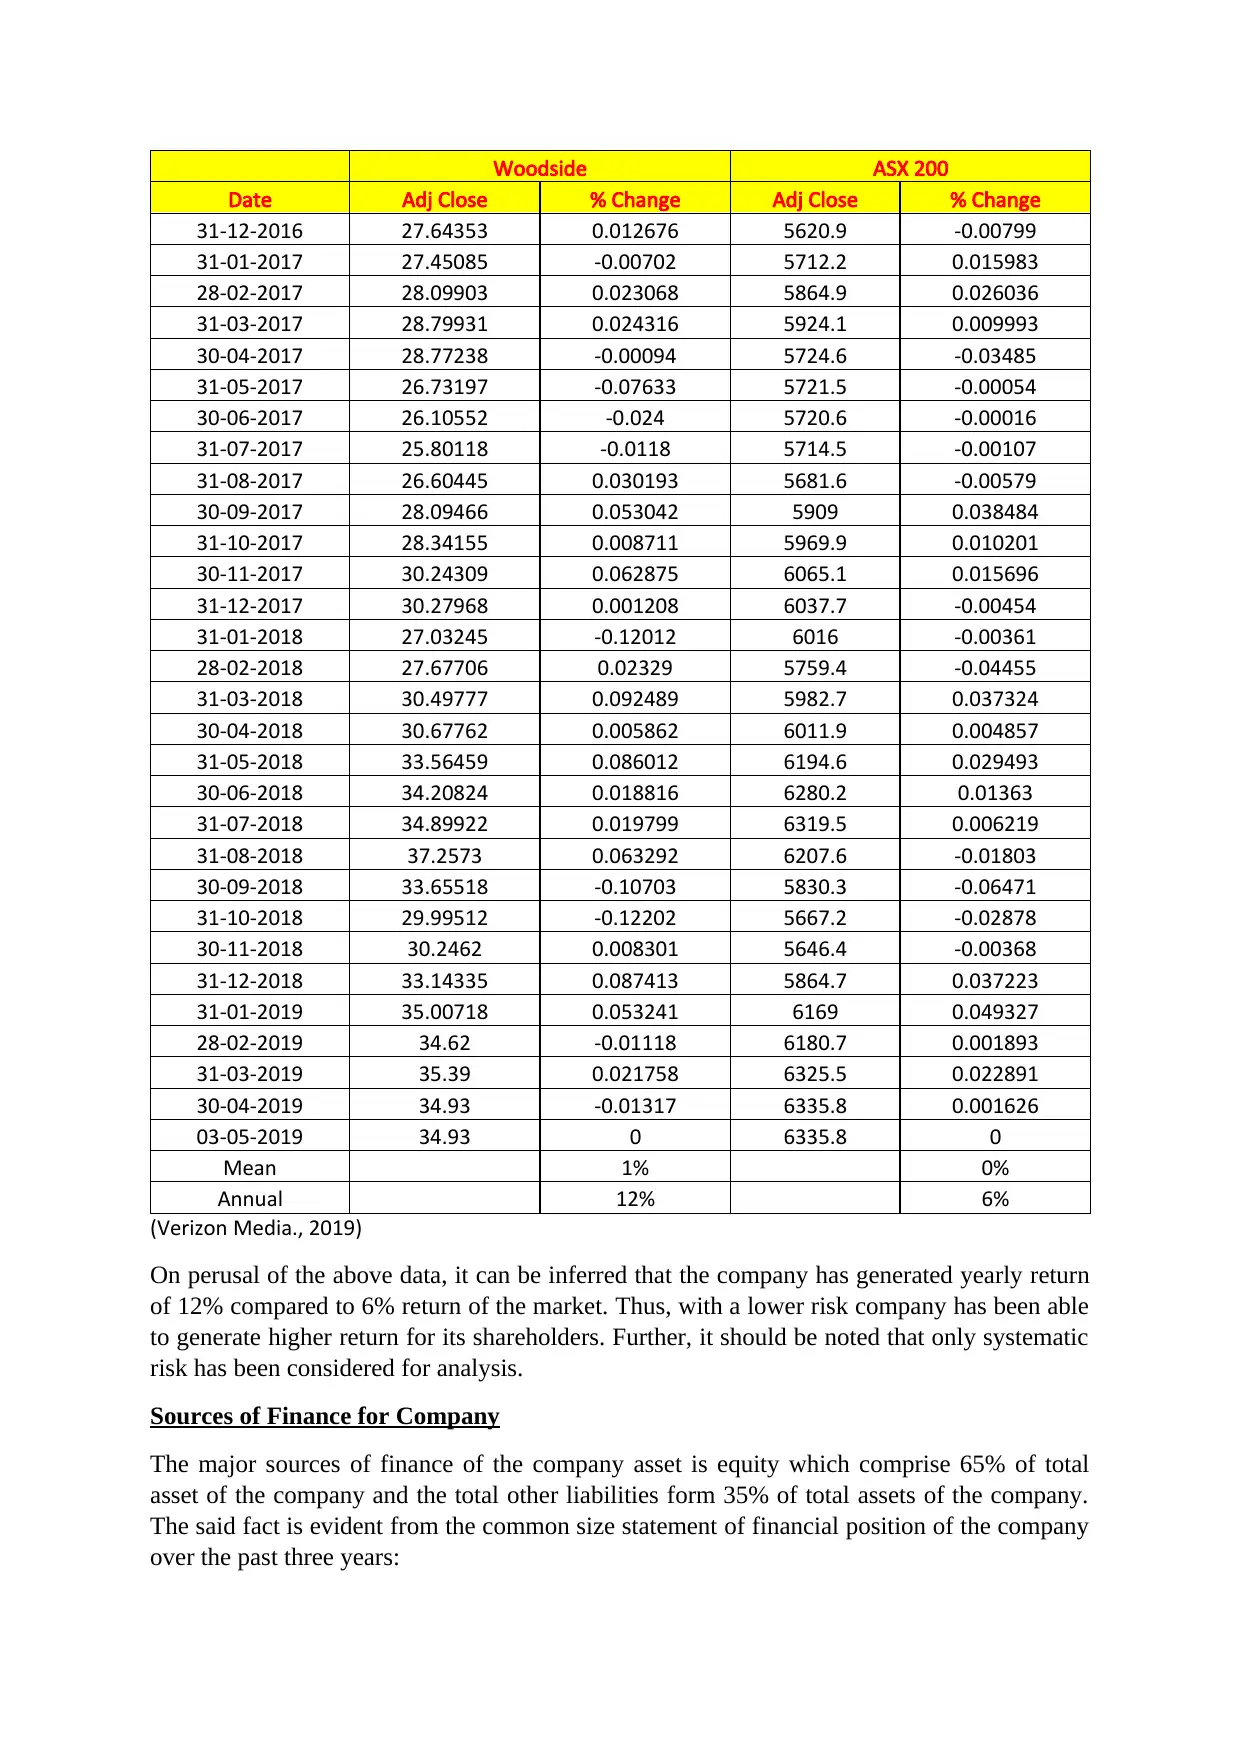
(Verizon Media., 2019)
On perusal of the above data, it can be inferred that the company has generated yearly return
of 12% compared to 6% return of the market. Thus, with a lower risk company has been able
to generate higher return for its shareholders. Further, it should be noted that only systematic
risk has been considered for analysis.
Sources of Finance for Company
The major sources of finance of the company asset is equity which comprise 65% of total
asset of the company and the total other liabilities form 35% of total assets of the company.
The said fact is evident from the common size statement of financial position of the company
over the past three years:
Date Adj Close % Change Adj Close % Change
31-12-2016 27.64353 0.012676 5620.9 -0.00799
31-01-2017 27.45085 -0.00702 5712.2 0.015983
28-02-2017 28.09903 0.023068 5864.9 0.026036
31-03-2017 28.79931 0.024316 5924.1 0.009993
30-04-2017 28.77238 -0.00094 5724.6 -0.03485
31-05-2017 26.73197 -0.07633 5721.5 -0.00054
30-06-2017 26.10552 -0.024 5720.6 -0.00016
31-07-2017 25.80118 -0.0118 5714.5 -0.00107
31-08-2017 26.60445 0.030193 5681.6 -0.00579
30-09-2017 28.09466 0.053042 5909 0.038484
31-10-2017 28.34155 0.008711 5969.9 0.010201
30-11-2017 30.24309 0.062875 6065.1 0.015696
31-12-2017 30.27968 0.001208 6037.7 -0.00454
31-01-2018 27.03245 -0.12012 6016 -0.00361
28-02-2018 27.67706 0.02329 5759.4 -0.04455
31-03-2018 30.49777 0.092489 5982.7 0.037324
30-04-2018 30.67762 0.005862 6011.9 0.004857
31-05-2018 33.56459 0.086012 6194.6 0.029493
30-06-2018 34.20824 0.018816 6280.2 0.01363
31-07-2018 34.89922 0.019799 6319.5 0.006219
31-08-2018 37.2573 0.063292 6207.6 -0.01803
30-09-2018 33.65518 -0.10703 5830.3 -0.06471
31-10-2018 29.99512 -0.12202 5667.2 -0.02878
30-11-2018 30.2462 0.008301 5646.4 -0.00368
31-12-2018 33.14335 0.087413 5864.7 0.037223
31-01-2019 35.00718 0.053241 6169 0.049327
28-02-2019 34.62 -0.01118 6180.7 0.001893
31-03-2019 35.39 0.021758 6325.5 0.022891
30-04-2019 34.93 -0.01317 6335.8 0.001626
03-05-2019 34.93 0 6335.8 0
Mean 1% 0%
Annual 12% 6%
(Verizon Media., 2019)
On perusal of the above data, it can be inferred that the company has generated yearly return
of 12% compared to 6% return of the market. Thus, with a lower risk company has been able
to generate higher return for its shareholders. Further, it should be noted that only systematic
risk has been considered for analysis.
Sources of Finance for Company
The major sources of finance of the company asset is equity which comprise 65% of total
asset of the company and the total other liabilities form 35% of total assets of the company.
The said fact is evident from the common size statement of financial position of the company
over the past three years:
Paraphrase This Document
Need a fresh take? Get an instant paraphrase of this document with our AI Paraphraser
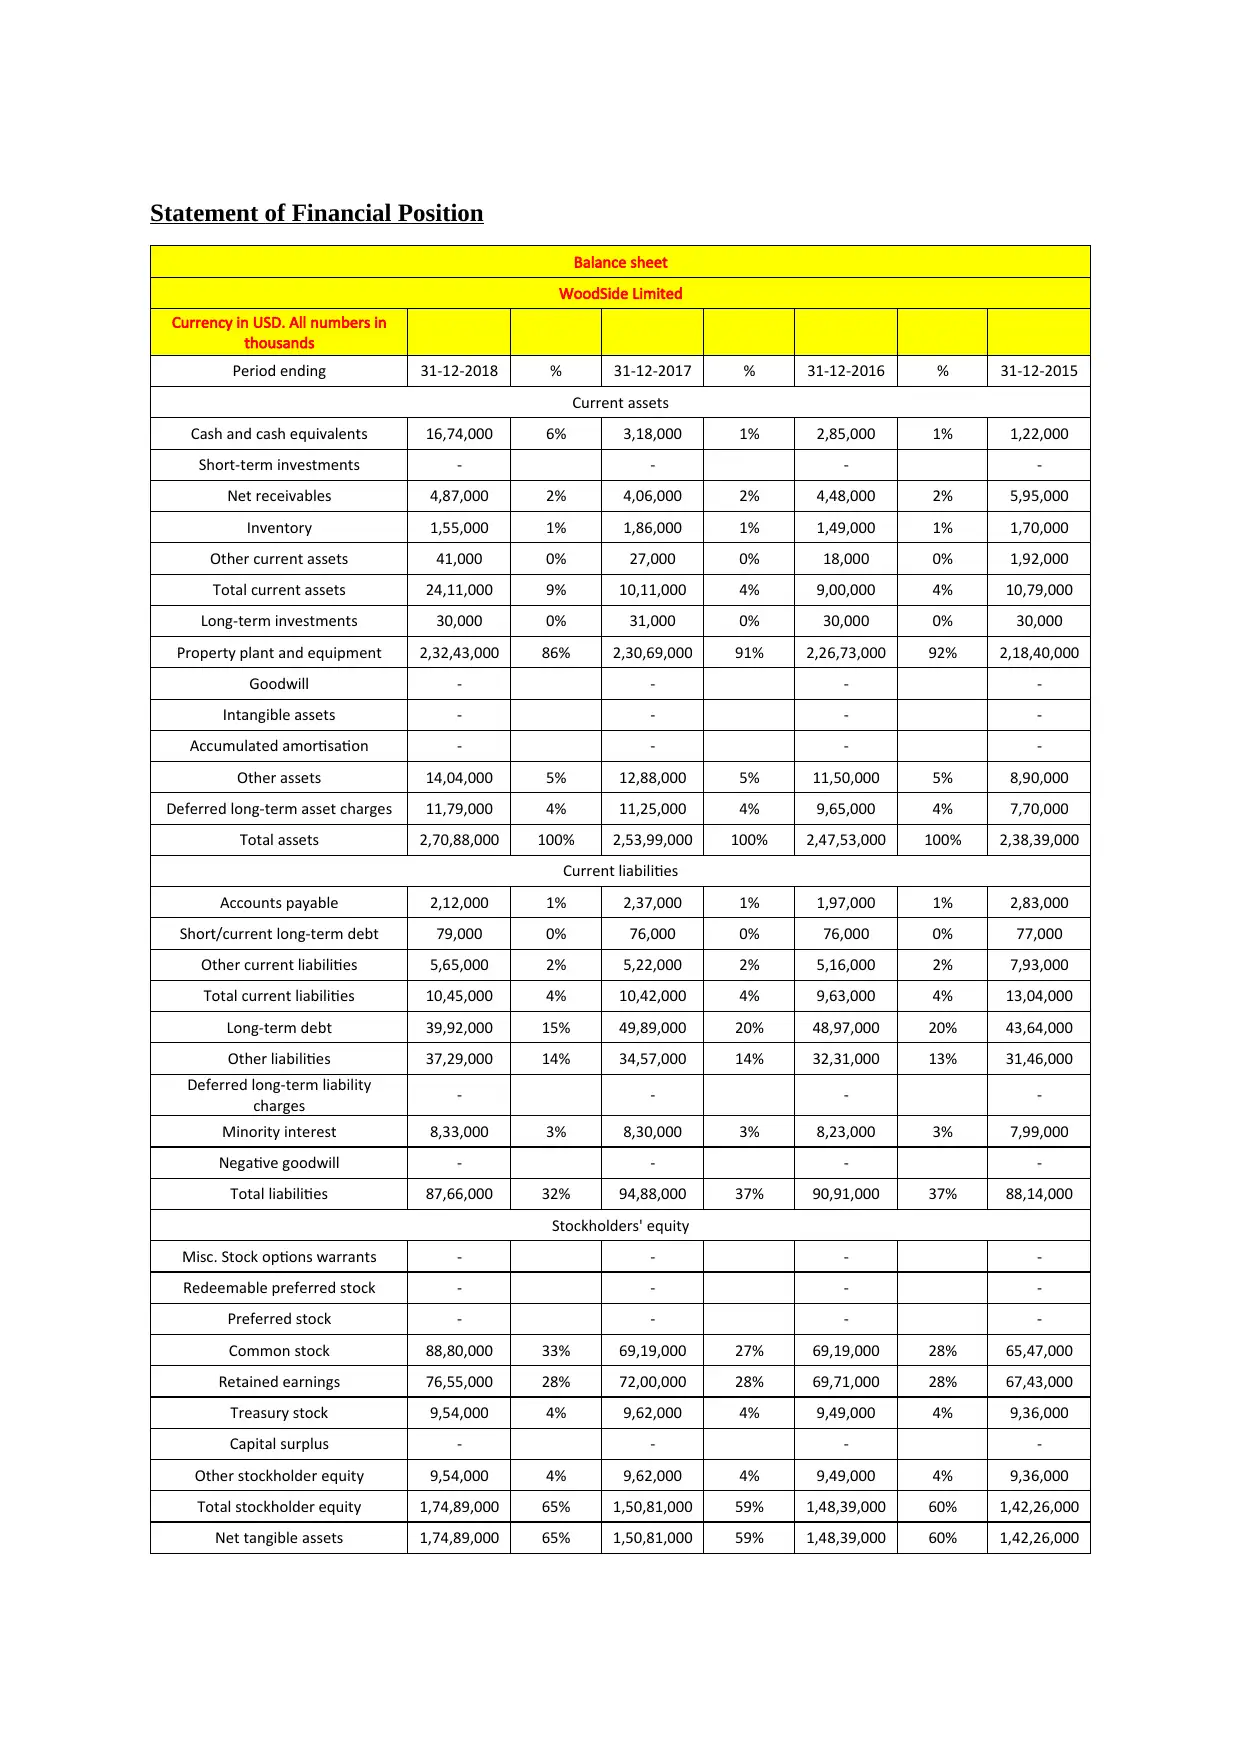
Statement of Financial Position
Balance sheet
WoodSide Limited
Currency in USD. All numbers in
thousands
Period ending 31-12-2018 % 31-12-2017 % 31-12-2016 % 31-12-2015
Current assets
Cash and cash equivalents 16,74,000 6% 3,18,000 1% 2,85,000 1% 1,22,000
Short-term investments - - - -
Net receivables 4,87,000 2% 4,06,000 2% 4,48,000 2% 5,95,000
Inventory 1,55,000 1% 1,86,000 1% 1,49,000 1% 1,70,000
Other current assets 41,000 0% 27,000 0% 18,000 0% 1,92,000
Total current assets 24,11,000 9% 10,11,000 4% 9,00,000 4% 10,79,000
Long-term investments 30,000 0% 31,000 0% 30,000 0% 30,000
Property plant and equipment 2,32,43,000 86% 2,30,69,000 91% 2,26,73,000 92% 2,18,40,000
Goodwill - - - -
Intangible assets - - - -
Accumulated amortisation - - - -
Other assets 14,04,000 5% 12,88,000 5% 11,50,000 5% 8,90,000
Deferred long-term asset charges 11,79,000 4% 11,25,000 4% 9,65,000 4% 7,70,000
Total assets 2,70,88,000 100% 2,53,99,000 100% 2,47,53,000 100% 2,38,39,000
Current liabilities
Accounts payable 2,12,000 1% 2,37,000 1% 1,97,000 1% 2,83,000
Short/current long-term debt 79,000 0% 76,000 0% 76,000 0% 77,000
Other current liabilities 5,65,000 2% 5,22,000 2% 5,16,000 2% 7,93,000
Total current liabilities 10,45,000 4% 10,42,000 4% 9,63,000 4% 13,04,000
Long-term debt 39,92,000 15% 49,89,000 20% 48,97,000 20% 43,64,000
Other liabilities 37,29,000 14% 34,57,000 14% 32,31,000 13% 31,46,000
Deferred long-term liability
charges - - - -
Minority interest 8,33,000 3% 8,30,000 3% 8,23,000 3% 7,99,000
Negative goodwill - - - -
Total liabilities 87,66,000 32% 94,88,000 37% 90,91,000 37% 88,14,000
Stockholders' equity
Misc. Stock options warrants - - - -
Redeemable preferred stock - - - -
Preferred stock - - - -
Common stock 88,80,000 33% 69,19,000 27% 69,19,000 28% 65,47,000
Retained earnings 76,55,000 28% 72,00,000 28% 69,71,000 28% 67,43,000
Treasury stock 9,54,000 4% 9,62,000 4% 9,49,000 4% 9,36,000
Capital surplus - - - -
Other stockholder equity 9,54,000 4% 9,62,000 4% 9,49,000 4% 9,36,000
Total stockholder equity 1,74,89,000 65% 1,50,81,000 59% 1,48,39,000 60% 1,42,26,000
Net tangible assets 1,74,89,000 65% 1,50,81,000 59% 1,48,39,000 60% 1,42,26,000
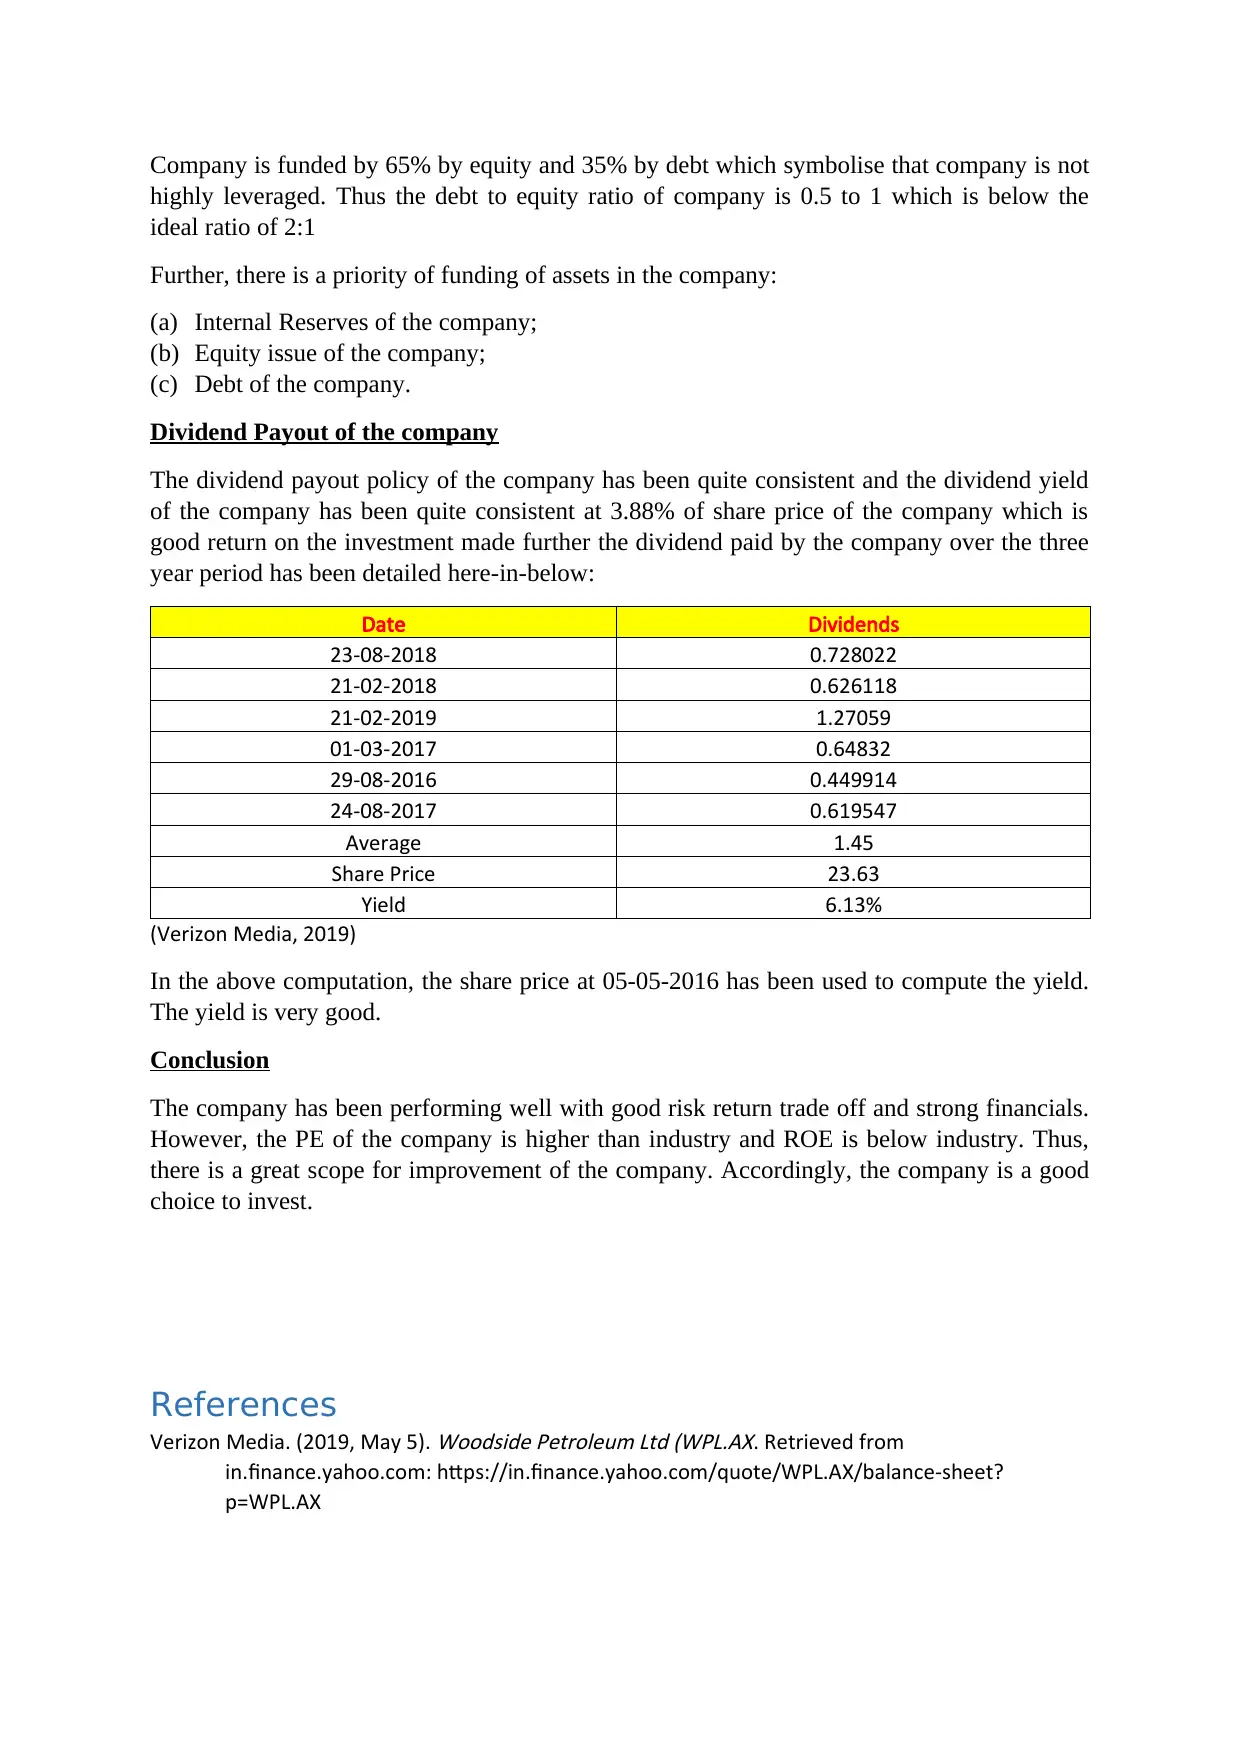
Company is funded by 65% by equity and 35% by debt which symbolise that company is not
highly leveraged. Thus the debt to equity ratio of company is 0.5 to 1 which is below the
ideal ratio of 2:1
Further, there is a priority of funding of assets in the company:
(a) Internal Reserves of the company;
(b) Equity issue of the company;
(c) Debt of the company.
Dividend Payout of the company
The dividend payout policy of the company has been quite consistent and the dividend yield
of the company has been quite consistent at 3.88% of share price of the company which is
good return on the investment made further the dividend paid by the company over the three
year period has been detailed here-in-below:
Date Dividends
23-08-2018 0.728022
21-02-2018 0.626118
21-02-2019 1.27059
01-03-2017 0.64832
29-08-2016 0.449914
24-08-2017 0.619547
Average 1.45
Share Price 23.63
Yield 6.13%
(Verizon Media, 2019)
In the above computation, the share price at 05-05-2016 has been used to compute the yield.
The yield is very good.
Conclusion
The company has been performing well with good risk return trade off and strong financials.
However, the PE of the company is higher than industry and ROE is below industry. Thus,
there is a great scope for improvement of the company. Accordingly, the company is a good
choice to invest.
References
Verizon Media. (2019, May 5).
Woodside Petroleum Ltd (WPL.AX. Retrieved from
in.finance.yahoo.com: https://in.finance.yahoo.com/quote/WPL.AX/balance-sheet?
p=WPL.AX
⊘ This is a preview!⊘
Do you want full access?
Subscribe today to unlock all pages.
Trusted by 1+ million students worldwide
Dun & Bradstreet, Inc. (2019, May 5).
WOODSIDE PETROLEUM LTD. Retrieved May 5, 2019, from
www.hoovers.com: http://www.hoovers.com/company-information/cs/company-
profile.woodside_petroleum_ltd.0b4fc69c80772727.html?aka_re=1
Pearson, R. (2019, May 5).
The huge hidden risk facing Santos Ltd and Woodside Petroleum Limited.
Retrieved from www.fool.com.au: https://www.fool.com.au/2015/03/11/the-huge-hidden-
risk-facing-santos-ltd-and-woodside-petroleum-limited/
Reuters.com. (2019, May 5).
Woodside Petroleum Ltd (WPL.AX). Retrieved MAy 5, 2019, from
www.reuters.com: https://www.reuters.com/finance/stocks/overview/WPL.AX
Verizon Media. (2019, MAy 5).
Woodside Petroleum Ltd (WPL.AX). Retrieved from
in.finance.yahoo.com: https://in.finance.yahoo.com/quote/WPL.AX/history?
period1=1430764200&period2=1556994600&interval=1mo&filter=history&frequency=1mo
Verizon Media. (2019, May 5).
Woodside Petroleum Ltd (WPL.AX). Retrieved from
in.finance.yahoo.com: https://in.finance.yahoo.com/quote/WPL.AX/history?
period1=1462386600&period2=1556994600&interval=div
%7Csplit&filter=div&frequency=1mo
Verizon Media. (2019, May 5).
S&P/ASX 200 (^AXJO). Retrieved from in.finance.yahoo.com:
https://in.finance.yahoo.com/quote/%5EAXJO/history?
period1=1462386600&period2=1556994600&interval=1mo&filter=history&frequency=1mo
Woodside. (2019, May 5).
PURPOSE & STRATEGY. Retrieved from www.woodside.com.au:
https://www.woodside.com.au/about-us/purpose-strategy
1 out of 10

Your All-in-One AI-Powered Toolkit for Academic Success.
+13062052269
info@desklib.com
Available 24*7 on WhatsApp / Email
![[object Object]](/_next/static/media/star-bottom.7253800d.svg)
Unlock your academic potential
Copyright © 2020–2026 A2Z Services. All Rights Reserved. Developed and managed by ZUCOL.