Woodside Petroleum: Factor Models, CAPM, and Portfolio Analysis Report
VerifiedAdded on 2022/11/28
|13
|2093
|299
Report
AI Summary
This report analyzes Woodside Petroleum Limited, an Australian petroleum company, using financial modeling techniques. It begins with descriptive statistics of Woodside's stock returns, including mean, standard deviation, and skewness, comparing them to the ASX All Ordinaries Index. The report then applies the Capital Asset Pricing Model (CAPM) and Single Index Model (SIM) to assess systematic risk and alpha, concluding that Woodside's systematic risk is near the market average but overall risk is not stable. It further examines the Fama and French three-factor model, discussing its factors and implications. The report presents regression results and ANOVA analysis to evaluate the significance of coefficients like Beta, SMB, and HML. The analysis continues with portfolio analysis, including variance-covariance matrices and return data for various stocks, identifying GMG as having the highest return. Finally, the report briefly discusses the impact of holding stocks for a longer period on risk and return, highlighting the increased risk due to price fluctuations. The document references key financial research papers and models to support its analysis.

Table of Contents
Question 1: Returns, CAPM.................................................................................... 1
Woodside Petroleum Limited Description...........................................................1
Descriptive Statistics....................................................................................... 2
CAPM/Single Index Model................................................................................ 5
Answer 2.1............................................................................................................. 7
Answer 2.2............................................................................................................. 8
Answer 2.3............................................................................................................. 9
Part 2.................................................................................................................. 9
Part 3.................................................................................................................. 9
Question 3........................................................................................................... 11
Ans 3.1............................................................................................................. 11
Answer 3.5........................................................................................................ 11
Paraphrase This Document
Need a fresh take? Get an instant paraphrase of this document with our AI Paraphraser

Question 1: Returns, CAPM
Woodside Petroleum Limited Description
Woodside Petroleum Limited is a a petroleum production and exploration company based
in Australia. The company publicly listed in the Australian Securities Exchange (ASX)
market with the headquarter located in Perth, Western Australia. Woodside is the largest
independent dedicated oil and gas company in Australia. The original company known as
Woodside (Lakes Entrance) Oil Co NL was founded in 1954. The name was then
changed to Woodside Petroleum Limited. The company has an employee base of
approximately 3300. The annual revenue for the year 2018 stood at US$5.240 billion and
net annual income of US$1.364. The current CEO of the company is Peter John Coleman
who was appointed on 30th May, 2011.
In March 2019, Woodside Energy Ltd invested in Sapien Cyber Ltd, a Western
Australian cyber security firm. The main objective of the investment was to take ten
percent shareholding in Sapien Cyber. At the beginning of September 2019, Woodsides
Energy partnered with Orange Sky Australia to launch a new AUD450,000 three-year
partnership. The move will enable Woodside extend its support of the homelessness
service in Perth through sponsorship of ‘Karla’ mobile shower and laundry van.

Descriptive Statistics
The graphs below show the plot of daily close price for Woodside Petroleum Limited
stock, ASX all ordinaries Index, and the respective returns on the portfolios.
7/3/2017
8/8/2017
9/13/2017
10/19/2017
11/24/2017
12/30/2017
2/4/2018
3/12/2018
4/17/2018
5/23/2018
6/28/2018
8/3/2018
9/8/2018
10/14/2018
11/19/2018
12/25/2018
1/30/2019
3/7/2019
4/12/2019
5/18/2019
6/23/2019
0.0
10.0
20.0
30.0
40.0
50.0
Graph 1.2 (a): WPL Daily Close Price
Period
Close Price (AUD)
7/3/2017
8/9/2017
9/15/2017
10/22/2017
11/28/2017
1/4/2018
2/10/2018
3/19/2018
4/25/2018
6/1/2018
7/8/2018
8/14/2018
9/20/2018
10/27/2018
12/3/2018
1/9/2019
2/15/2019
3/24/2019
4/30/2019
6/6/2019
0.0
2000.0
4000.0
6000.0
8000.0
Graph 1.2 (b): AORD Daily Close Price
Period
Close Price (AUD)
⊘ This is a preview!⊘
Do you want full access?
Subscribe today to unlock all pages.
Trusted by 1+ million students worldwide
7/4/2017
8/9/2017
9/14/2017
10/20/2017
11/25/2017
12/31/2017
2/5/2018
3/13/2018
4/18/2018
5/24/2018
6/29/2018
8/4/2018
9/9/2018
10/15/2018
11/20/2018
12/26/2018
1/31/2019
3/8/2019
4/13/2019
5/19/2019
6/24/2019
-8.00
-6.00
-4.00
-2.00
0.00
2.00
4.00
6.00
Graph 1.2 (c): WPL Return
WPL simple return 0.0 WPL log return 0
Period
Return (%)
7/4/2017
8/9/2017
9/14/2017
10/20/2017
11/25/2017
12/31/2017
2/5/2018
3/13/2018
4/18/2018
5/24/2018
6/29/2018
8/4/2018
9/9/2018
10/15/2018
11/20/2018
12/26/2018
1/31/2019
3/8/2019
4/13/2019
5/19/2019
6/24/2019
-4.00
-3.00
-2.00
-1.00
0.00
1.00
2.00
3.00
Graph 1.2 (d): AORD Return
AORD simple return 0 AORD log return 0
Period
Return (%)
8/9/2017
9/14/2017
10/20/2017
11/25/2017
12/31/2017
2/5/2018
3/13/2018
4/18/2018
5/24/2018
6/29/2018
8/4/2018
9/9/2018
10/15/2018
11/20/2018
12/26/2018
1/31/2019
3/8/2019
4/13/2019
5/19/2019
6/24/2019
-8.00
-6.00
-4.00
-2.00
0.00
2.00
4.00
6.00
Graph 1.2 (c): WPL Return
WPL simple return 0.0 WPL log return 0
Period
Return (%)
7/4/2017
8/9/2017
9/14/2017
10/20/2017
11/25/2017
12/31/2017
2/5/2018
3/13/2018
4/18/2018
5/24/2018
6/29/2018
8/4/2018
9/9/2018
10/15/2018
11/20/2018
12/26/2018
1/31/2019
3/8/2019
4/13/2019
5/19/2019
6/24/2019
-4.00
-3.00
-2.00
-1.00
0.00
1.00
2.00
3.00
Graph 1.2 (d): AORD Return
AORD simple return 0 AORD log return 0
Period
Return (%)
Paraphrase This Document
Need a fresh take? Get an instant paraphrase of this document with our AI Paraphraser

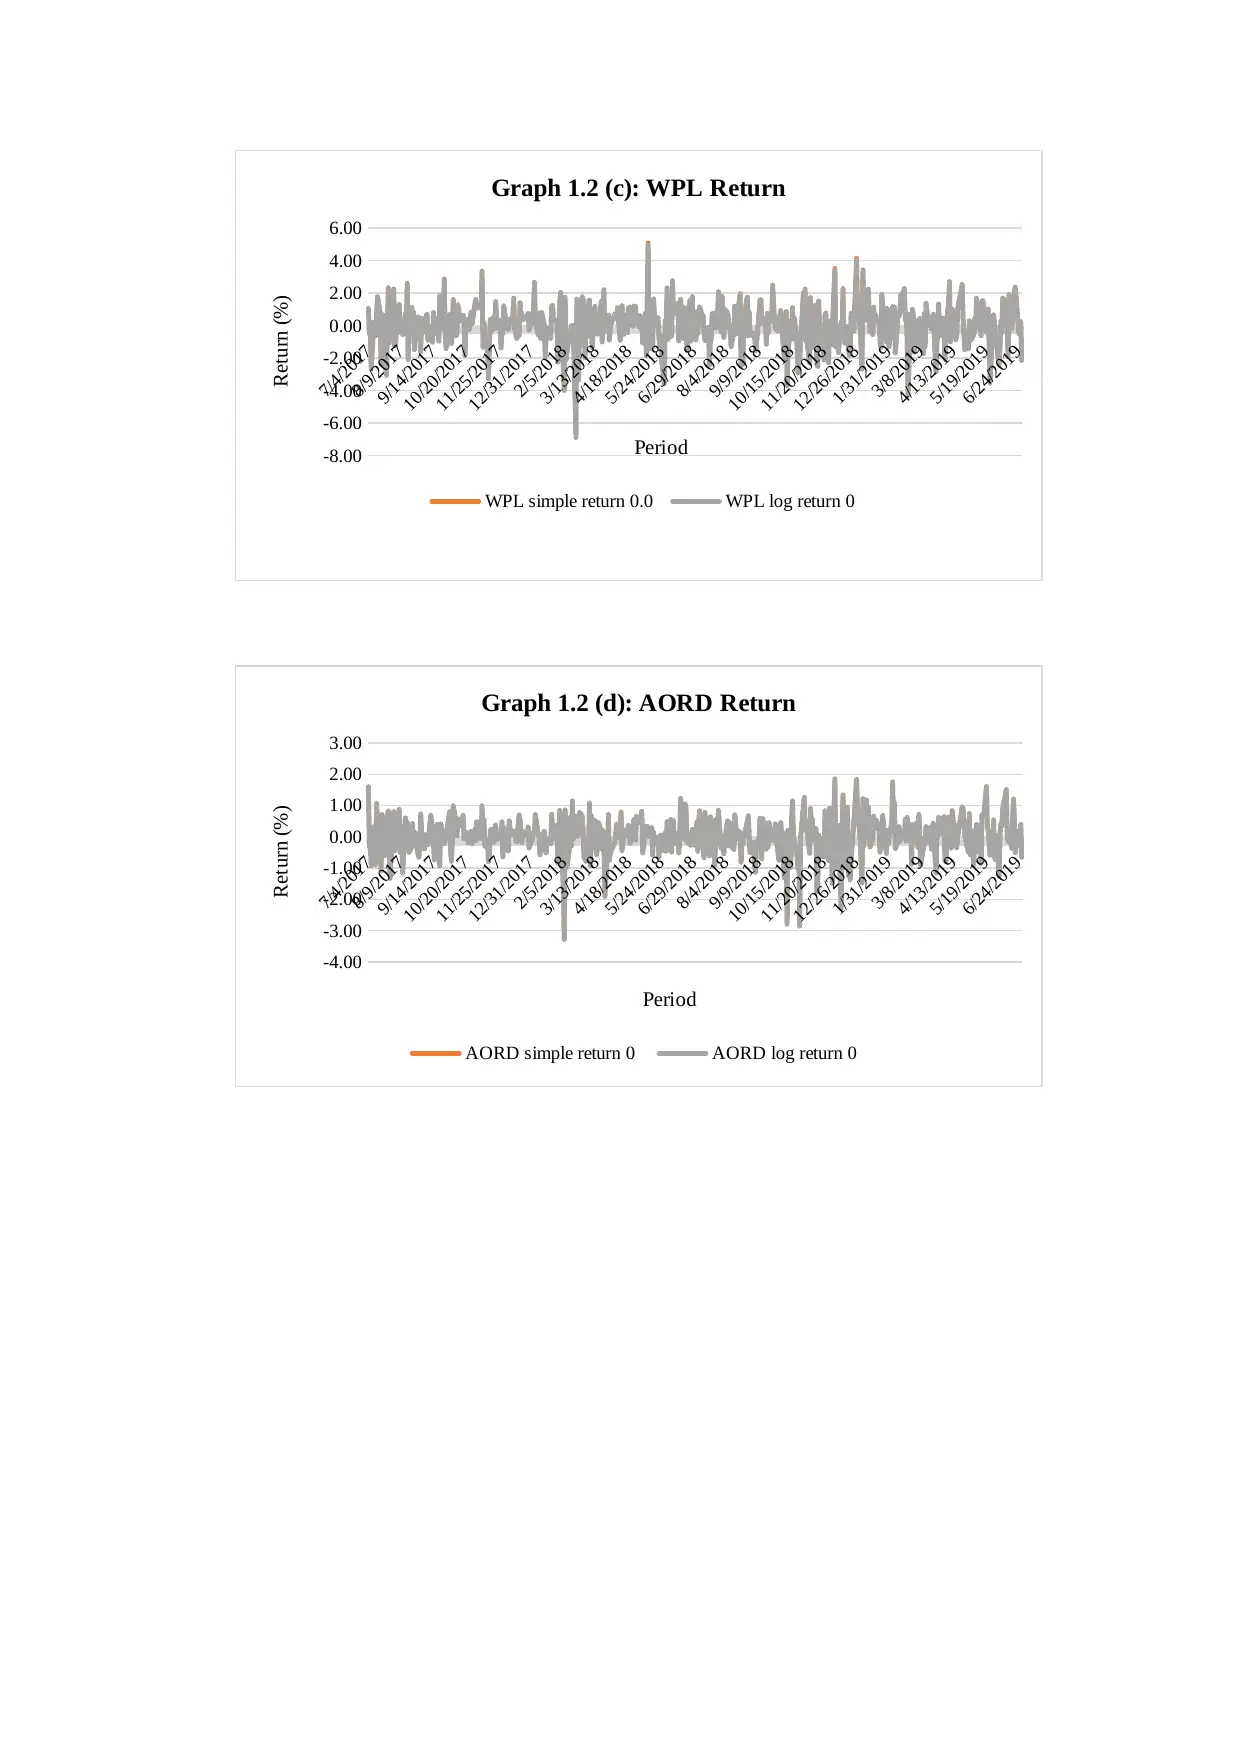
Descriptive Statistics
The table 1 shows the descriptive statistics of the return on the assets
Table 1: Descriptive Statistics for Returns
Statistics
WPL simple
return
WPL log
return
AORD simple
return
AORD log
return
Mean 0.0497 0.0413 0.0330 0.0311
Standard Error 0.0577 0.0578 0.0277 0.0278
Median 0.1355 0.1354 0.0449 0.0449
Standard
Deviation 1.2944 1.2973 0.6220 0.6234
Sample Variance 1.6755 1.6830 0.3869 0.3886
Kurtosis 1.9168 2.0730 3.1895 3.3428
Skewness -0.3668 -0.4410 -0.7862 -0.8292
Range 11.7580 11.8642 5.0952 5.1316
Minimum -6.6575 -6.8895 -3.2341 -3.2876
Maximum 5.1005 4.9747 1.8611 1.8440
Sum 25.0467 20.8157 16.6494 15.6709
Count 504 504 540 504
The average continuous return is 0.0413% with a standard deviation of 1.2973% for
Woodside Petroleum Limited. The large standard deviation shows that the returns are not
stable and the average fluctuation is more than the average fluctuation of market.
However, for the ASX all ordinaries index the average return is 0.0311% with a standard
deviation of 0.6234%. The deviation is twice the average which indicate that the returns
have not been stable for the last two years.

CAPM/Single Index Model
The mathematical expression of SIM is
ri , t−r f =α + β ( rm , t−rf ) + εi
where:
ri , t - is return to stock i in period t
r f - is the risk-free rate (i.e. the interest rate on treasury bills)
rm , t - is the return to the market portfolio in period t
α - is the stock's alpha, or abnormal return
β - is the stock’s beta, or responsiveness to the market return
Note that ri , t−r f is called the excess return on the stock, rm , t −rf the excess return on
the market and ε i are the residual (random) returns, which are assumed independent
normally distributed with mean zero and standard deviation.
For simplicity the model is defined as follows in excel:
Coefficient
s
Standar
d Error t Stat P-value
Intercept 0.0972 0.0899 1.0817 0.2799
rm , t −rf 1.0917 0.0792
13.792
3 0.0000
From the results of the analysis, it may be inferred that systematic risk of Woodside
Petroleum Limited is 1.0917 which is approximately near to the market which is 1. Thus,
it may be concluded that the stock is not risky from systematic risk point of view.
⊘ This is a preview!⊘
Do you want full access?
Subscribe today to unlock all pages.
Trusted by 1+ million students worldwide

However, when analysed from overall risk perspective, the said observation negates.
Further, the alpha of the stock is 9% which is good.
Further, the alpha of the stock is 9% which is good.
Paraphrase This Document
Need a fresh take? Get an instant paraphrase of this document with our AI Paraphraser

Answer 2.1
The fama and French model was discovered by Nobel laureates Eugene Fama with his junior
Kenneth French in the year 1990s.The Fama and French model has three principal important
factors like the firm size ,book to market values and excess return on market.The three
principal factors are small minus big(SMB),high minus low(HML) and the return on portfolio
minus the risk free rate of return.The small minus big mostly consider companies related to
public with a very small market cap and yield high rate of return.The other one high minus
low mostly consider the stocks with a very high book to market ratios that yield a very rate of
return as comparison to the market rate of return.The main three factor model of Fama French
is that it is an asset pricing model that expands on the CAPM model through addition of size
risk and value risk factor to the market factor. This model is essentially the outcome for an
econometric regression of the prices of stock which are historical. (Business and Economics
Research Journal, 2016)
The Fama and French model main highlight point is that the investors must be able to borne
the extra volatility which occur in the short term and the stock underperformance which could
also occur in the short span of time. The investors who go long for any particular stock must
be awarded with the benefits which could be adjusted with the short-term losses suffered. It is
also a very active tool to understand the performance of portfolio, to measure the impact of
active management, construction of portfolio, and to estimate the return in future. (Forbes
Media LLC, 2019)

Answer 2.2
The regression results along with the fit summary is enclosed in excel. Further, a brief
snapshot is presented as under:
Regression Statistics
Multiple R 0.5303
R Square 0.2813
Adjusted R
Square 0.2769
Standard
Error 1.1042
Observatio
ns 503
ANOVA
df SS MS F
Significa
nce F
Regression 3 238.0889
79.3
630
65.0
872 0.0000
Residual 499 608.4473
1.21
93
Total 502 846.5362
Coeffic
ients
Standard
Error
t
Stat
P-
valu
e
Lower
95%
Upper
95%
Lower
95.0%
Upper
95.0%
Intercept 0.0807 0.0901
0.89
56
0.37
09 -0.0963 0.2577 -0.0963 0.2577
X 1.0718 0.0796
13.4
699
0.00
00 0.9155 1.2282 0.9155 1.2282
SMB 0.7150 2.1244
0.33
65
0.73
66 -3.4590 4.8889 -3.4590 4.8889
HML
-
2.1541 5.5227
-
0.39
00
0.69
67 -13.0048 8.6966
-
13.0048 8.6966
⊘ This is a preview!⊘
Do you want full access?
Subscribe today to unlock all pages.
Trusted by 1+ million students worldwide

Answer 2.3
On perusal of the ANOVA, it may be inferred that Alpha represented by Intercept has a P
Value of 0.3709 which is significantly high and indicates a poor strength of the
significance of the coefficient.
The Beta represented by X has a P Value of 0 which shows that the coefficient is
statistically significant and important for analysis purpose.
For SMB, the value of P is .7366 which is significantly high and indicates a poor strength
of the significance of the coefficient. Similarly for HML, the value of P is .6967 which is
significantly high and indicates a poor strength of the significance of the coefficient
The implications of the above P value shows the importance of the variable in the
equation and how accurately the variable of Y can be derived from the given variable.
Part 2
The largest significant coefficient out of Beta, SMB and HML is Beta as it has P value of
zero, an evidence of strong significance. It shows that observation probability of deviation
from the mean is zero. (John Wiley & Sons, 2019)
It means that Beta has significant predicting power on the variable Y and has the highest
impact on the outcome.
Part 3
R Squared is a statistical measure which helps in analysing the proportion of variance for
a dependent variable i.e. Y can be explained by an independent variable i.e. Beta, HML
and CMB in a regression model. In the current case, the R squared works out to be .2813
which is very low symbolising that the independent variable are not able to explain up to
72% of the variance of dependent variable movement and there are other significant
factors which needs to be considered in the analysis. (Frost, 2019)
Paraphrase This Document
Need a fresh take? Get an instant paraphrase of this document with our AI Paraphraser

Residual means observed value of the dependent variable i.e Y and the predicted value of
Y. It represents the portion of the variability which is unexplained by the regression
model. In the current case, the value works out to be 72% and it is very high.
On the R Squared or coefficient of determination front, Fama French Model is better as
the variability is better explained in the Fama Model compared to CPM. Thus, on the
basis of coefficient of determination result it may be concluded that Fama- French Three
Factor Model is a better fit.

Question 3
Ans 3.1
The variance Covariance Matrix has been presented here-in-below:
Variance Covariance Matrix
CSL BXB CBA GMG SYD WBC WPL NAB IAG RIO
CSL 0.00017 0.00005 0.00004 0.00004 0.00005 0.00004 0.00004 0.00003 0.00004 0.00003
BXB 0.00005 0.00011 0.00003 0.00003 0.00003 0.00003 0.00003 0.00003 0.00003 0.00001
CBA 0.00004 0.00003 0.00011 0.00002 0.00002 0.00009 0.00003 0.00007 0.00005 0.00003
GMG 0.00004 0.00003 0.00002 0.00012 0.00005 0.00003 0.00001 0.00002 0.00004 0.00000
SYD 0.00005 0.00003 0.00002 0.00005 0.00014 0.00003 0.00002 0.00002 0.00003 0.00000
WBC 0.00004 0.00003 0.00009 0.00003 0.00003 0.00013 0.00004 0.00009 0.00005 0.00003
WPL 0.00004 0.00003 0.00003 0.00001 0.00002 0.00004 0.00017 0.00003 0.00003 0.00006
NAB 0.00003 0.00003 0.00007 0.00002 0.00002 0.00009 0.00003 0.00010 0.00004 0.00002
IAG 0.00004 0.00003 0.00005 0.00004 0.00003 0.00005 0.00003 0.00004 0.00014 0.00003
RIO 0.00003 0.00001 0.00003 0.00000 0.00000 0.00003 0.00006 0.00002 0.00003 0.00021
The data for selected asset returns have been presented here-in-below:
CSL BXB CBA GMG SYD WBC WPL NAB IAG RIO
0.0009 0.0006 0.0000 0.0013 0.0003 -0.0001 0.0004 -0.0002 0.0004 0.0010
Based on the data presented, it can be concluded that GMG has the highest return among
the 10 stocks. Further, the data represents compounded return per day. On the variance
front, the highest variance is for Rio which has a variance of daily returns of 0.00021 with
a return of .0010. As far as covariance is concerned, the highest covariance, measure of
joint variability of data, among stocks is for WBC and NAB which stands at 0.0009.
Thus, on a prima facie glance the best stock among the given is GMG as the highest
return with a variance of .00012.
Answer 3.5
If the stocks are held for a period of two months, the risk shall increase on account of
rapid change in prices witnesses by the stock chosen over the period. Further, the return
⊘ This is a preview!⊘
Do you want full access?
Subscribe today to unlock all pages.
Trusted by 1+ million students worldwide
1 out of 13
Your All-in-One AI-Powered Toolkit for Academic Success.
+13062052269
info@desklib.com
Available 24*7 on WhatsApp / Email
![[object Object]](/_next/static/media/star-bottom.7253800d.svg)
Unlock your academic potential
Copyright © 2020–2026 A2Z Services. All Rights Reserved. Developed and managed by ZUCOL.