Project Report: Financial Analysis of Woodside Petroleum
VerifiedAdded on 2020/05/28
|31
|9876
|56
Project
AI Summary
This project report delves into various aspects of finance, commencing with a financial literacy section comparing mortgage scenarios for two individuals, Jane and Carla, analyzing monthly repayments and total interest paid. The report then transitions to a company perspective, focusing on Woodside Petroleum, an Australian oil and gas company. It examines the company's background, cash conversion cycle, and debt financing, alongside bond and share valuations. Finally, the report concludes with a capital budgeting analysis, comparing two projects using free cash flow calculations, discounted payback periods, net present value, and internal rate of return, ultimately offering investment recommendations. The report includes detailed calculations, tables, and analysis to support its findings and conclusions.

RUNNING HEAD: Corporate finance 1
Project Report: Finance
Project Report: Finance
Paraphrase This Document
Need a fresh take? Get an instant paraphrase of this document with our AI Paraphraser
Corporate finance 2
Contents
Part 2...........................................................................................................................................3
Financial Literacy:........................................................................................................................3
Que 1:..........................................................................................................................................3
Calculation of monthly repayments:...........................................................................................3
Calculation of Total interest cover:.............................................................................................4
Que 2:......................................................................................................................................4
Why the differences has occurred in the interest expenses:...................................................4
Part 3...........................................................................................................................................5
Company Perspective..................................................................................................................5
Que 1:......................................................................................................................................5
Background:............................................................................................................................5
Que 2:......................................................................................................................................6
Cash conversion cycle:.............................................................................................................6
Que 3:......................................................................................................................................7
Short term and long term debt financing:...............................................................................7
Que 4:......................................................................................................................................7
Bond valuation:.......................................................................................................................7
Interest coverage ratio:...........................................................................................................8
Que 5:......................................................................................................................................8
Share valuation:.......................................................................................................................8
Task 4:.......................................................................................................................................10
Capital Budgeting:.....................................................................................................................10
Que 1:....................................................................................................................................10
Corporate finance 3
Calculation of free cash flows of both the projects...............................................................10
Que 2:....................................................................................................................................11
Discounted Payback period:..................................................................................................11
Que 3:....................................................................................................................................11
Net present value and internal rate of return.......................................................................11
Que 3:....................................................................................................................................12
Recommendation:.................................................................................................................12
References.................................................................................................................................13
Appendix...................................................................................................................................14
⊘ This is a preview!⊘
Do you want full access?
Subscribe today to unlock all pages.
Trusted by 1+ million students worldwide
Corporate finance 4
Part 2
Financial Literacy:
Que 1:
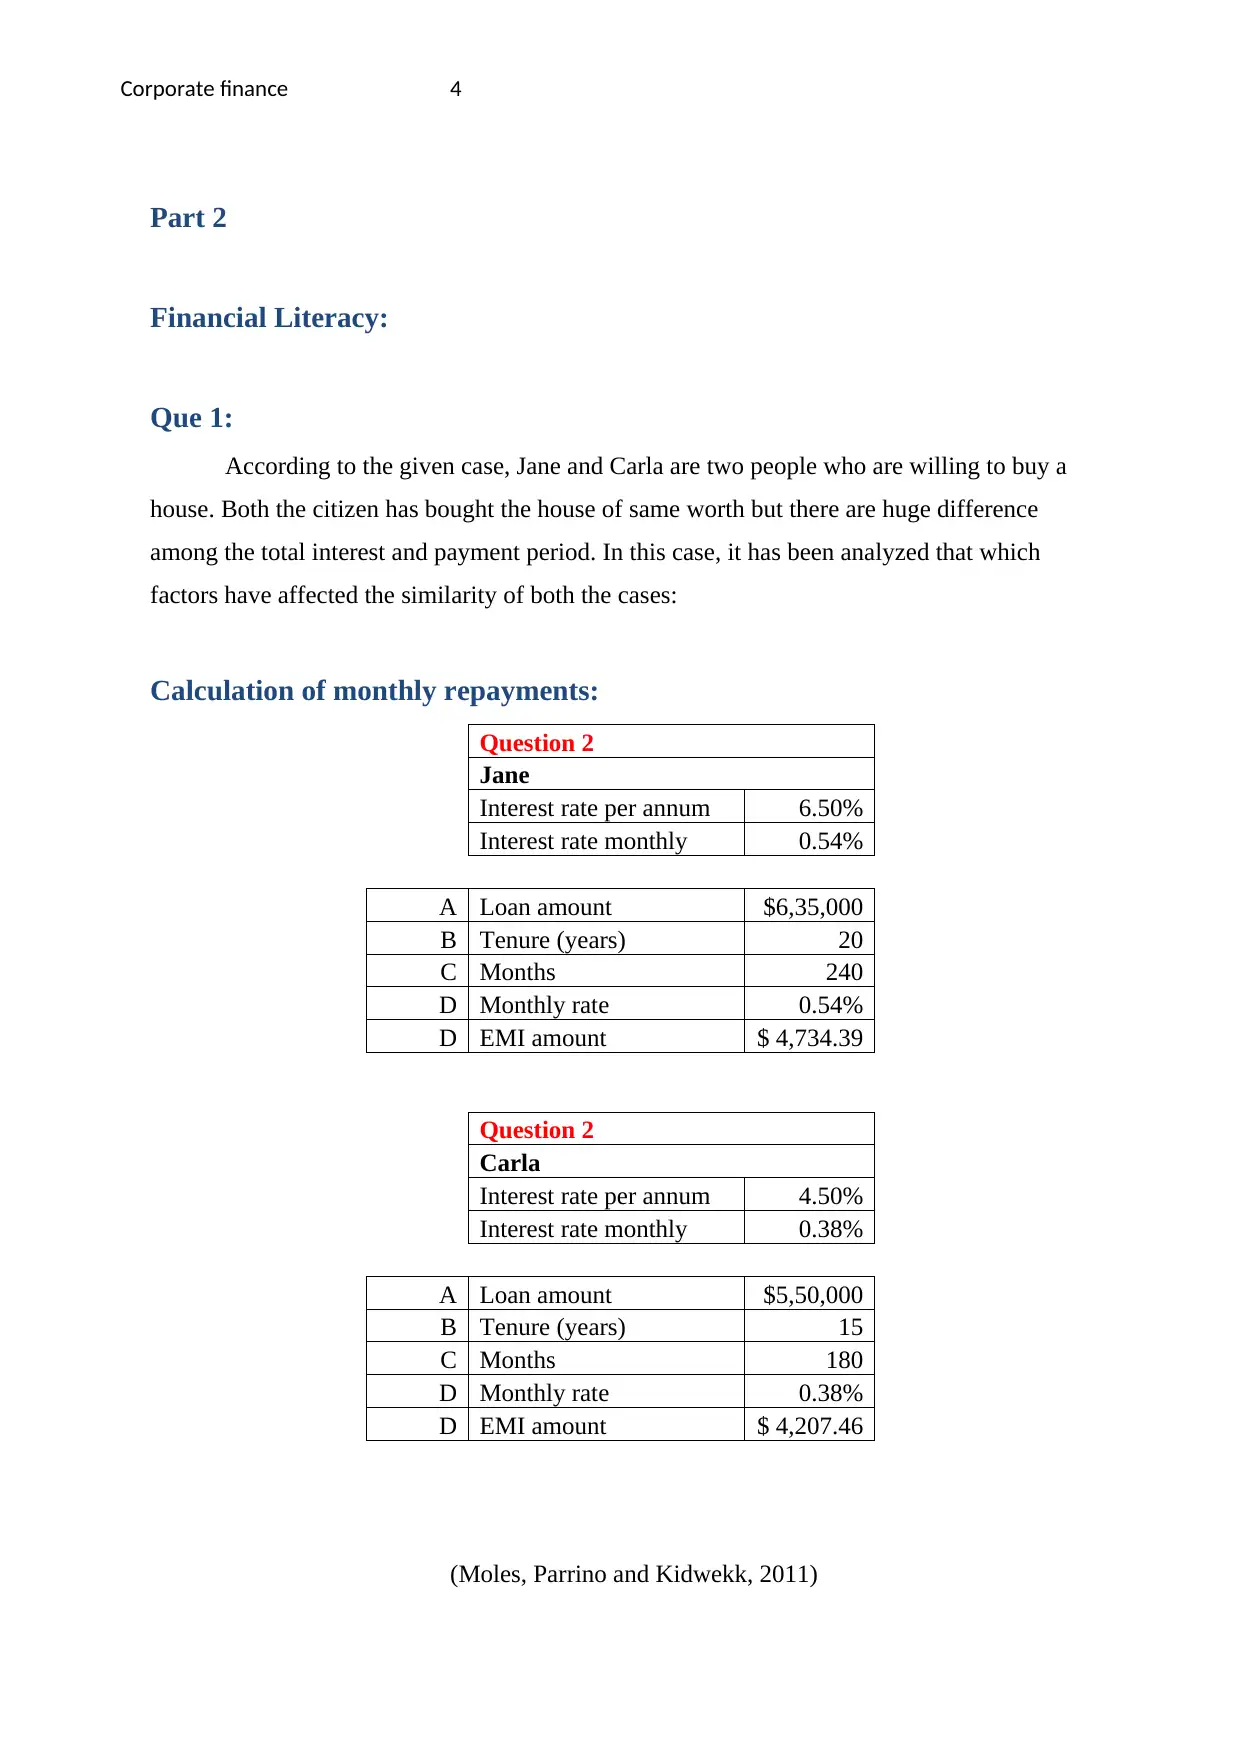
According to the given case, Jane and Carla are two people who are willing to buy a
house. Both the citizen has bought the house of same worth but there are huge difference
among the total interest and payment period. In this case, it has been analyzed that which
factors have affected the similarity of both the cases:
Calculation of monthly repayments:
Question 2
Jane
Interest rate per annum 6.50%
Interest rate monthly 0.54%
A Loan amount $6,35,000
B Tenure (years) 20
C Months 240
D Monthly rate 0.54%
D EMI amount $ 4,734.39
Question 2
Carla
Interest rate per annum 4.50%
Interest rate monthly 0.38%
A Loan amount $5,50,000
B Tenure (years) 15
C Months 180
D Monthly rate 0.38%
D EMI amount $ 4,207.46
(Moles, Parrino and Kidwekk, 2011)
Part 2
Financial Literacy:
Que 1:
According to the given case, Jane and Carla are two people who are willing to buy a
house. Both the citizen has bought the house of same worth but there are huge difference
among the total interest and payment period. In this case, it has been analyzed that which
factors have affected the similarity of both the cases:
Calculation of monthly repayments:
Question 2
Jane
Interest rate per annum 6.50%
Interest rate monthly 0.54%
A Loan amount $6,35,000
B Tenure (years) 20
C Months 240
D Monthly rate 0.54%
D EMI amount $ 4,734.39
Question 2
Carla
Interest rate per annum 4.50%
Interest rate monthly 0.38%
A Loan amount $5,50,000
B Tenure (years) 15
C Months 180
D Monthly rate 0.38%
D EMI amount $ 4,207.46
(Moles, Parrino and Kidwekk, 2011)
Paraphrase This Document
Need a fresh take? Get an instant paraphrase of this document with our AI Paraphraser
Corporate finance 5
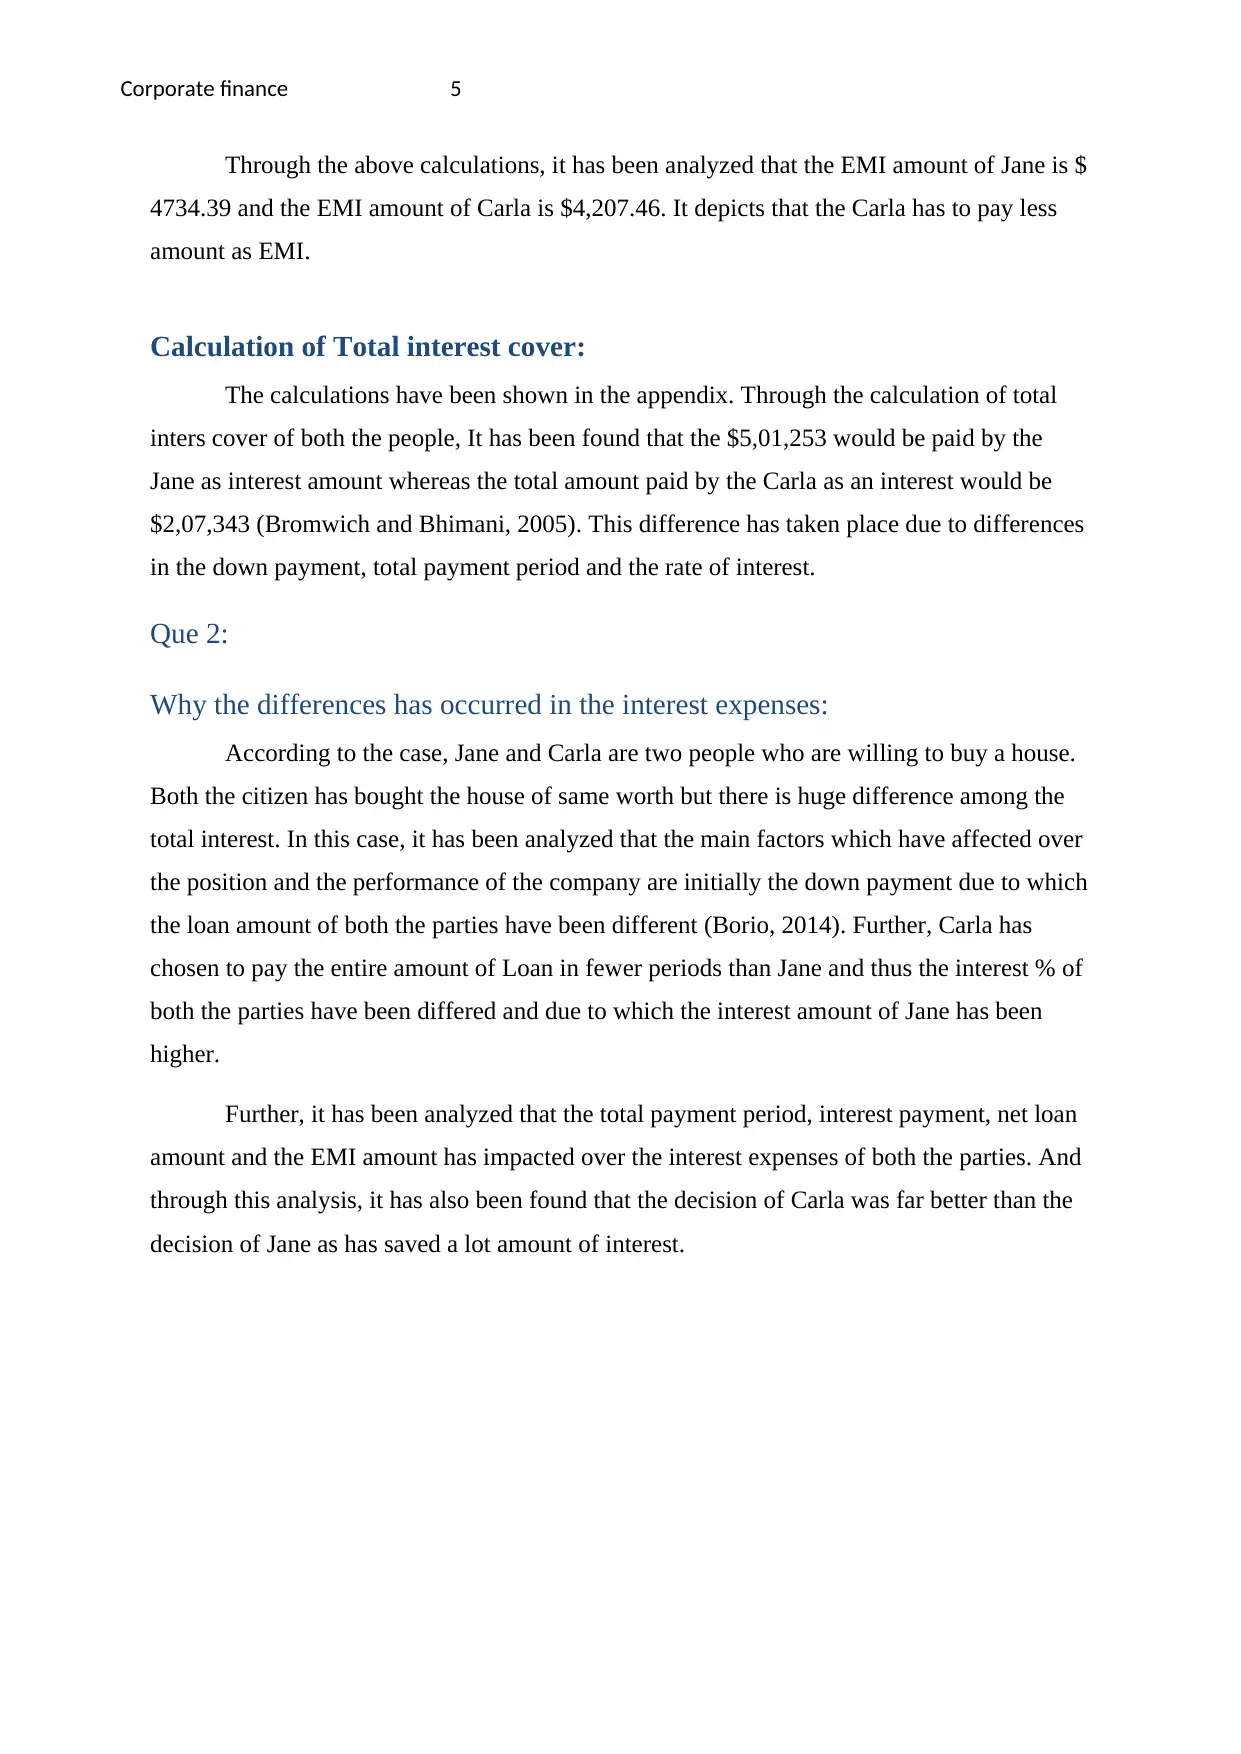
Through the above calculations, it has been analyzed that the EMI amount of Jane is $
4734.39 and the EMI amount of Carla is $4,207.46. It depicts that the Carla has to pay less
amount as EMI.
Calculation of Total interest cover:
The calculations have been shown in the appendix. Through the calculation of total
inters cover of both the people, It has been found that the $5,01,253 would be paid by the
Jane as interest amount whereas the total amount paid by the Carla as an interest would be
$2,07,343 (Bromwich and Bhimani, 2005). This difference has taken place due to differences
in the down payment, total payment period and the rate of interest.
Que 2:
Why the differences has occurred in the interest expenses:
According to the case, Jane and Carla are two people who are willing to buy a house.
Both the citizen has bought the house of same worth but there is huge difference among the
total interest. In this case, it has been analyzed that the main factors which have affected over
the position and the performance of the company are initially the down payment due to which
the loan amount of both the parties have been different (Borio, 2014). Further, Carla has
chosen to pay the entire amount of Loan in fewer periods than Jane and thus the interest % of
both the parties have been differed and due to which the interest amount of Jane has been
higher.
Further, it has been analyzed that the total payment period, interest payment, net loan
amount and the EMI amount has impacted over the interest expenses of both the parties. And
through this analysis, it has also been found that the decision of Carla was far better than the
decision of Jane as has saved a lot amount of interest.
Corporate finance 6
Part 3:
Company Perspective:
Que 1:
Background:
Woodside petroleum is an Australian production and exploration company. This
company is one of the largest companies of oil and gas industry of Australia. Headquarter of
the comapny is in Perth, Australia and the company has registered its stock in Australian
stock exchange. Mainly, this company is operating its business in exploration of oil and
delivering the gas and oil in international market. In the market of Australia itself, this
company is developing a number of the oil and gas industry of Australia briefs that Woodside
petroleum is one of the natural gas projects. Further, it has been found that manufacturing
companies and this company consists around 13.50% of share of the industry which is
highest than any other company (Nobes and Parkar, 2008). Further, it has been found that the
performance of the company is continuously raising and depict about a better position of the
company. Further, it has been analyzed that the position and the performance of the company
is far better according to the economy position and market condition.
Through the study over the operations of the company, it has been found that the main
strength of this company is its huge share in the market and its innovational operating system.
This system has helped the company t grab more market share and currently, this company
has the great number of projects in hand (Damodaran, 2011). Further, it has also been found
that the number of offshore projects have only been grabbed by the company due to its
innovational technology. Further, the weakness of the company has also been analyzed and it
is the bad relations of the company with its suppliers and the stakeholders. And at the same
time, company is not concentrating on lower level buyers. Through the various articles, it has
been found that this company has failed to manage good relationship with stakeholders and
due to which the operations and the performance of the company has been affected.
⊘ This is a preview!⊘
Do you want full access?
Subscribe today to unlock all pages.
Trusted by 1+ million students worldwide
Corporate finance 7
Que 2:
Cash conversion cycle:
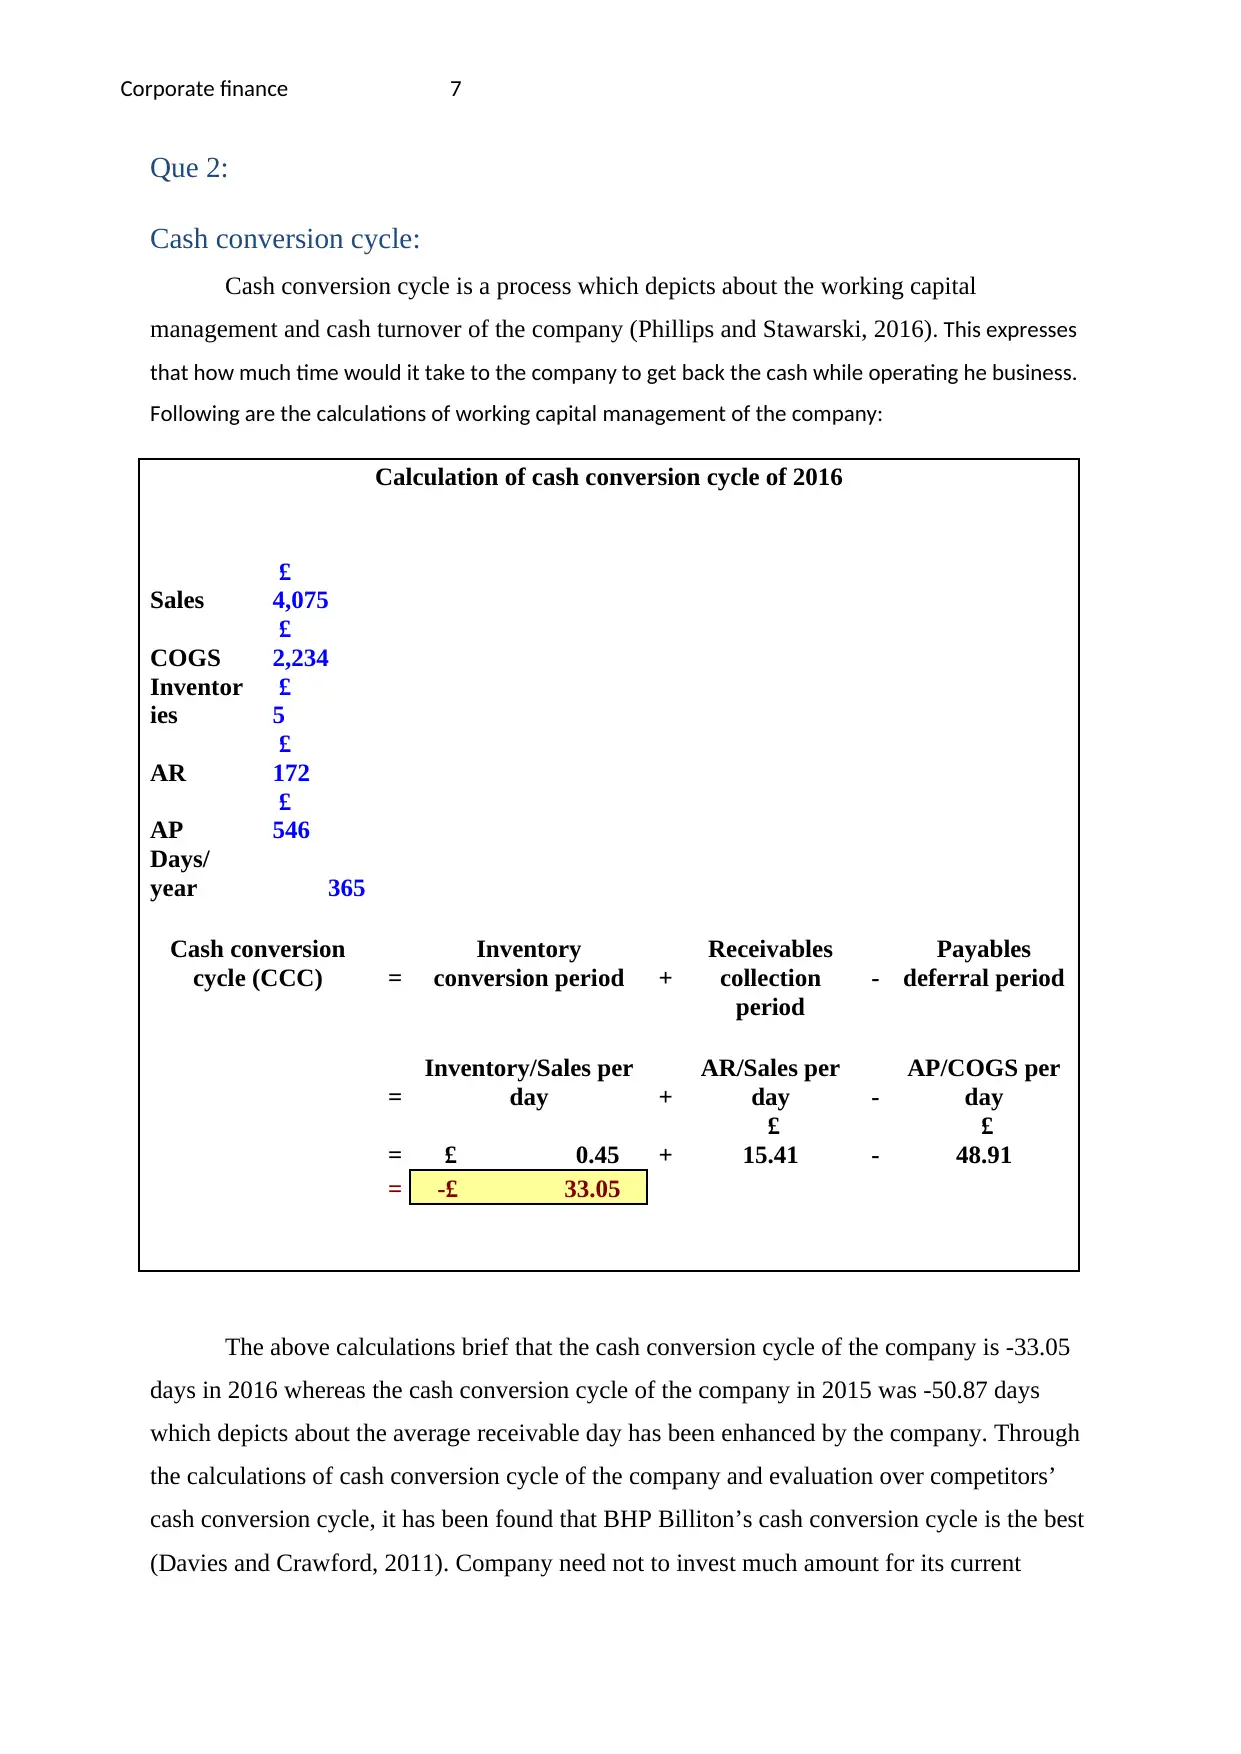
Cash conversion cycle is a process which depicts about the working capital
management and cash turnover of the company (Phillips and Stawarski, 2016). This expresses
that how much time would it take to the company to get back the cash while operating he business.
Following are the calculations of working capital management of the company:
Calculation of cash conversion cycle of 2016
Sales
£
4,075
COGS
£
2,234
Inventor
ies
£
5
AR
£
172
AP
£
546
Days/
year 365
Cash conversion
cycle (CCC) =
Inventory
conversion period +
Receivables
collection
period
-
Payables
deferral period
=
Inventory/Sales per
day +
AR/Sales per
day -
AP/COGS per
day
= £ 0.45 +
£
15.41 -
£
48.91
= -£ 33.05
The above calculations brief that the cash conversion cycle of the company is -33.05
days in 2016 whereas the cash conversion cycle of the company in 2015 was -50.87 days
which depicts about the average receivable day has been enhanced by the company. Through
the calculations of cash conversion cycle of the company and evaluation over competitors’
cash conversion cycle, it has been found that BHP Billiton’s cash conversion cycle is the best
(Davies and Crawford, 2011). Company need not to invest much amount for its current
Que 2:
Cash conversion cycle:
Cash conversion cycle is a process which depicts about the working capital
management and cash turnover of the company (Phillips and Stawarski, 2016). This expresses
that how much time would it take to the company to get back the cash while operating he business.
Following are the calculations of working capital management of the company:
Calculation of cash conversion cycle of 2016
Sales
£
4,075
COGS
£
2,234
Inventor
ies
£
5
AR
£
172
AP
£
546
Days/
year 365
Cash conversion
cycle (CCC) =
Inventory
conversion period +
Receivables
collection
period
-
Payables
deferral period
=
Inventory/Sales per
day +
AR/Sales per
day -
AP/COGS per
day
= £ 0.45 +
£
15.41 -
£
48.91
= -£ 33.05
The above calculations brief that the cash conversion cycle of the company is -33.05
days in 2016 whereas the cash conversion cycle of the company in 2015 was -50.87 days
which depicts about the average receivable day has been enhanced by the company. Through
the calculations of cash conversion cycle of the company and evaluation over competitors’
cash conversion cycle, it has been found that BHP Billiton’s cash conversion cycle is the best
(Davies and Crawford, 2011). Company need not to invest much amount for its current
Paraphrase This Document
Need a fresh take? Get an instant paraphrase of this document with our AI Paraphraser
Corporate finance 8
liabilities. The liquidity position of the company is far better as the payment done by the
company is after so many days whereas the collection of amount is done by the company
quickly. Further, it has also been found that the cash conversion cycle of Woodside petroleum
limited is also far better but the level has been lower in 2016 in comparison of 2015
(Bierman, 2010).
Que 3:
Short term and long term debt financing:
Further short term and long term debt financing of the company has been evaluated
and it has been found that the total short term debt financing of the company is Us $ 963
million in 2016, US $ 1304 million in 2015 whereas the long term debt financing of the
company is US $ 8128 in 2016 and US $ 7510 in 2015. Thus, through the evaluation over
short term and long term debt financing of the company, it has been evaluated that the main
short term debt financing factor of the company is payables which has been lower in 2016
and the main long term debt financing factor of the company is interest bearing liabilities
which are debentures and the borrowings of the company (Brealey, Myers and Marcus,
2007).
The discussed value briefs that company uses the short term as well as long term
debts to manage the position and a good capital structure position of the company. But the
level of short term debts have been reduced by the company to manage the cost whereas the
level of long term has been enhanced by the company to manage optimal capitals structure
and risk and return level.
Que 4:
Bond valuation:
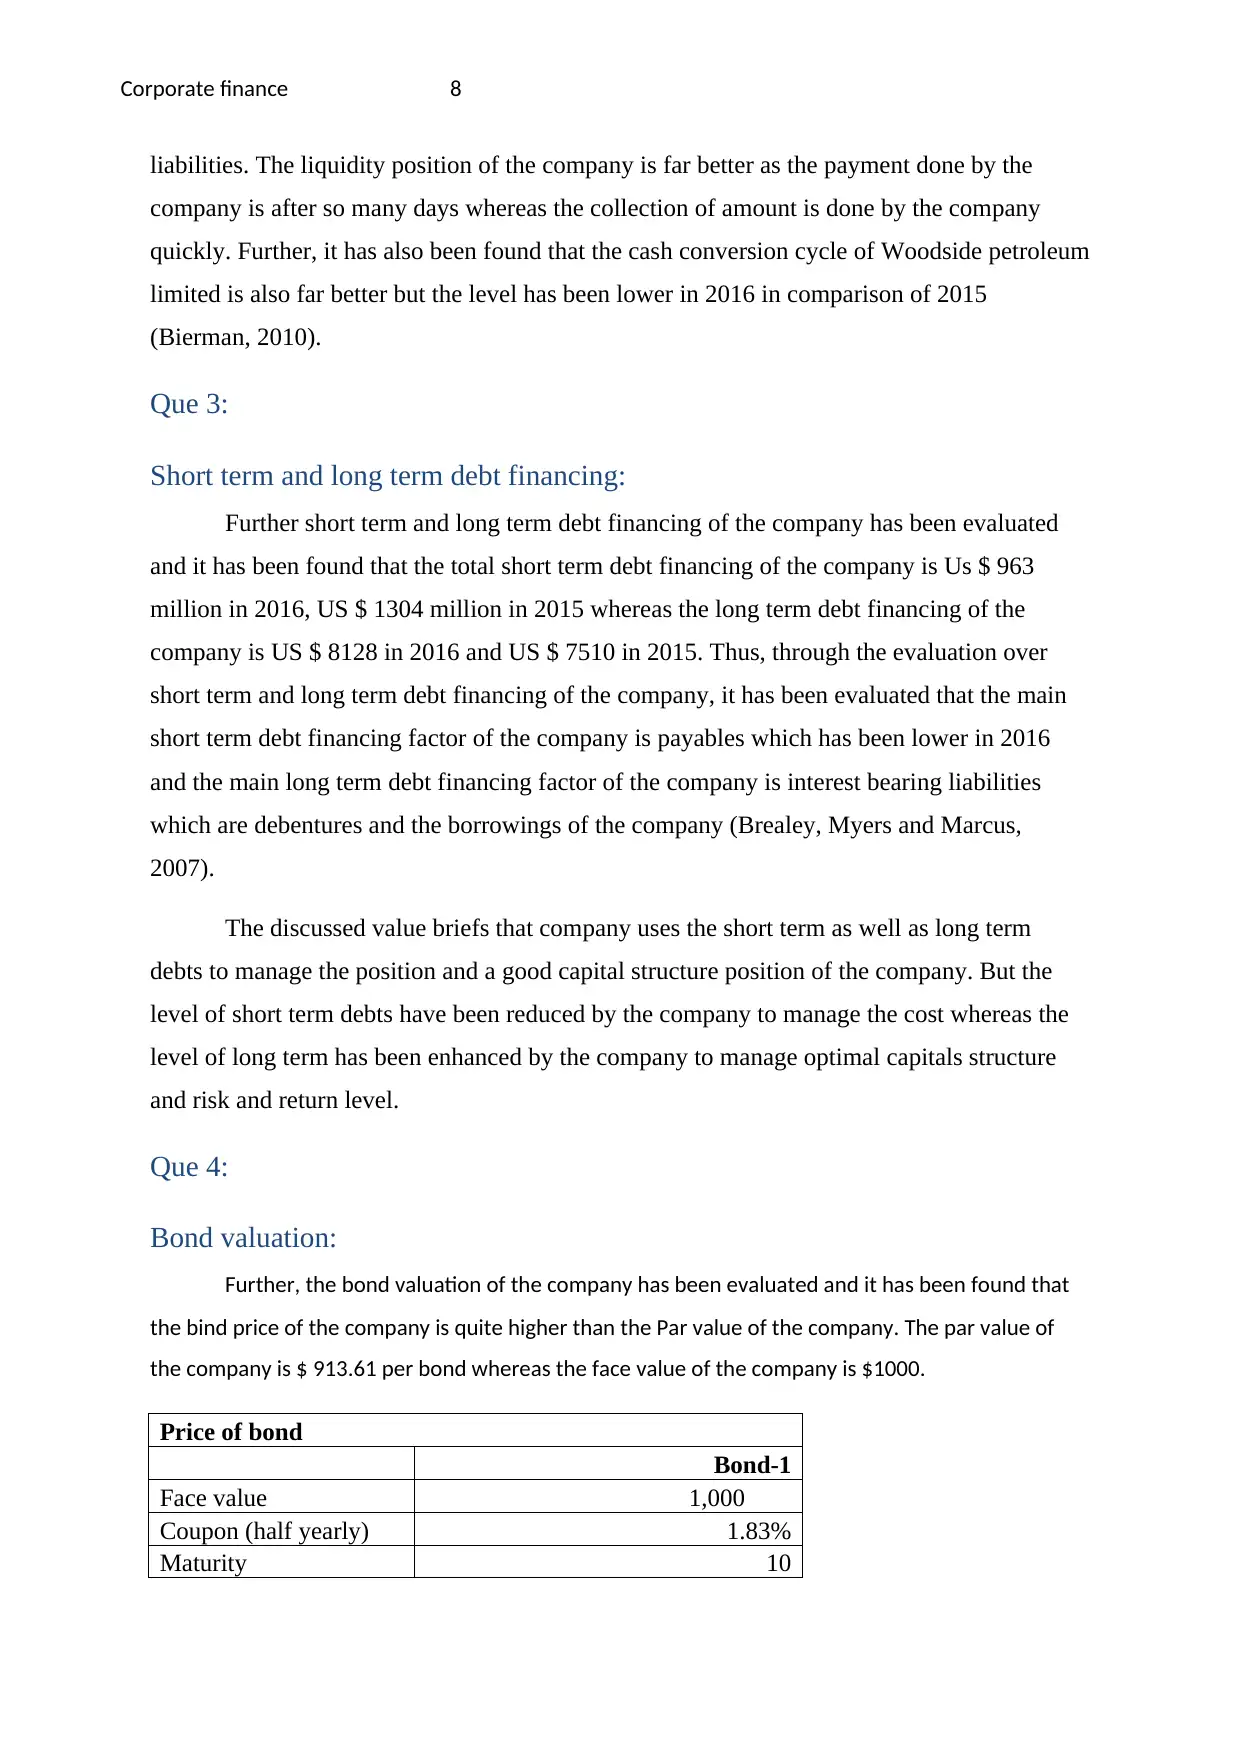
Further, the bond valuation of the company has been evaluated and it has been found that
the bind price of the company is quite higher than the Par value of the company. The par value of
the company is $ 913.61 per bond whereas the face value of the company is $1000.
Price of bond
Bond-1
Face value 1,000
Coupon (half yearly) 1.83%
Maturity 10
liabilities. The liquidity position of the company is far better as the payment done by the
company is after so many days whereas the collection of amount is done by the company
quickly. Further, it has also been found that the cash conversion cycle of Woodside petroleum
limited is also far better but the level has been lower in 2016 in comparison of 2015
(Bierman, 2010).
Que 3:
Short term and long term debt financing:
Further short term and long term debt financing of the company has been evaluated
and it has been found that the total short term debt financing of the company is Us $ 963
million in 2016, US $ 1304 million in 2015 whereas the long term debt financing of the
company is US $ 8128 in 2016 and US $ 7510 in 2015. Thus, through the evaluation over
short term and long term debt financing of the company, it has been evaluated that the main
short term debt financing factor of the company is payables which has been lower in 2016
and the main long term debt financing factor of the company is interest bearing liabilities
which are debentures and the borrowings of the company (Brealey, Myers and Marcus,
2007).
The discussed value briefs that company uses the short term as well as long term
debts to manage the position and a good capital structure position of the company. But the
level of short term debts have been reduced by the company to manage the cost whereas the
level of long term has been enhanced by the company to manage optimal capitals structure
and risk and return level.
Que 4:
Bond valuation:
Further, the bond valuation of the company has been evaluated and it has been found that
the bind price of the company is quite higher than the Par value of the company. The par value of
the company is $ 913.61 per bond whereas the face value of the company is $1000.
Price of bond
Bond-1
Face value 1,000
Coupon (half yearly) 1.83%
Maturity 10
Corporate finance 9
Maturity (half yearly) 5
Yeild (half yearly) 1.55%
Valuation of bond 913.61
PV(D17,D19,D20,D16,0)
(Arnold, 2013)
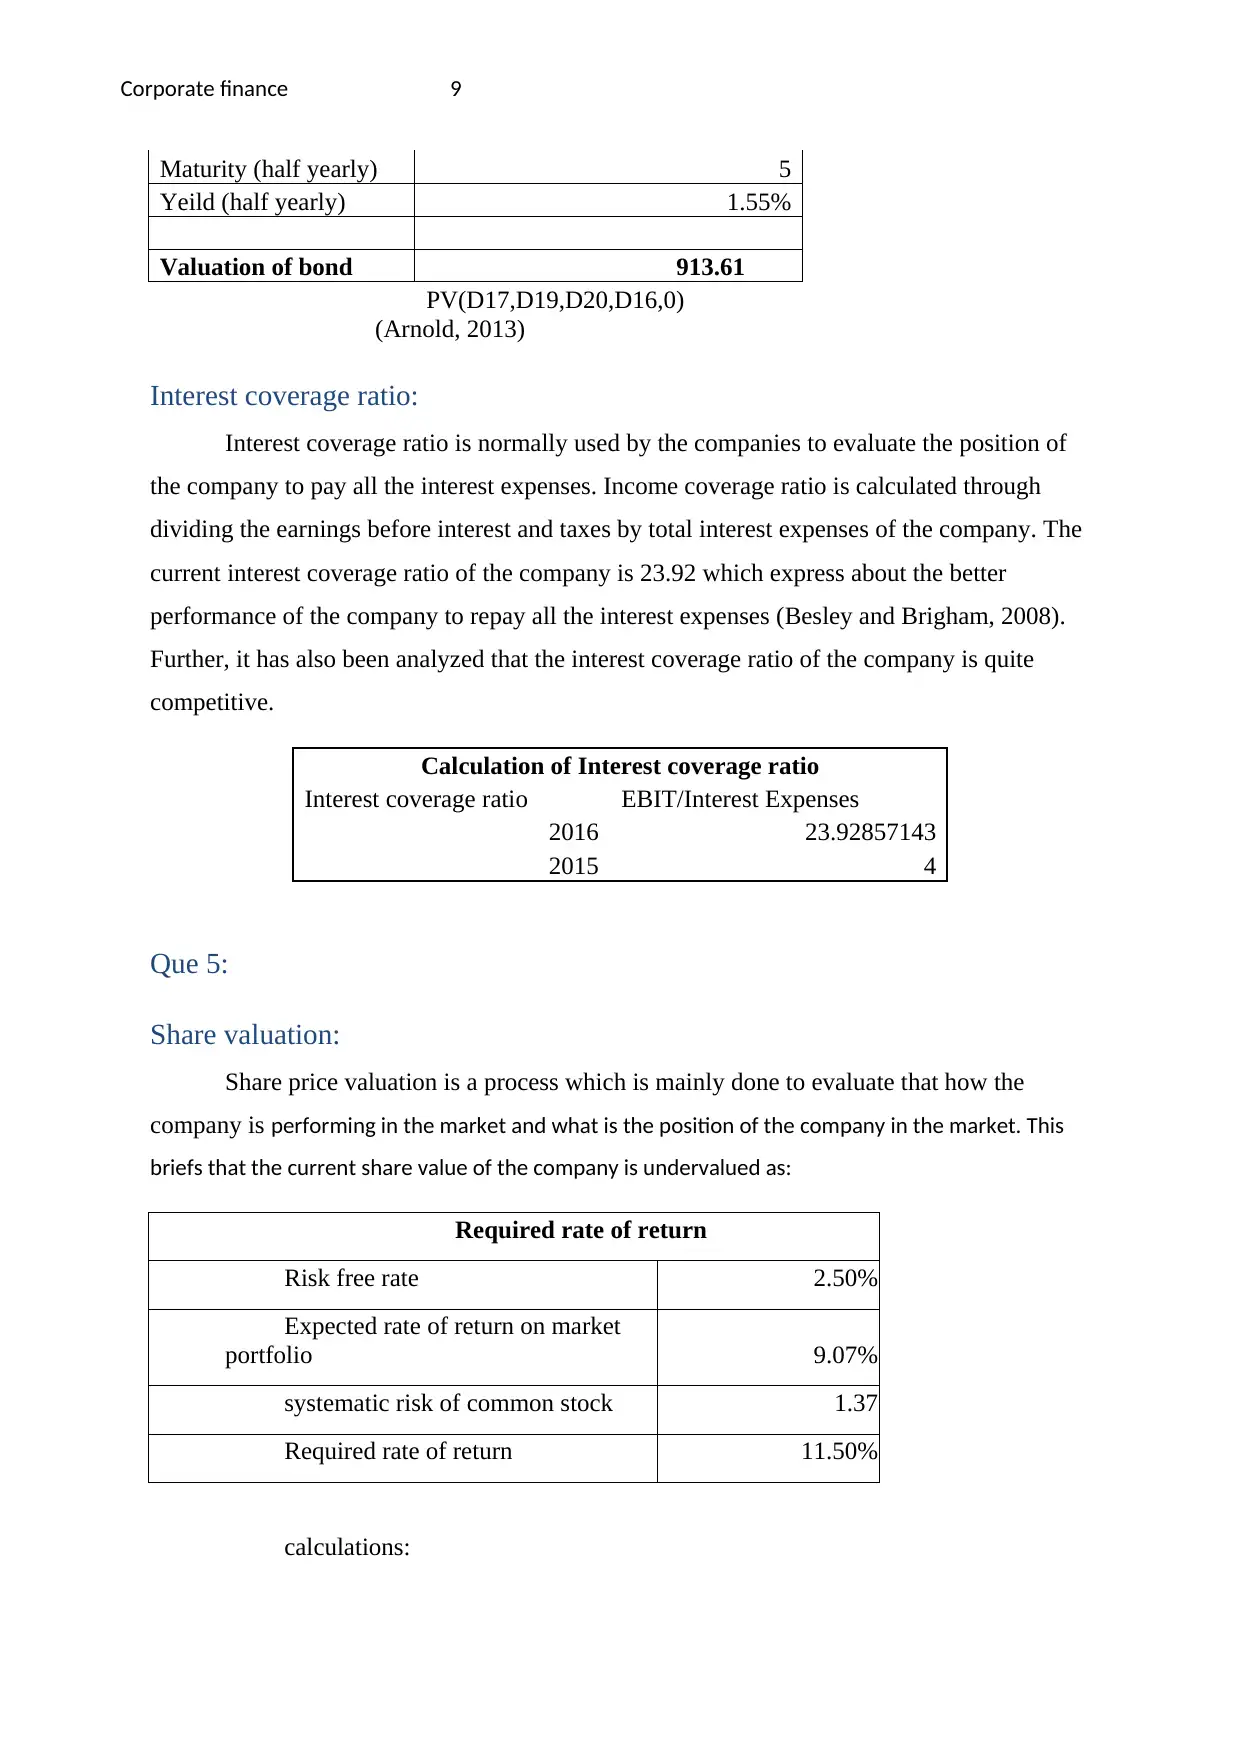
Interest coverage ratio:
Interest coverage ratio is normally used by the companies to evaluate the position of
the company to pay all the interest expenses. Income coverage ratio is calculated through
dividing the earnings before interest and taxes by total interest expenses of the company. The
current interest coverage ratio of the company is 23.92 which express about the better
performance of the company to repay all the interest expenses (Besley and Brigham, 2008).
Further, it has also been analyzed that the interest coverage ratio of the company is quite
competitive.
Calculation of Interest coverage ratio
Interest coverage ratio EBIT/Interest Expenses
2016 23.92857143
2015 4
Que 5:
Share valuation:
Share price valuation is a process which is mainly done to evaluate that how the
company is performing in the market and what is the position of the company in the market. This
briefs that the current share value of the company is undervalued as:
Required rate of return
Risk free rate 2.50%
Expected rate of return on market
portfolio 9.07%
systematic risk of common stock 1.37
Required rate of return 11.50%
calculations:
Maturity (half yearly) 5
Yeild (half yearly) 1.55%
Valuation of bond 913.61
PV(D17,D19,D20,D16,0)
(Arnold, 2013)
Interest coverage ratio:
Interest coverage ratio is normally used by the companies to evaluate the position of
the company to pay all the interest expenses. Income coverage ratio is calculated through
dividing the earnings before interest and taxes by total interest expenses of the company. The
current interest coverage ratio of the company is 23.92 which express about the better
performance of the company to repay all the interest expenses (Besley and Brigham, 2008).
Further, it has also been analyzed that the interest coverage ratio of the company is quite
competitive.
Calculation of Interest coverage ratio
Interest coverage ratio EBIT/Interest Expenses
2016 23.92857143
2015 4
Que 5:
Share valuation:
Share price valuation is a process which is mainly done to evaluate that how the
company is performing in the market and what is the position of the company in the market. This
briefs that the current share value of the company is undervalued as:
Required rate of return
Risk free rate 2.50%
Expected rate of return on market
portfolio 9.07%
systematic risk of common stock 1.37
Required rate of return 11.50%
calculations:
⊘ This is a preview!⊘
Do you want full access?
Subscribe today to unlock all pages.
Trusted by 1+ million students worldwide
Corporate finance 10
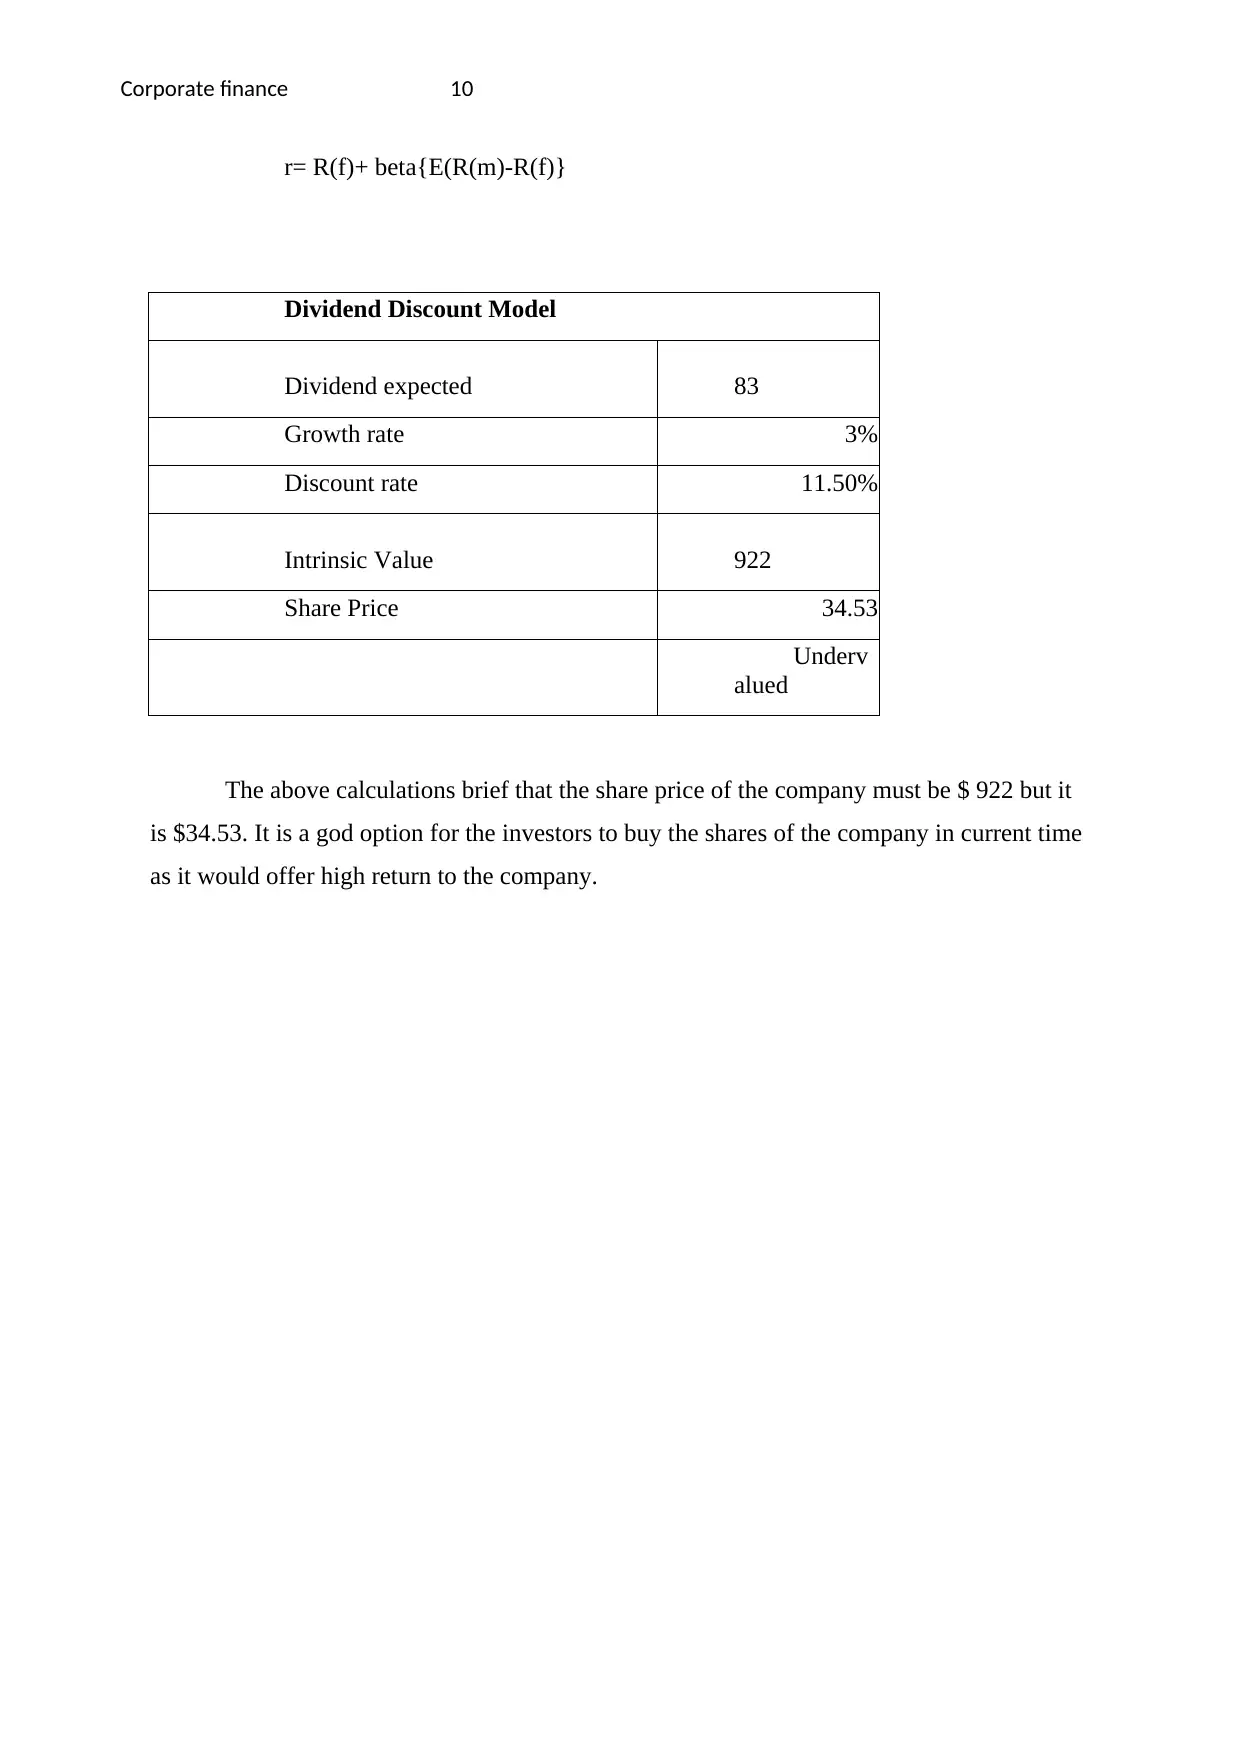
r= R(f)+ beta{E(R(m)-R(f)}
Dividend Discount Model
Dividend expected 83
Growth rate 3%
Discount rate 11.50%
Intrinsic Value 922
Share Price 34.53
Underv
alued
The above calculations brief that the share price of the company must be $ 922 but it
is $34.53. It is a god option for the investors to buy the shares of the company in current time
as it would offer high return to the company.
Paraphrase This Document
Need a fresh take? Get an instant paraphrase of this document with our AI Paraphraser
Corporate finance 11
Task 4:
Capital Budgeting:
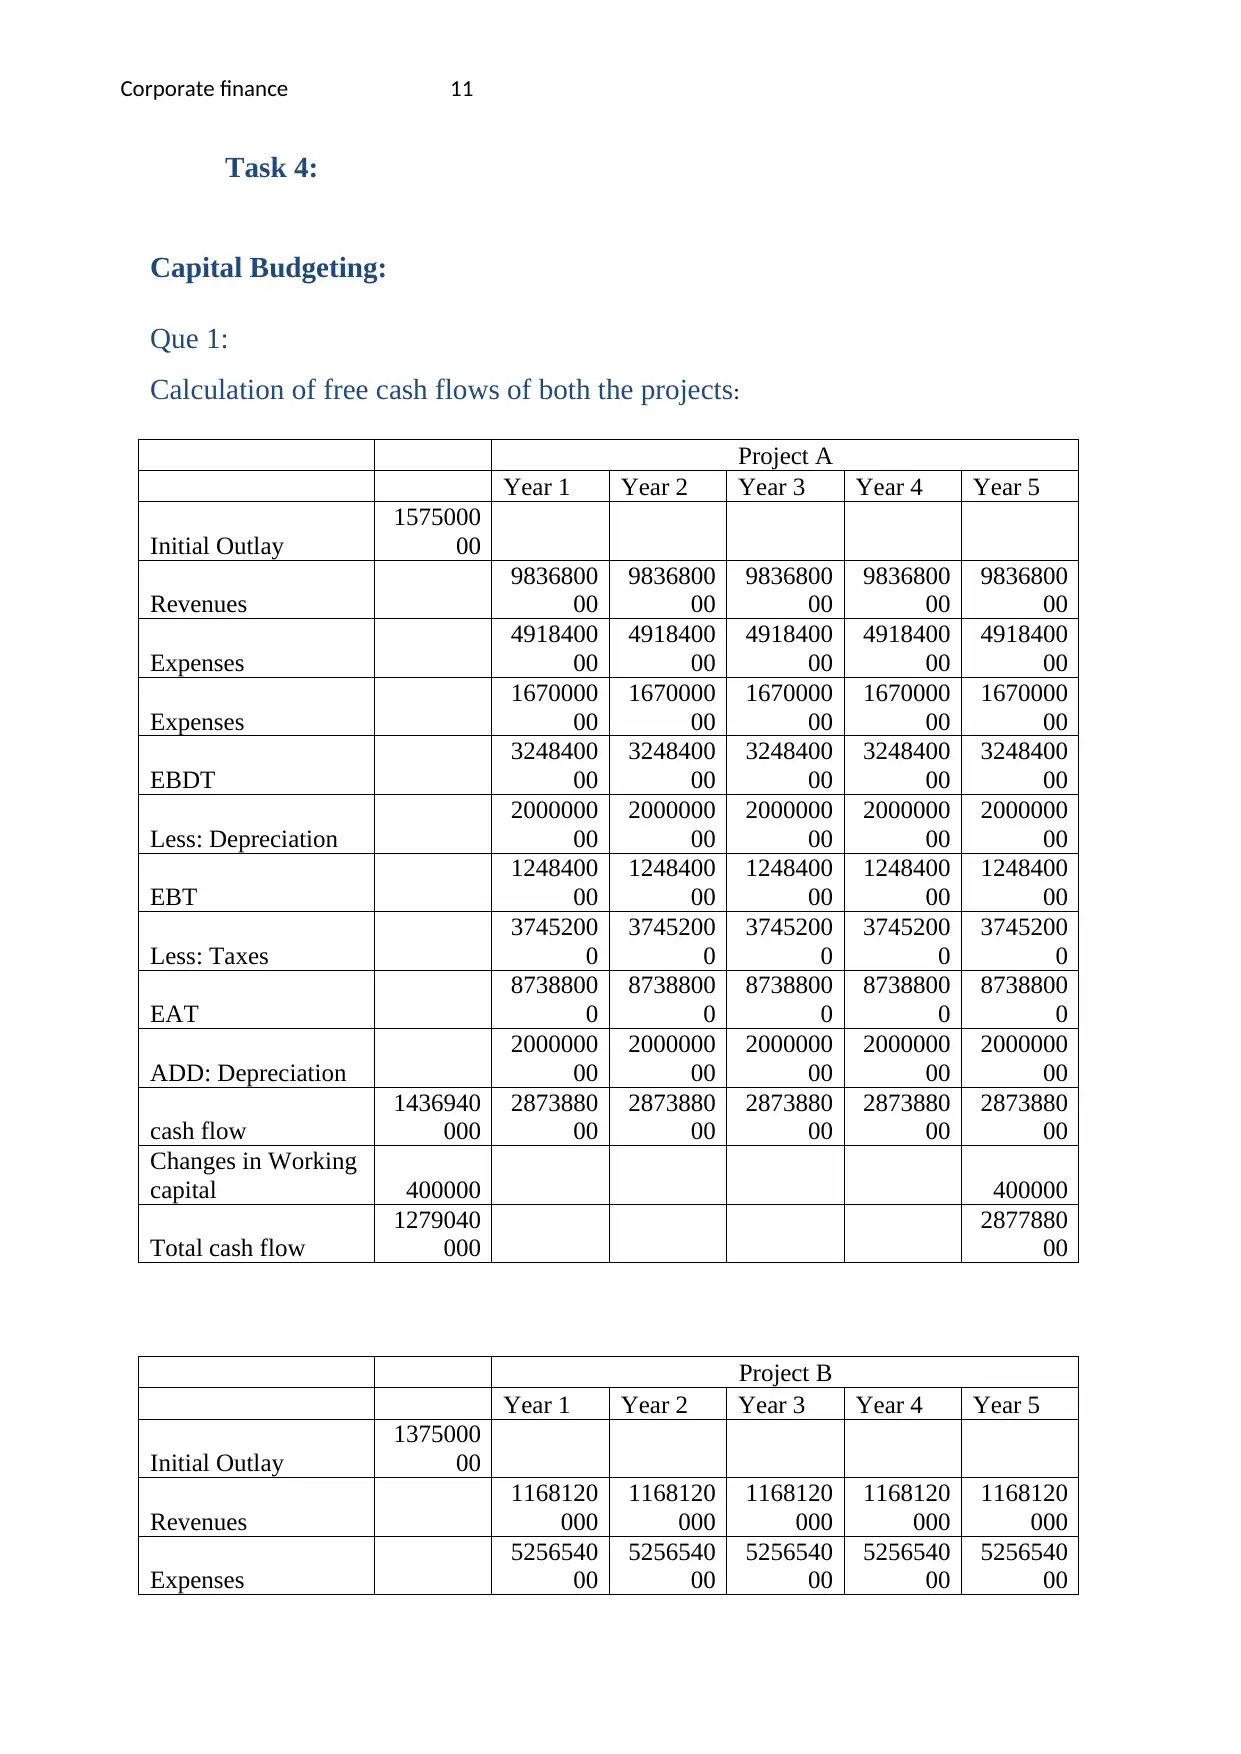
Que 1:
Calculation of free cash flows of both the projects:
Project A
Year 1 Year 2 Year 3 Year 4 Year 5
Initial Outlay
1575000
00
Revenues
9836800
00
9836800
00
9836800
00
9836800
00
9836800
00
Expenses
4918400
00
4918400
00
4918400
00
4918400
00
4918400
00
Expenses
1670000
00
1670000
00
1670000
00
1670000
00
1670000
00
EBDT
3248400
00
3248400
00
3248400
00
3248400
00
3248400
00
Less: Depreciation
2000000
00
2000000
00
2000000
00
2000000
00
2000000
00
EBT
1248400
00
1248400
00
1248400
00
1248400
00
1248400
00
Less: Taxes
3745200
0
3745200
0
3745200
0
3745200
0
3745200
0
EAT
8738800
0
8738800
0
8738800
0
8738800
0
8738800
0
ADD: Depreciation
2000000
00
2000000
00
2000000
00
2000000
00
2000000
00
cash flow
1436940
000
2873880
00
2873880
00
2873880
00
2873880
00
2873880
00
Changes in Working
capital 400000 400000
Total cash flow
1279040
000
2877880
00
Project B
Year 1 Year 2 Year 3 Year 4 Year 5
Initial Outlay
1375000
00
Revenues
1168120
000
1168120
000
1168120
000
1168120
000
1168120
000
Expenses
5256540
00
5256540
00
5256540
00
5256540
00
5256540
00
Task 4:
Capital Budgeting:
Que 1:
Calculation of free cash flows of both the projects:
Project A
Year 1 Year 2 Year 3 Year 4 Year 5
Initial Outlay
1575000
00
Revenues
9836800
00
9836800
00
9836800
00
9836800
00
9836800
00
Expenses
4918400
00
4918400
00
4918400
00
4918400
00
4918400
00
Expenses
1670000
00
1670000
00
1670000
00
1670000
00
1670000
00
EBDT
3248400
00
3248400
00
3248400
00
3248400
00
3248400
00
Less: Depreciation
2000000
00
2000000
00
2000000
00
2000000
00
2000000
00
EBT
1248400
00
1248400
00
1248400
00
1248400
00
1248400
00
Less: Taxes
3745200
0
3745200
0
3745200
0
3745200
0
3745200
0
EAT
8738800
0
8738800
0
8738800
0
8738800
0
8738800
0
ADD: Depreciation
2000000
00
2000000
00
2000000
00
2000000
00
2000000
00
cash flow
1436940
000
2873880
00
2873880
00
2873880
00
2873880
00
2873880
00
Changes in Working
capital 400000 400000
Total cash flow
1279040
000
2877880
00
Project B
Year 1 Year 2 Year 3 Year 4 Year 5
Initial Outlay
1375000
00
Revenues
1168120
000
1168120
000
1168120
000
1168120
000
1168120
000
Expenses
5256540
00
5256540
00
5256540
00
5256540
00
5256540
00
Corporate finance 12
Expenses
1252500
00
1252500
00
1252500
00
1252500
00
1252500
00
EBDT
5172160
00
5172160
00
5172160
00
5172160
00
5172160
00
Less: Depreciation
2000000
00
2000000
00
2000000
00
2000000
00
2000000
00
EBT
3172160
00
3172160
00
3172160
00
3172160
00
3172160
00
Less: Taxes
9516480
0
9516480
0
9516480
0
9516480
0
9516480
0
EAT
2220512
00
2220512
00
2220512
00
2220512
00
2220512
00
ADD: Depreciation
2000000
00
2000000
00
2000000
00
2000000
00
2000000
00
cash flow
2110256
000
4220512
00
4220512
00
4220512
00
4220512
00
4220512
00
Changes in Working
capital 400000 400000
Total cash flow
1972356
000
4224512
00
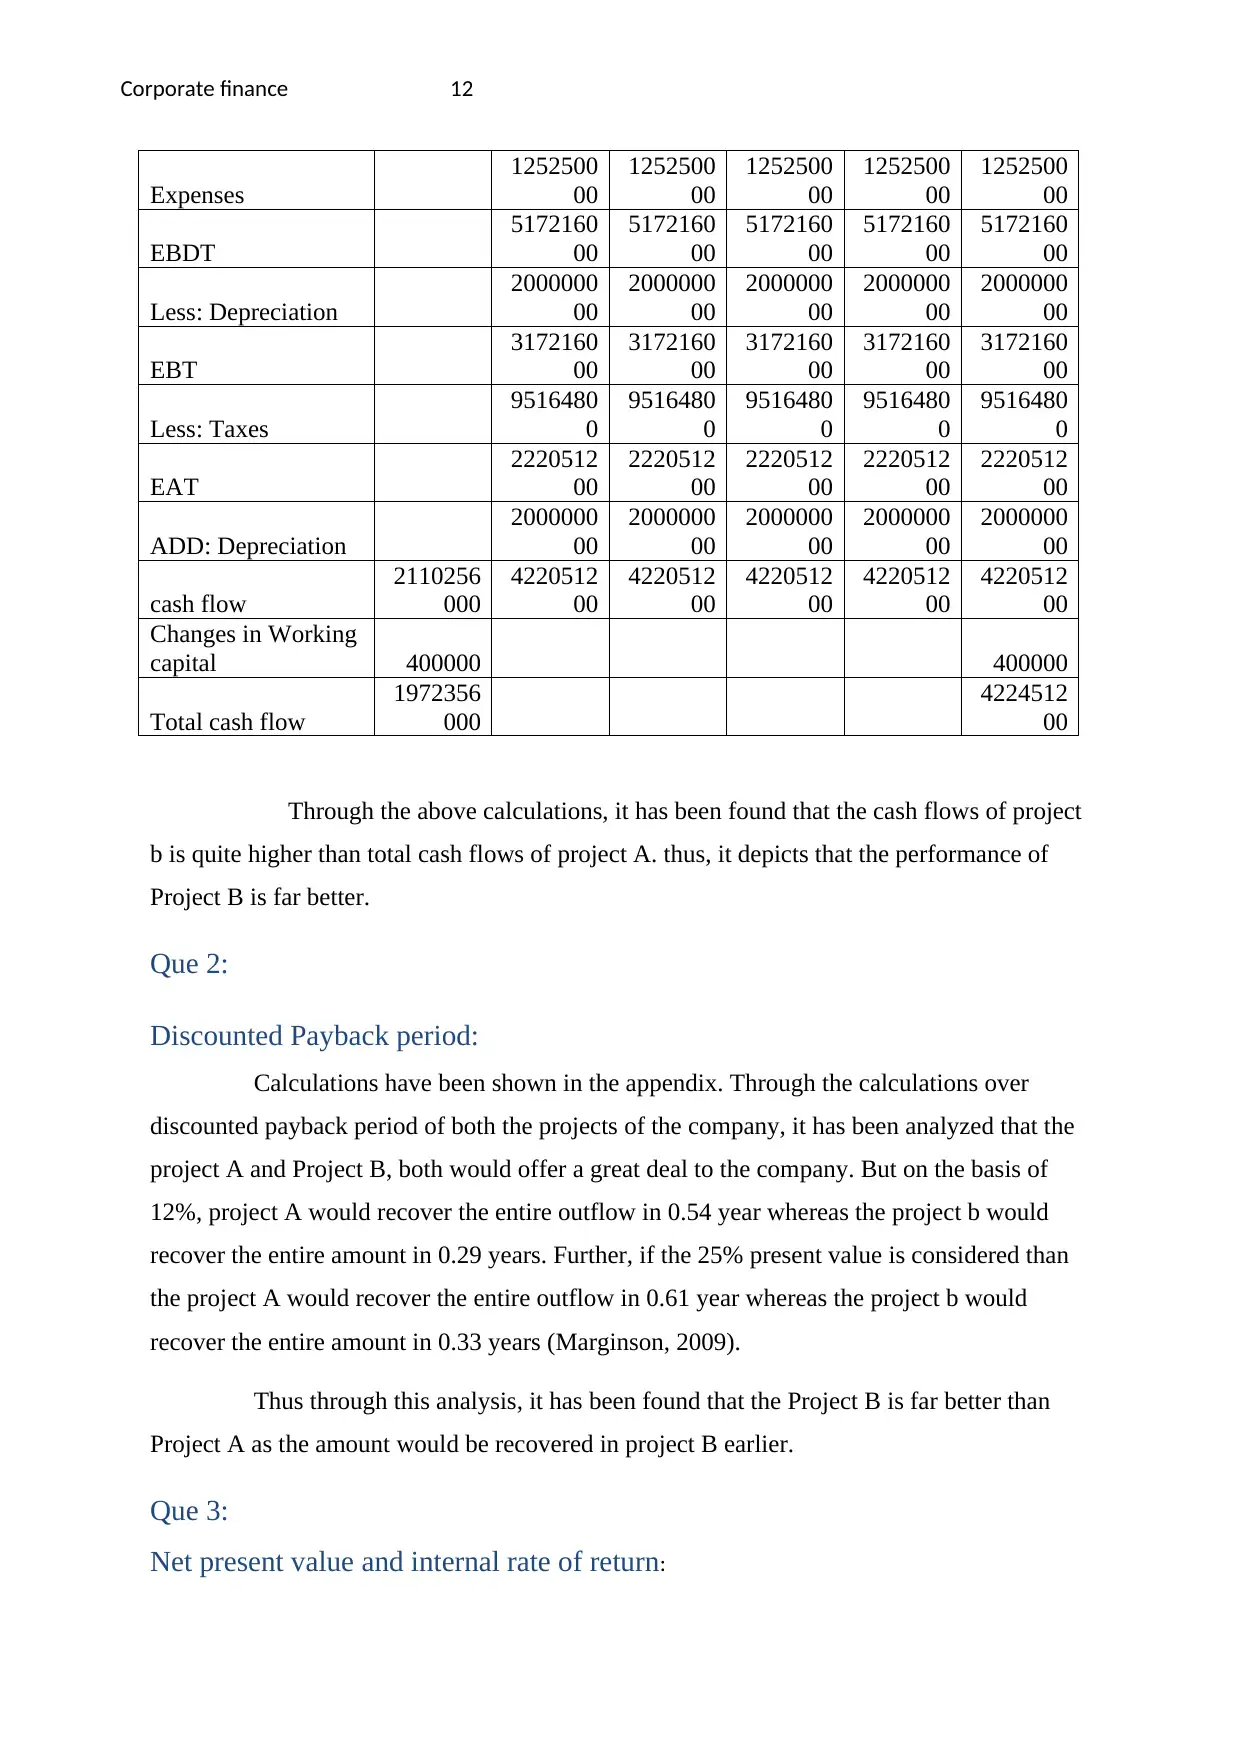
Through the above calculations, it has been found that the cash flows of project
b is quite higher than total cash flows of project A. thus, it depicts that the performance of
Project B is far better.
Que 2:
Discounted Payback period:
Calculations have been shown in the appendix. Through the calculations over
discounted payback period of both the projects of the company, it has been analyzed that the
project A and Project B, both would offer a great deal to the company. But on the basis of
12%, project A would recover the entire outflow in 0.54 year whereas the project b would
recover the entire amount in 0.29 years. Further, if the 25% present value is considered than
the project A would recover the entire outflow in 0.61 year whereas the project b would
recover the entire amount in 0.33 years (Marginson, 2009).
Thus through this analysis, it has been found that the Project B is far better than
Project A as the amount would be recovered in project B earlier.
Que 3:
Net present value and internal rate of return:
Expenses
1252500
00
1252500
00
1252500
00
1252500
00
1252500
00
EBDT
5172160
00
5172160
00
5172160
00
5172160
00
5172160
00
Less: Depreciation
2000000
00
2000000
00
2000000
00
2000000
00
2000000
00
EBT
3172160
00
3172160
00
3172160
00
3172160
00
3172160
00
Less: Taxes
9516480
0
9516480
0
9516480
0
9516480
0
9516480
0
EAT
2220512
00
2220512
00
2220512
00
2220512
00
2220512
00
ADD: Depreciation
2000000
00
2000000
00
2000000
00
2000000
00
2000000
00
cash flow
2110256
000
4220512
00
4220512
00
4220512
00
4220512
00
4220512
00
Changes in Working
capital 400000 400000
Total cash flow
1972356
000
4224512
00
Through the above calculations, it has been found that the cash flows of project
b is quite higher than total cash flows of project A. thus, it depicts that the performance of
Project B is far better.
Que 2:
Discounted Payback period:
Calculations have been shown in the appendix. Through the calculations over
discounted payback period of both the projects of the company, it has been analyzed that the
project A and Project B, both would offer a great deal to the company. But on the basis of
12%, project A would recover the entire outflow in 0.54 year whereas the project b would
recover the entire amount in 0.29 years. Further, if the 25% present value is considered than
the project A would recover the entire outflow in 0.61 year whereas the project b would
recover the entire amount in 0.33 years (Marginson, 2009).
Thus through this analysis, it has been found that the Project B is far better than
Project A as the amount would be recovered in project B earlier.
Que 3:
Net present value and internal rate of return:
⊘ This is a preview!⊘
Do you want full access?
Subscribe today to unlock all pages.
Trusted by 1+ million students worldwide
1 out of 31
Related Documents


Your All-in-One AI-Powered Toolkit for Academic Success.
+13062052269
info@desklib.com
Available 24*7 on WhatsApp / Email
![[object Object]](/_next/static/media/star-bottom.7253800d.svg)
Unlock your academic potential
Copyright © 2020–2026 A2Z Services. All Rights Reserved. Developed and managed by ZUCOL.