Data Analytics Application in Business: A Woolworths Group Case Study
VerifiedAdded on 2024/06/21
|11
|2371
|256
Case Study
AI Summary
This case study delves into the application of data analytics within the Woolworths Group, a leading retail organization in Australia, to enhance business decisions and improve strategies. It examines Woolworths' current operational modes, highlighting potential inefficiencies stemming from reliance on reports, audits, and customer ratings, which can introduce unreliability. The study identifies various data sources available to Woolworths, including supermarket sales, merchandise sales, customer preferences, product sales, service proportions, and retail shopping data. It proposes analytic techniques like association rule learning, classification tree analysis, genetic algorithms, machine learning, and social network analysis to leverage these data sources effectively. The anticipated outcomes of implementing data analytics include improved decision-making efficiency, enhanced customer relationships, risk management, strategic development, increased revenue, and a stronger social media presence, ultimately positioning Woolworths for sustained growth and competitive advantage. Desklib provides access to this and similar case studies for students.
Introduction to Data Analytics for Business
Data Analytics Case Study
Data Analytics Case Study
Paraphrase This Document
Need a fresh take? Get an instant paraphrase of this document with our AI Paraphraser
Introduction
This report entails the data analysis case study of an organisation that describes the data analytics
for helping in creating(Grover, V., Chiang, R.H., Liang, T.P. and Zhang, D., 2018) more efficient
business decisions and help improve the strategies. In this particular case, The Woolworths Group
that leads in extensive retail interests in Australia has been considered. It deals with food and also
specializes in supermarket and consumer store operations on wide range of products. The report
proposes a data-driven decision making application of the data analytics. The various operations
and modes of operation of the Woolworth Group has been covered which sets a base for discovering
factors and grounds for implementing data-driven decision making. The minute and possible
inefficiencies have been included along with the solution to refactor them. In the light of data
analytic, the different sources from where the organisation gets the data, i.e. the Data sources have
been included. With close analysis of the data gathered, a proposed data analysis technique and
analysis has been given. With the dataset analysis and the outcomes of it, the possible developments
and implementations have been drafted out to reach out to the stakeholders of the organisation to
create an opportunity for the data analytics and decision making.
The Woolworth Group
The Woolworth Group is a huge organisation with 215000 employees that offers the retail
operations throughout Australia and New Zealand. It deals with supermarket and merchandise
stores and also involves in food, liquor and wide range of products procurement. It also operates
hospitality services such as hotel chains that includes number of food outlets, pubs and gaming
operations. Apart from all these, it also operates the financial and insurance services.
Current Mode of Operation
The Woolworths manage their business in the fields of supply chain and distribution network. The
strategies are mostly in the supervision, design and redesign of the business operations for wide
range of products and services. Their mode of operation is customer based(Woolworths,2019), i.e.
the customers they serve. The current mode includes, sales report, supply distribution, chain supply
reports etc. The distribution of the supply chains is based on the customer demands and proportions.
The organization has the strategy of building the modes of business operations based on the sales
and product demands. They redesign this if there is any shift in the trend of the products demanded
by the consumers or the purchase trends of the supermarkets. Woolworths is known for providing
cheaper and reliable products in Australia. It manages all sort of products and supermarket shopping
experience.
The main operation mode of this organisation is the survey method. It tasks its merchandise and
other retail outlets and the suppliers to create and perform surveys to determine the engagement of
the organisation and its services, meeting with the demand requirements, equitably with the
suppliers, audits and customer rating system.
Possible Inefficiencies
There are a lot of inefficiencies in the current operation mode of the Woolworths organisation. The
main sources of the information about the business and the decision making is based on the reports,
audits and ratings. This creates grounds for false and unreliable data and information. The chances
of errors and wrong data is high in the above operation modes specified. The sales reports are the
main information source that provides the right and true clauses for decision making and drafting
business opportunities. The design of the business standards and strategies is based on these input
factors that are not truly reliable. The customer ratings and surveys may be done in a way that does
not provides sufficient data and information for the proper analysis of the business. Customer
⊘ This is a preview!⊘
Do you want full access?
Subscribe today to unlock all pages.
Trusted by 1+ million students worldwide
ratings could be falsified by the end parties and most of the surveys are not independent or from
reliable sources. In the food sector, there is no proper system for creating surveys and analysing on
them. The food and hospitality outlets cannot determine the customer satisfaction based on the sales
or the productivity of the services offered. This creates an abyss between the supplier and the
current demands of the consumer and also leaves the organisation clueless about the factors for
making diverse and efficient strategy for the business in this sector.
Available Data Sources
Since the organisation manages business in the customer and consumer domains, there are lot of
sources for data that can be collected and then analysed for creating business strategies and
decisions to improve the consumer satisfaction as well as the business growth and reputation. The
available data sources for the organisation are as follows:
1. Supermarket sales: The database from the different supermarket chains under the organisation
can individually create huge datasets for data analytics. Each product that is offered in the
supermarket can be categorized on different factors to determine the demand and supply
requirements. The products available in the supermarkets and the stock data can be collected to
create real-time sales insights that is authentic and generated at the root source. The shopping trends
can be analysed in these data sources to present a comprehensive report for products and the need of
the consumers for any particular product. Based on the sale insights, the products can be analysed or
designed in such as way that the business can make strategies such as discounts and customized
sales for engaging more customers and business growth.
2. Merchandise sales: The business can collect data from the social media and other platforms to
create an insight of what merchandise is currently in demand and trend. This can later be
implemented to stock the merchandise outlets with the current product demand. The watch on
current merchandise and trend in the entertainment world can help boost up the merchandise sales
more.
Paraphrase This Document
Need a fresh take? Get an instant paraphrase of this document with our AI Paraphraser
3. Customer preferences: The sales and report comparison of different supermarkets and outlets can
help determine the customer preference for choosing the particular outlet which can then be
upgraded with more facilities and stock to boost the business sales and growth. The registered
customer data and their billings from the supermarkets can be analysed to create this data insights of
consumers of which region choose which particular shopping centre for purchase.
4. Sales of the products: The organisation can collect data from the outlets and retails on each or a
category of a product to gain the sale insight of that particular product. The sale data of a particular
product can be harnessed to create more easy and beneficiary product design and sales model.
5. Proportion of the services offered in different sectors: The services and products offered in the
hospitality sector can be used as a data source for data analysis. The services such as hotel chains
and pubs can create data which can be then analysed for the future requirements and enhancements.
6. Retail shopping: The retail outlet sales and product customization data can be used as the data
source for making efficient business decisions for the end user personalization directly. It can be
used to improve the stock and supply demand.
Analytic Techniques
There are a lot of data analysis and analytic techniques to provide a better efficiency and decision
making criteria. Woolworths data can be analysed by the following techniques(Chol, T.M. & Wang,
Y. 2018) that are suited aptly.
Association rule learning:
This technique can be used to determine the chances of products to be purchased together. It helps
analyse the data to create trends that discover the interest correlation between the products. With the
help of this insight, the products can be placed nearby to increase sales. It uses the if then statements
to give outputs. When the analysis is to be done on non numerical variables, the association rule is
the best suited technique. It can observe frequency patterns, correlation and the association between
the different variables present in the collected dataset. It gives support and confidence for making
business decisions.
Classification tree analysis:
This technique involves the data analysis on the historical data to provide discover the trends in
categorization of the products and services. With this help, the services and products can be linked
together to create combos that may attract more customers. The decision trees help in making the
classification or classifiers which help in nominal variable response such as classifying a product as
high demand in future or less sales.
Genetic algorithms:
The genetic algorithms can be used to analyse the data to create the strategies such as the factors
that work on the evolution process. For example, the liquor section can be separated in the
supermarket from the family and children section. It targets the behaviour of the customer and other
human entities involved in the business operation and how likely are they to make decisions that
would affect the business operations directly or indirectly.
Machine Learning:
Machine learning can be applied on the datasets to provide more efficient data-drive business
strategies. It involves machine learning application and software that learns from the data and make
predictions based on that data. Examples of the learning methods are supervised learning, deep
learning, unsupervised learning, and reinforcement learning. The machine learning algorithm can
help in making the outcomes of the data analysis more robust and productive. One such algorithm is
the Logistic Regression that takes input variables and output variables and predict the binary
outcomes of the data whether that event will occur or not.
⊘ This is a preview!⊘
Do you want full access?
Subscribe today to unlock all pages.
Trusted by 1+ million students worldwide
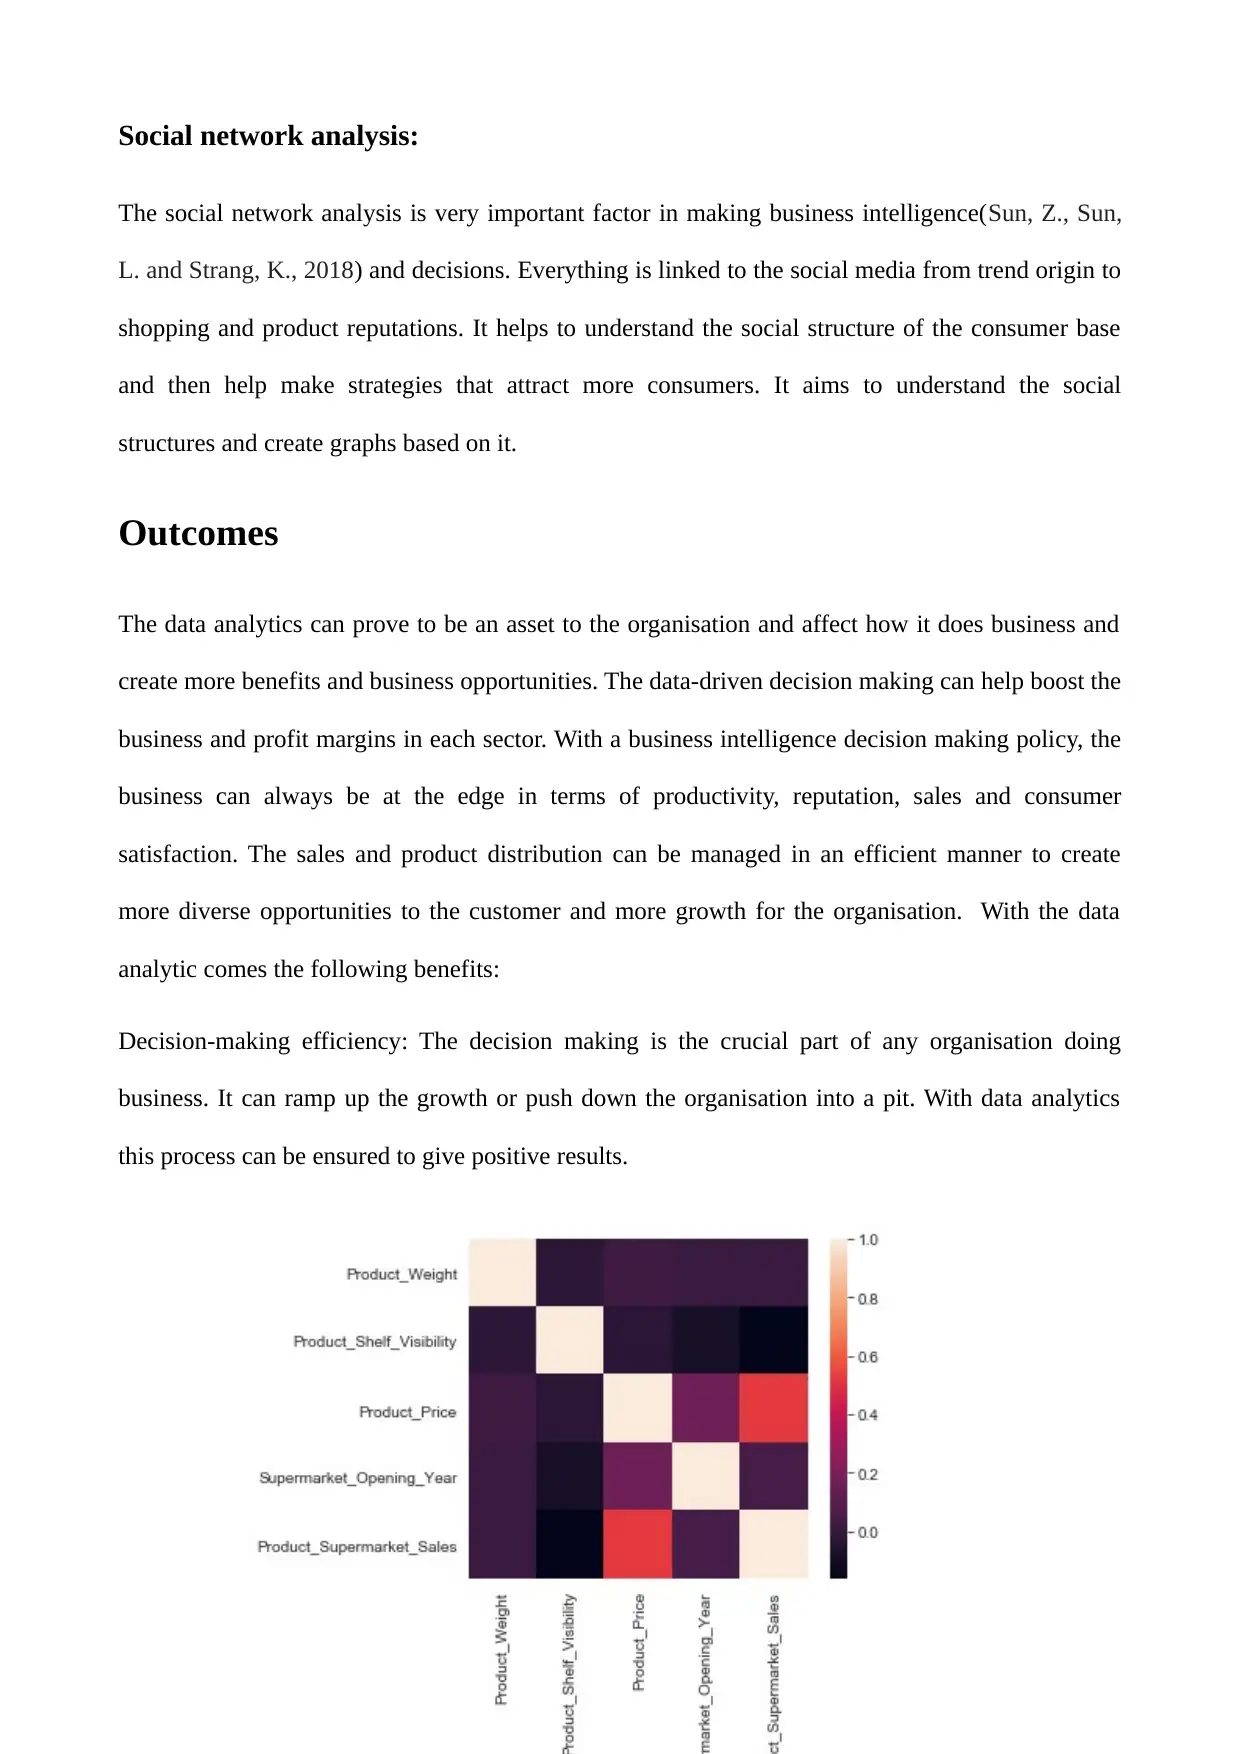
Social network analysis:
The social network analysis is very important factor in making business intelligence(Sun, Z., Sun,
L. and Strang, K., 2018) and decisions. Everything is linked to the social media from trend origin to
shopping and product reputations. It helps to understand the social structure of the consumer base
and then help make strategies that attract more consumers. It aims to understand the social
structures and create graphs based on it.
Outcomes
The data analytics can prove to be an asset to the organisation and affect how it does business and
create more benefits and business opportunities. The data-driven decision making can help boost the
business and profit margins in each sector. With a business intelligence decision making policy, the
business can always be at the edge in terms of productivity, reputation, sales and consumer
satisfaction. The sales and product distribution can be managed in an efficient manner to create
more diverse opportunities to the customer and more growth for the organisation. With the data
analytic comes the following benefits:
Decision-making efficiency: The decision making is the crucial part of any organisation doing
business. It can ramp up the growth or push down the organisation into a pit. With data analytics
this process can be ensured to give positive results.
Paraphrase This Document
Need a fresh take? Get an instant paraphrase of this document with our AI Paraphraser
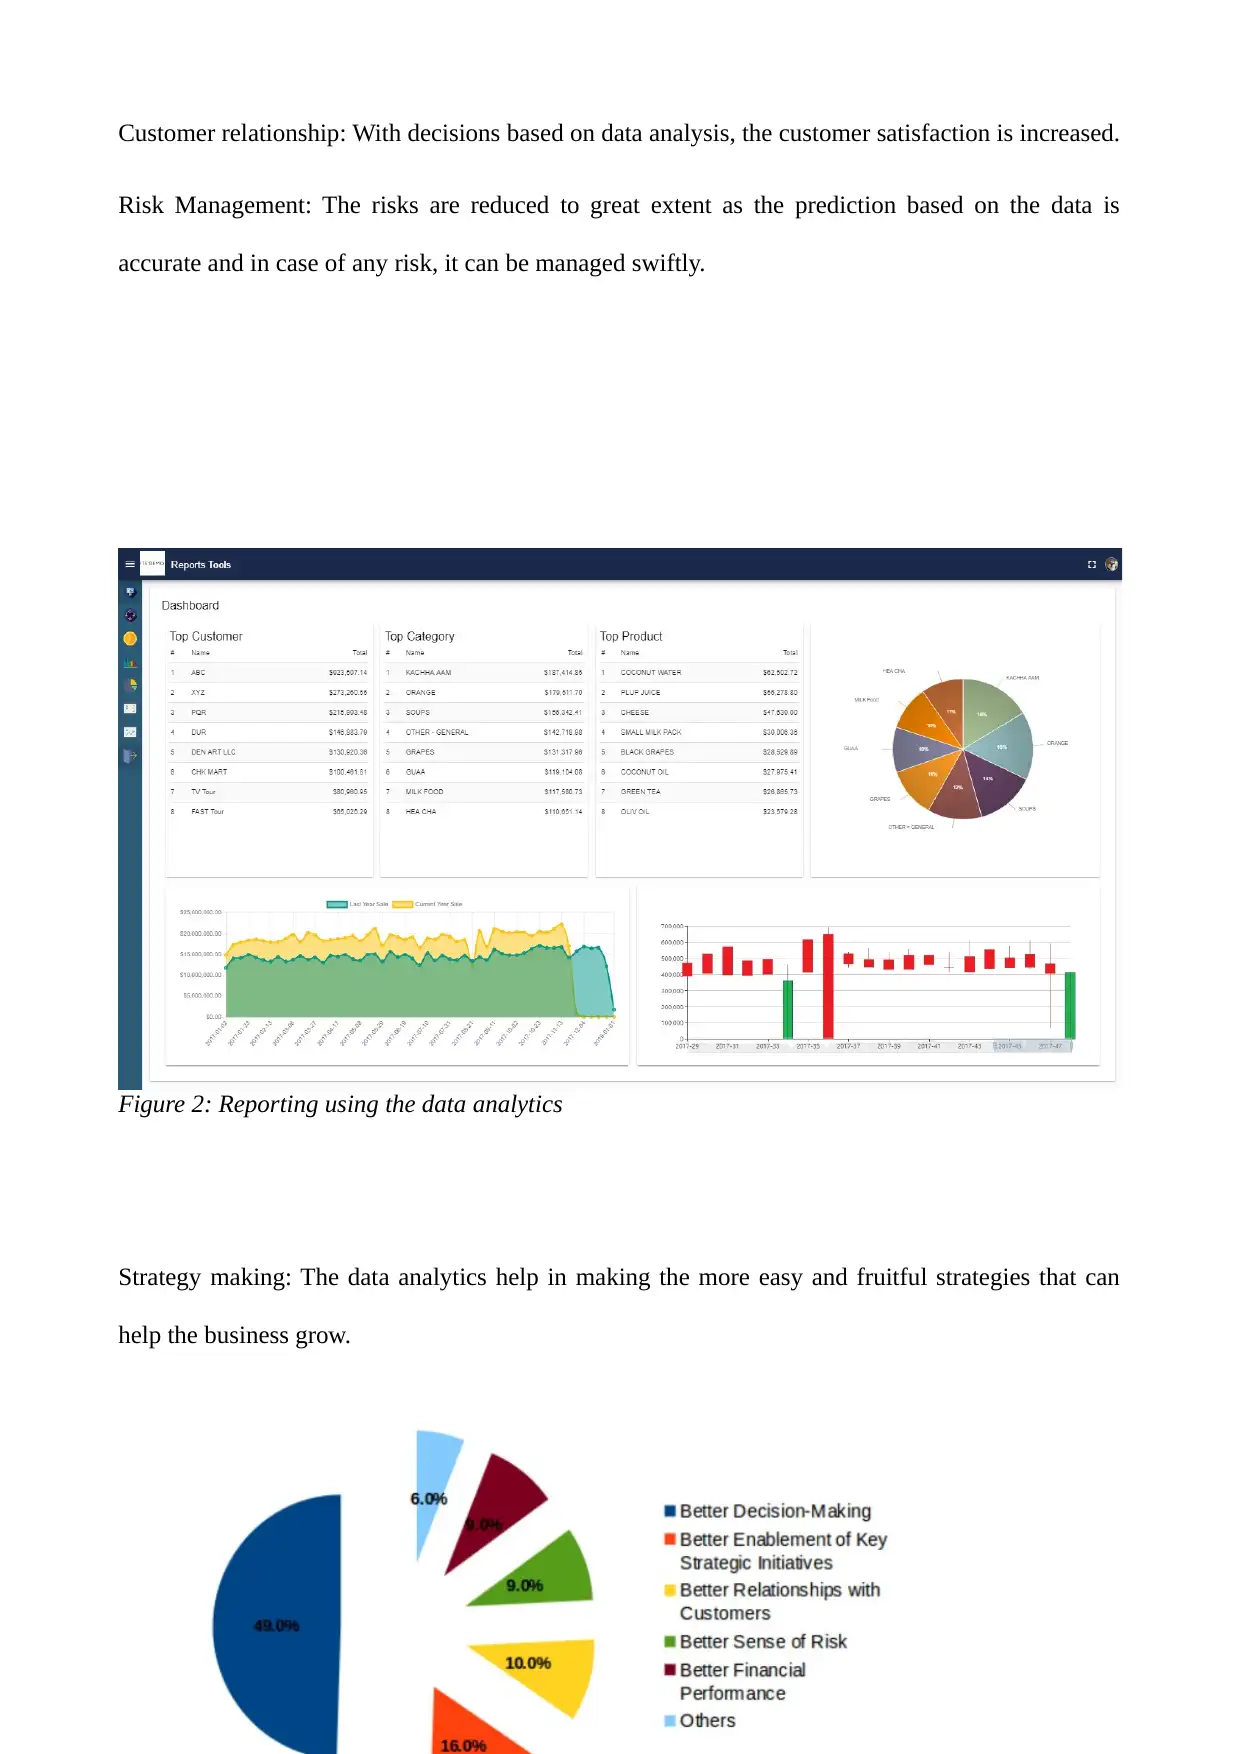
Customer relationship: With decisions based on data analysis, the customer satisfaction is increased.
Risk Management: The risks are reduced to great extent as the prediction based on the data is
accurate and in case of any risk, it can be managed swiftly.
Strategy making: The data analytics help in making the more easy and fruitful strategies that can
help the business grow.
Figure 2: Reporting using the data analytics
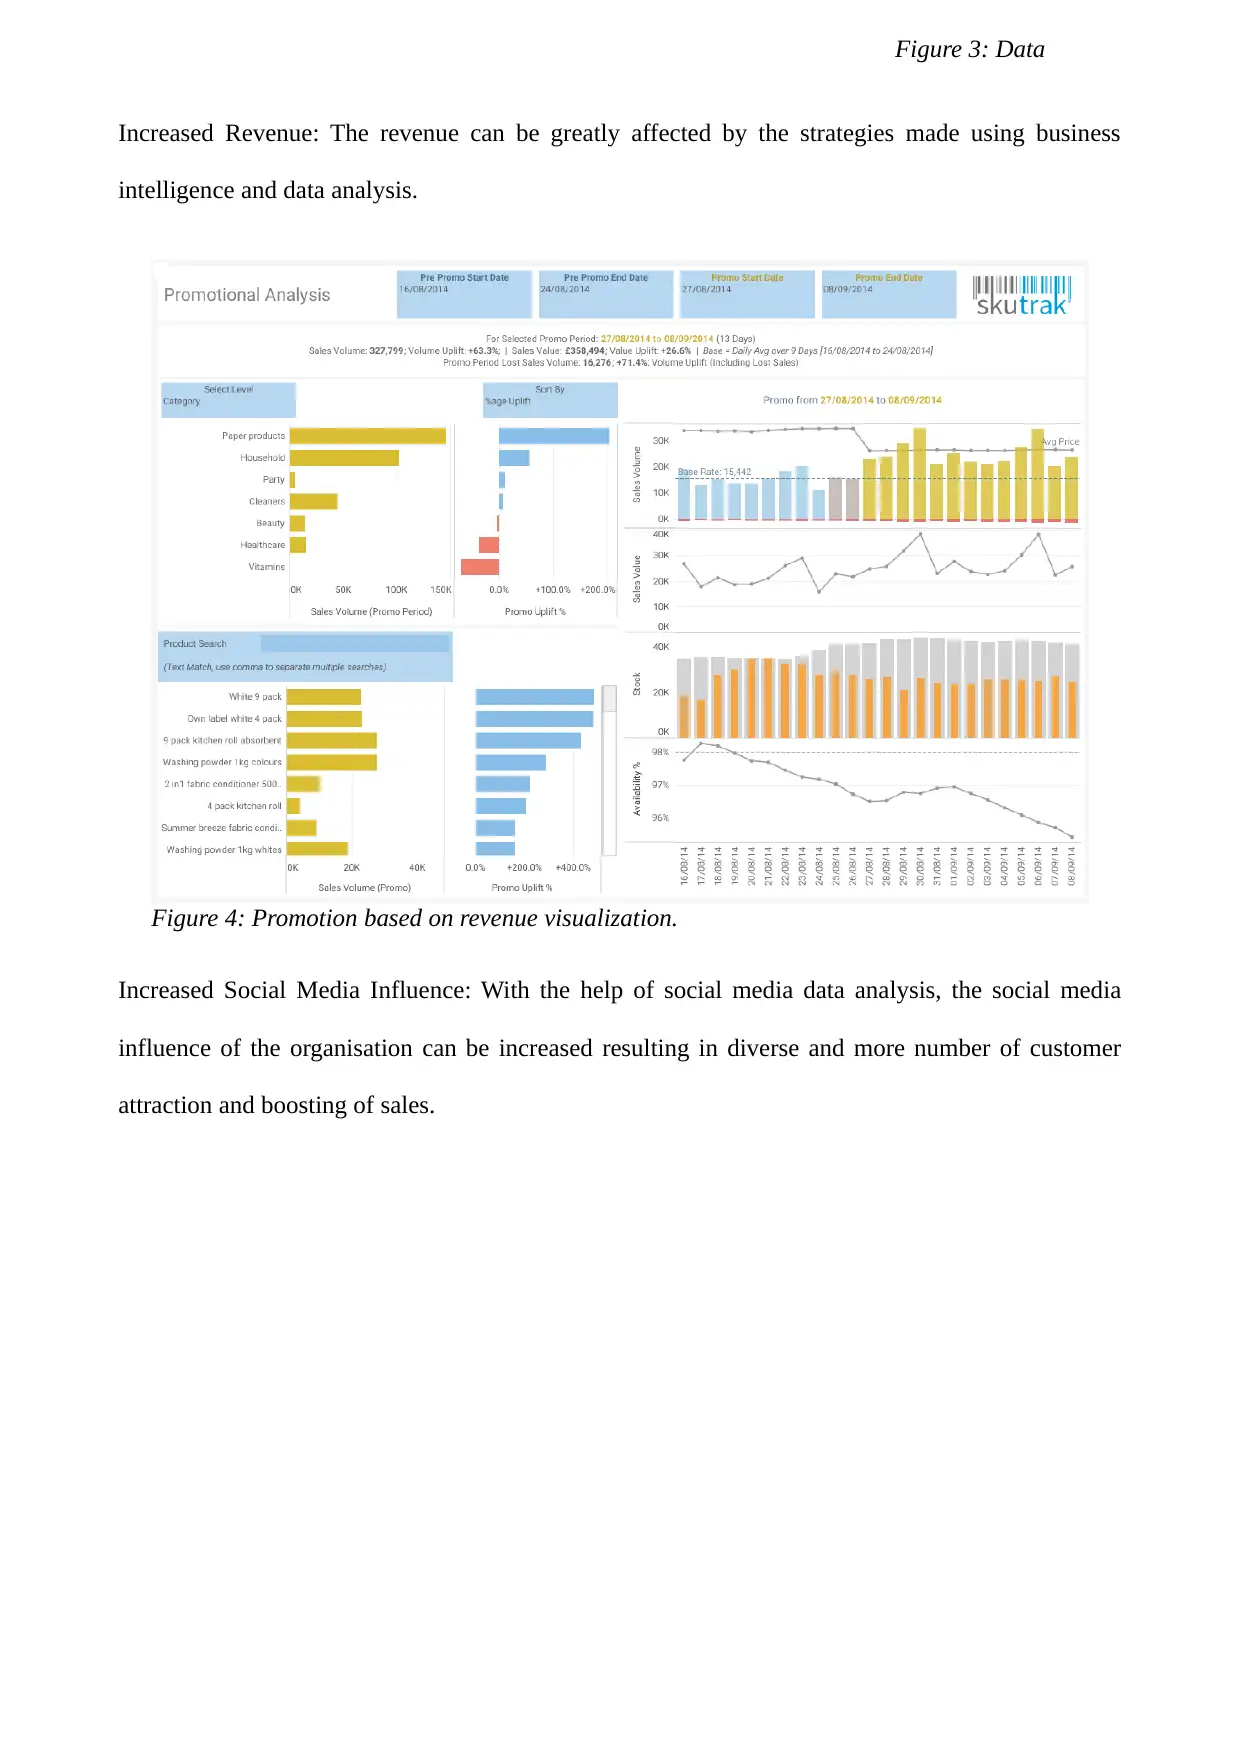
Increased Revenue: The revenue can be greatly affected by the strategies made using business
intelligence and data analysis.
Increased Social Media Influence: With the help of social media data analysis, the social media
influence of the organisation can be increased resulting in diverse and more number of customer
attraction and boosting of sales.
Figure 3: Data
Figure 4: Promotion based on revenue visualization.
⊘ This is a preview!⊘
Do you want full access?
Subscribe today to unlock all pages.
Trusted by 1+ million students worldwide
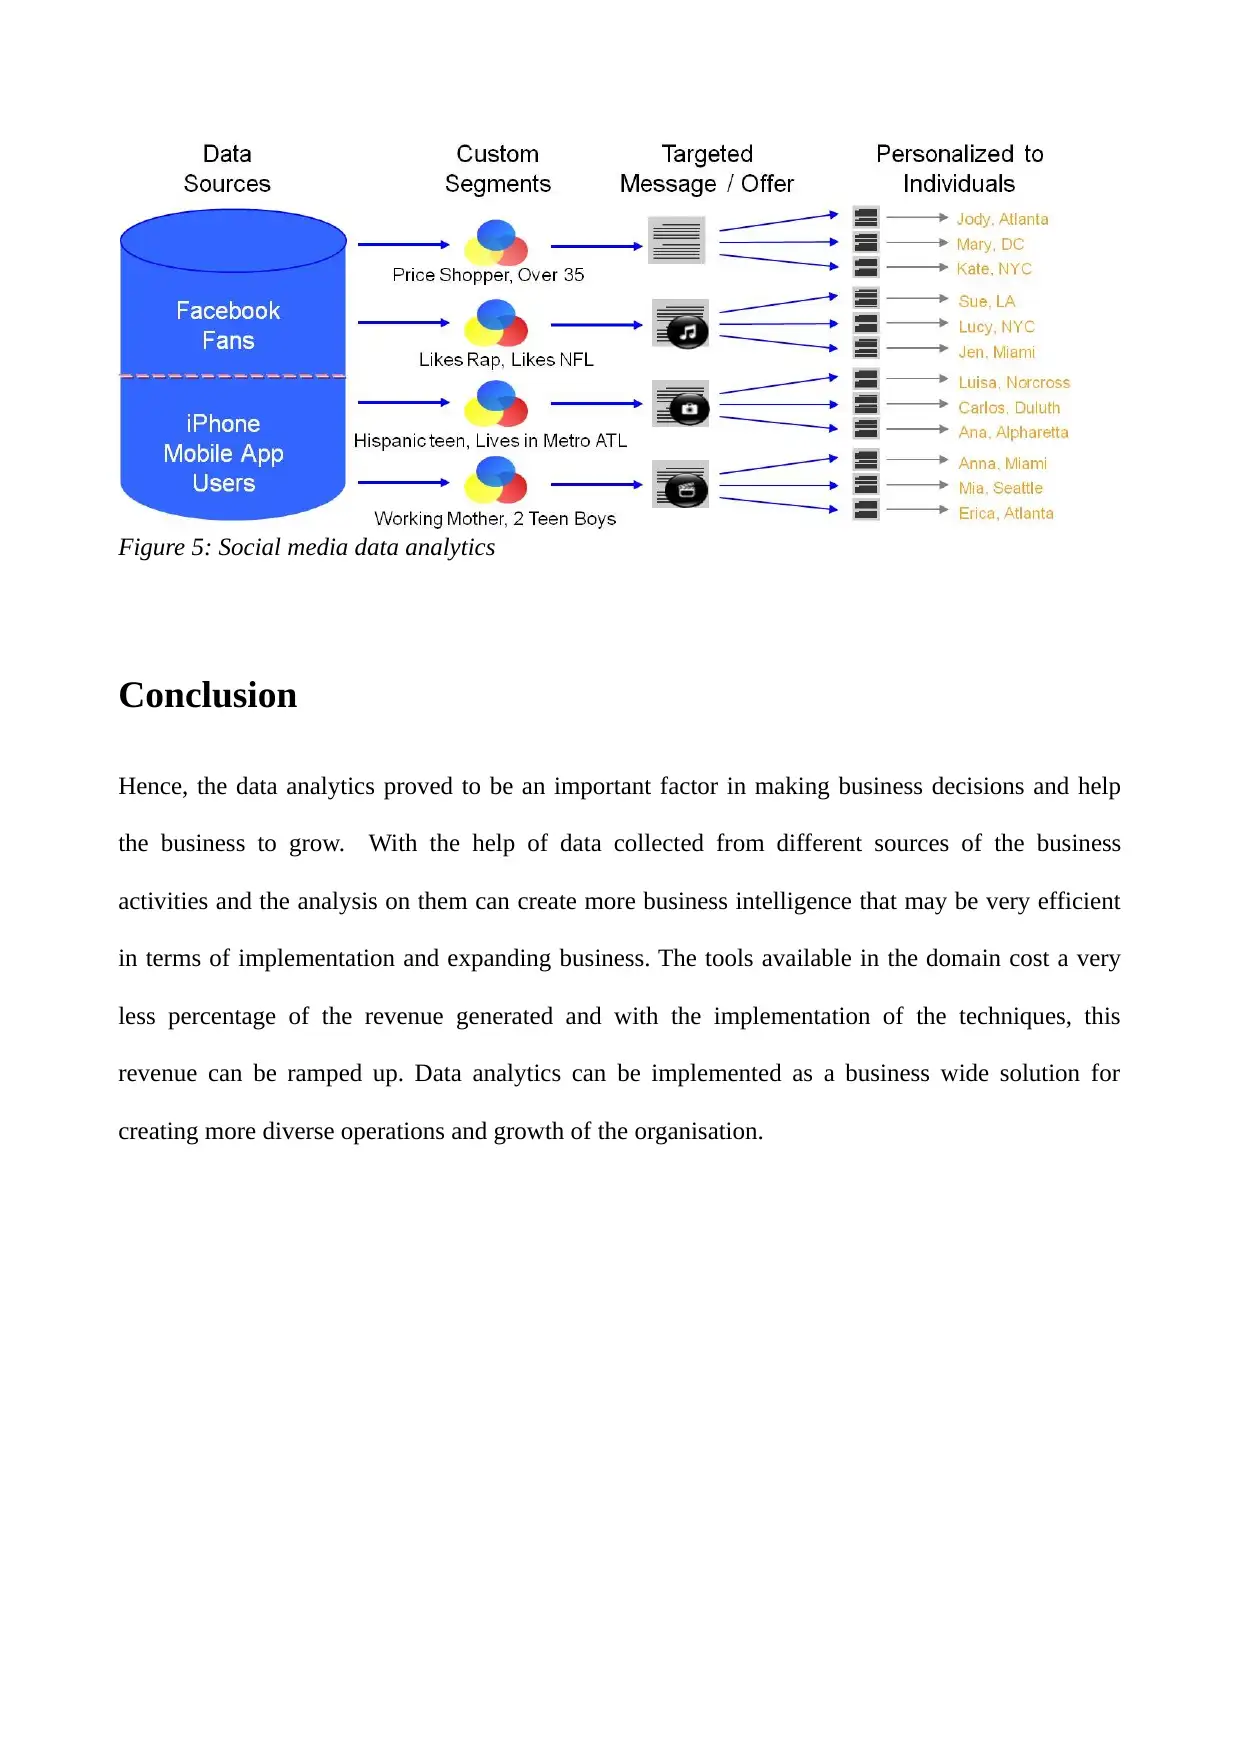
Conclusion
Hence, the data analytics proved to be an important factor in making business decisions and help
the business to grow. With the help of data collected from different sources of the business
activities and the analysis on them can create more business intelligence that may be very efficient
in terms of implementation and expanding business. The tools available in the domain cost a very
less percentage of the revenue generated and with the implementation of the techniques, this
revenue can be ramped up. Data analytics can be implemented as a business wide solution for
creating more diverse operations and growth of the organisation.
Figure 5: Social media data analytics
Paraphrase This Document
Need a fresh take? Get an instant paraphrase of this document with our AI Paraphraser
References:
Grover, V., Chiang, R.H., Liang, T.P. and Zhang, D., 2018. Creating strategic business value from
big data analytics: A research framework. Journal of Management Information Systems, 35(2),
pp.388-423.
Sun, Z., Sun, L. and Strang, K., 2018. Big data analytics services for enhancing business
intelligence. Journal of Computer Information Systems, 58(2), pp.162-169.
Woolworths. 2019. Annual Report. [online], Available at:
https://www.woolworthsgroup.com.au/icms_docs/195582_annual-report-2019.pdf [Accessed on:
September 19th, 2020]
Woolworths group. 2020. Woolworths groip 2020 commitments [online], Available at:
http://crs.woolworthsgroup.com.au/ [Accessed on: September 19th, 2020]
Woolworths Group. 2016. Industry Standards. [online], Available at:
http://wowlinklogin.woolworths.com.au/cmgt/wcm/connect/f1b91f004914615ab7d2fffc2362699a/
Industry+Standard+for+Service+Providers.pdf?MOD=AJPERES [Accessed on: September 19th,
2020]
1 out of 11
Related Documents


Your All-in-One AI-Powered Toolkit for Academic Success.
+13062052269
info@desklib.com
Available 24*7 on WhatsApp / Email
![[object Object]](/_next/static/media/star-bottom.7253800d.svg)
Unlock your academic potential
Copyright © 2020–2026 A2Z Services. All Rights Reserved. Developed and managed by ZUCOL.