Corporate Accounting and Financial Statement Analysis of Woolworths
VerifiedAdded on 2021/05/31
|16
|3686
|74
Report
AI Summary
This report presents a comprehensive financial statement analysis of Woolworths, an Australian retail company. It delves into various aspects of the company's financial performance, including a detailed examination of its cash flow statement, comparative analysis of cash flow categories, and an assessment of items reported in the comprehensive income statement. The analysis covers the changes in cash flow items, comparative trends across different years, and explanations of items recorded in other comprehensive income. The report also addresses the reasons why certain items are not shown in the statement of profit and loss, along with an in-depth look at tax expenses, deferred tax assets/liabilities, and the differences between tax expense and actual tax payments. The analysis is based on the company's annual reports and incorporates the implications of International Financial Reporting Standards (IFRS).
WOOlworths Company
Corporate Accounting
Financial Statement Analysis
Name of Author
Corporate Accounting
Financial Statement Analysis
Name of Author
Paraphrase This Document
Need a fresh take? Get an instant paraphrase of this document with our AI Paraphraser
Table of Contents
INTRODUCTION......................................................................................................................1
ANSWER TO QUESTION NO- (i)...........................................................................................1
CHANGES IN ITEMS OF CASH FLOW STATEMENT........................................................1
ANSWER TO QUESTION NO- (ii)..........................................................................................1
COMPARATIVE ANALYSIS OF THREE BROAD CATEGORIES OF CASH FLOW
STATEMENT............................................................................................................................1
ANSWER TO QUESTION NO- (iii)........................................................................................2
ITEMS REPORTED IN COMPREHENSIVE INCOME STATEMENT.................................2
ANSWER TO QUESTION NO- (iv).........................................................................................2
EXPLAINATION OF ITEMS RECORDED IN OTHER COMPREHENSIVE INCOME
STATEMENT............................................................................................................................2
ANSWER TO QUESTION NO- (v)..........................................................................................3
WHY OTHER COMPREHENSIVE INCOME IS NOT SHOWN IN STATEMENT OF
PROFIT AND LOSS?................................................................................................................3
ANSWER TO QUESTION NO- (vi).........................................................................................3
TAX EXPENSE IN THE LATEST FINANCIAL STATEMENTS..........................................3
ANSWER TO QUESTION NO- (vii)........................................................................................3
IS THE TAX EXPENSE EQUAL TO THE TAX RATE MULTIPLIED BY ACCOUNTING
INCOME?..................................................................................................................................3
ANSWER TO QUESTION NO- (viii)......................................................................................3
DEFERRED TAX ASSET/LIABILTY RECORDED IN BALANCE SHEET........................3
ANSWER TO QUESTION NO- (ix).........................................................................................4

ANSWER TO QUESTION NO- (x)..........................................................................................4
ANSWER TO QUESTION NO- (xi).........................................................................................4
INTERESTING..........................................................................................................................4
CONFUSING.............................................................................................................................4
DIFFICULT...............................................................................................................................4
⊘ This is a preview!⊘
Do you want full access?
Subscribe today to unlock all pages.
Trusted by 1+ million students worldwide
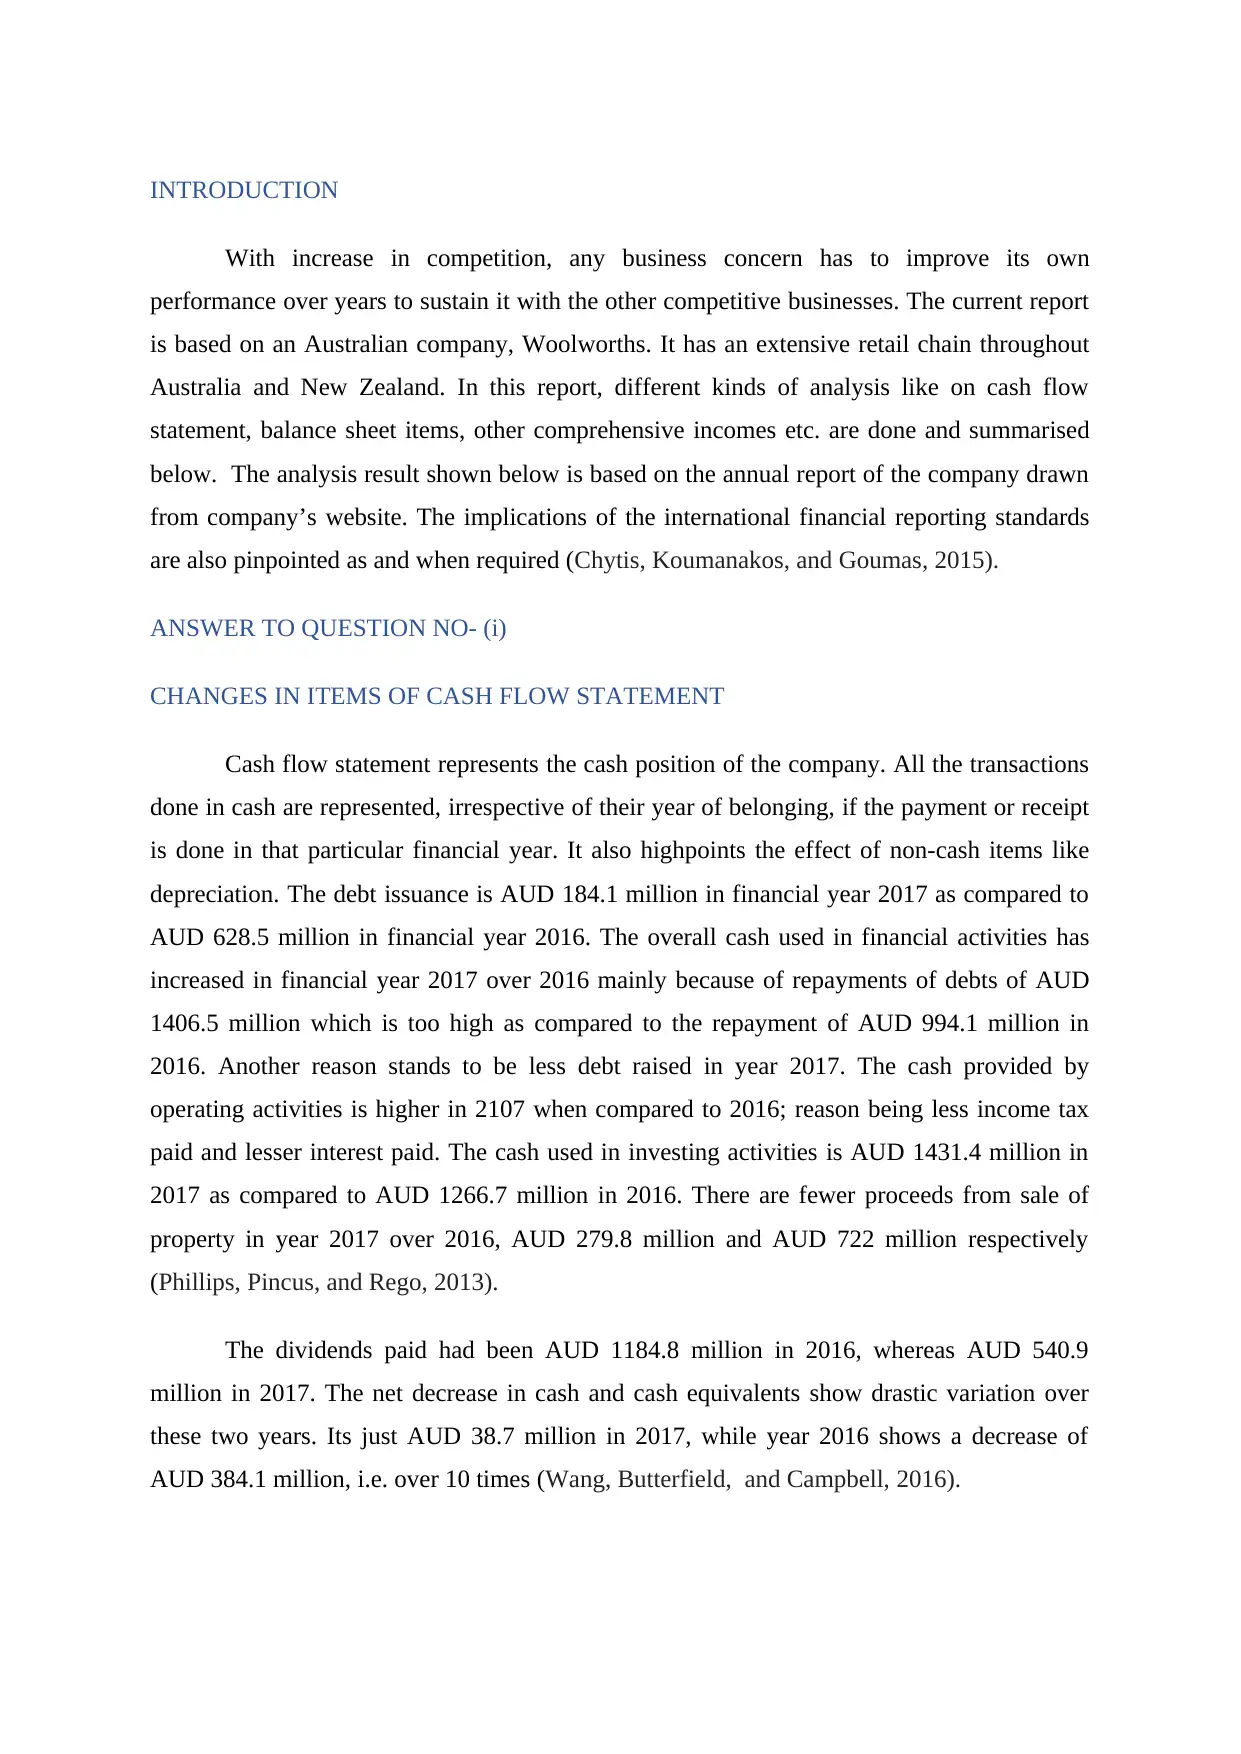
INTRODUCTION
With increase in competition, any business concern has to improve its own
performance over years to sustain it with the other competitive businesses. The current report
is based on an Australian company, Woolworths. It has an extensive retail chain throughout
Australia and New Zealand. In this report, different kinds of analysis like on cash flow
statement, balance sheet items, other comprehensive incomes etc. are done and summarised
below. The analysis result shown below is based on the annual report of the company drawn
from company’s website. The implications of the international financial reporting standards
are also pinpointed as and when required (Chytis, Koumanakos, and Goumas, 2015).
ANSWER TO QUESTION NO- (i)
CHANGES IN ITEMS OF CASH FLOW STATEMENT
Cash flow statement represents the cash position of the company. All the transactions
done in cash are represented, irrespective of their year of belonging, if the payment or receipt
is done in that particular financial year. It also highpoints the effect of non-cash items like
depreciation. The debt issuance is AUD 184.1 million in financial year 2017 as compared to
AUD 628.5 million in financial year 2016. The overall cash used in financial activities has
increased in financial year 2017 over 2016 mainly because of repayments of debts of AUD
1406.5 million which is too high as compared to the repayment of AUD 994.1 million in
2016. Another reason stands to be less debt raised in year 2017. The cash provided by
operating activities is higher in 2107 when compared to 2016; reason being less income tax
paid and lesser interest paid. The cash used in investing activities is AUD 1431.4 million in
2017 as compared to AUD 1266.7 million in 2016. There are fewer proceeds from sale of
property in year 2017 over 2016, AUD 279.8 million and AUD 722 million respectively
(Phillips, Pincus, and Rego, 2013).
The dividends paid had been AUD 1184.8 million in 2016, whereas AUD 540.9
million in 2017. The net decrease in cash and cash equivalents show drastic variation over
these two years. Its just AUD 38.7 million in 2017, while year 2016 shows a decrease of
AUD 384.1 million, i.e. over 10 times (Wang, Butterfield, and Campbell, 2016).
Paraphrase This Document
Need a fresh take? Get an instant paraphrase of this document with our AI Paraphraser
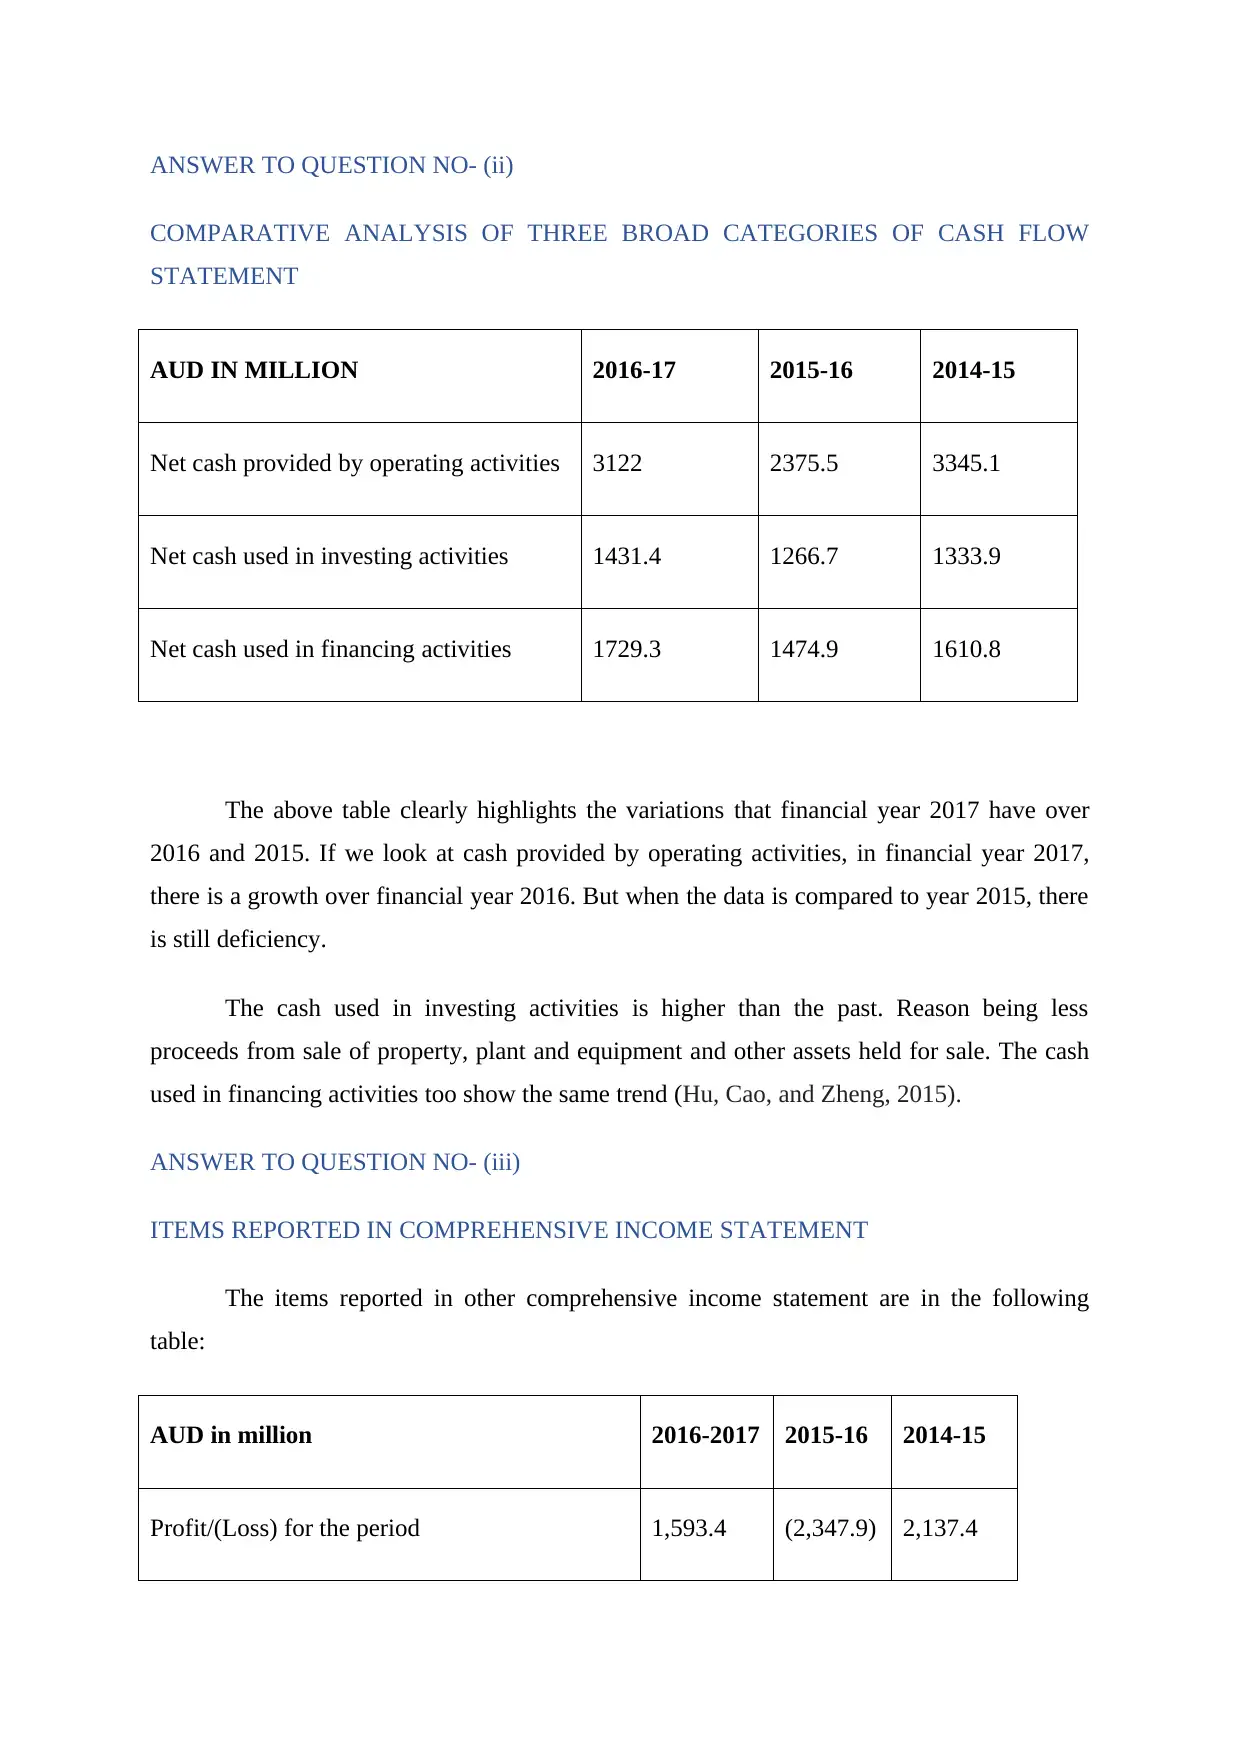
ANSWER TO QUESTION NO- (ii)
COMPARATIVE ANALYSIS OF THREE BROAD CATEGORIES OF CASH FLOW
STATEMENT
AUD IN MILLION 2016-17 2015-16 2014-15
Net cash provided by operating activities 3122 2375.5 3345.1
Net cash used in investing activities 1431.4 1266.7 1333.9
Net cash used in financing activities 1729.3 1474.9 1610.8
The above table clearly highlights the variations that financial year 2017 have over
2016 and 2015. If we look at cash provided by operating activities, in financial year 2017,
there is a growth over financial year 2016. But when the data is compared to year 2015, there
is still deficiency.
The cash used in investing activities is higher than the past. Reason being less
proceeds from sale of property, plant and equipment and other assets held for sale. The cash
used in financing activities too show the same trend (Hu, Cao, and Zheng, 2015).
ANSWER TO QUESTION NO- (iii)
ITEMS REPORTED IN COMPREHENSIVE INCOME STATEMENT
The items reported in other comprehensive income statement are in the following
table:
AUD in million 2016-2017 2015-16 2014-15
Profit/(Loss) for the period 1,593.4 (2,347.9) 2,137.4
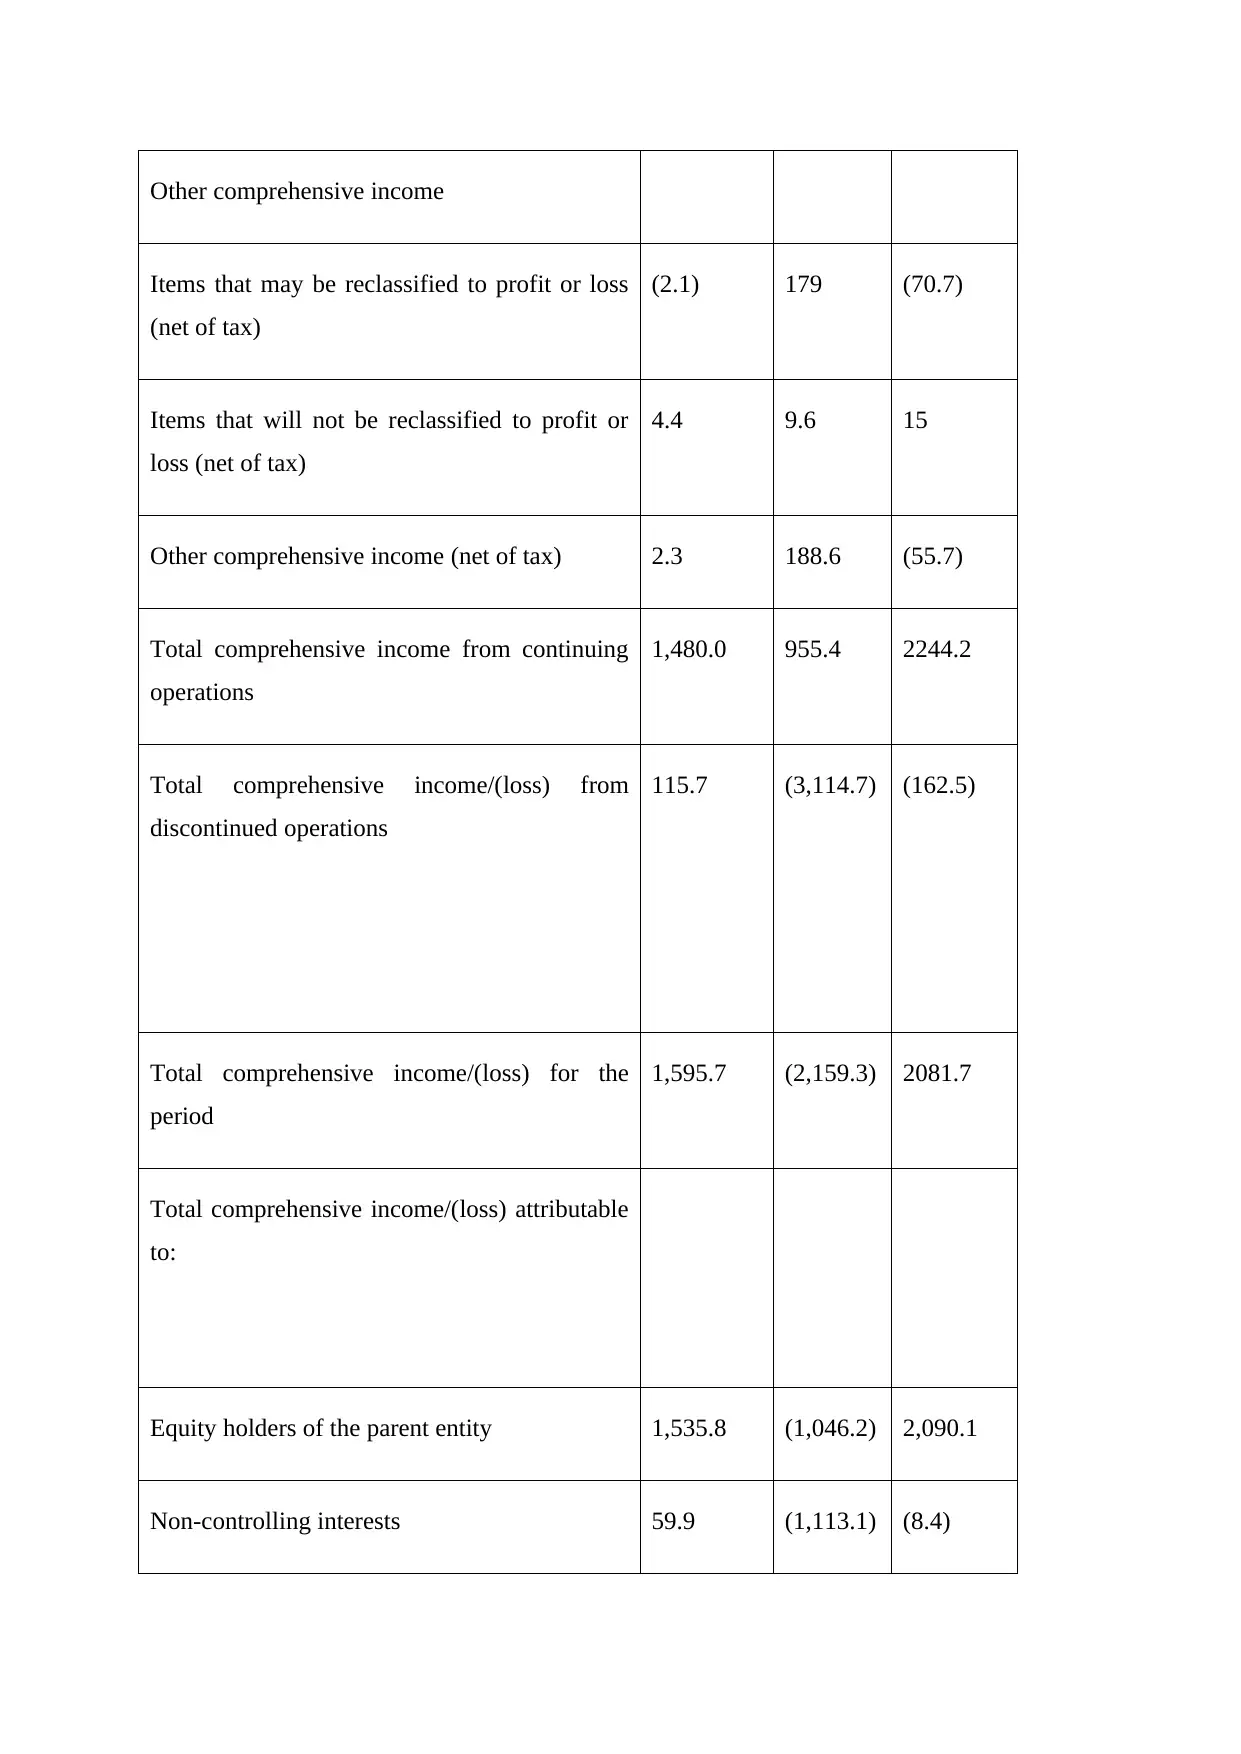
Other comprehensive income
Items that may be reclassified to profit or loss
(net of tax)
(2.1) 179 (70.7)
Items that will not be reclassified to profit or
loss (net of tax)
4.4 9.6 15
Other comprehensive income (net of tax) 2.3 188.6 (55.7)
Total comprehensive income from continuing
operations
1,480.0 955.4 2244.2
Total comprehensive income/(loss) from
discontinued operations
115.7 (3,114.7) (162.5)
Total comprehensive income/(loss) for the
period
1,595.7 (2,159.3) 2081.7
Total comprehensive income/(loss) attributable
to:
Equity holders of the parent entity 1,535.8 (1,046.2) 2,090.1
Non-controlling interests 59.9 (1,113.1) (8.4)
⊘ This is a preview!⊘
Do you want full access?
Subscribe today to unlock all pages.
Trusted by 1+ million students worldwide
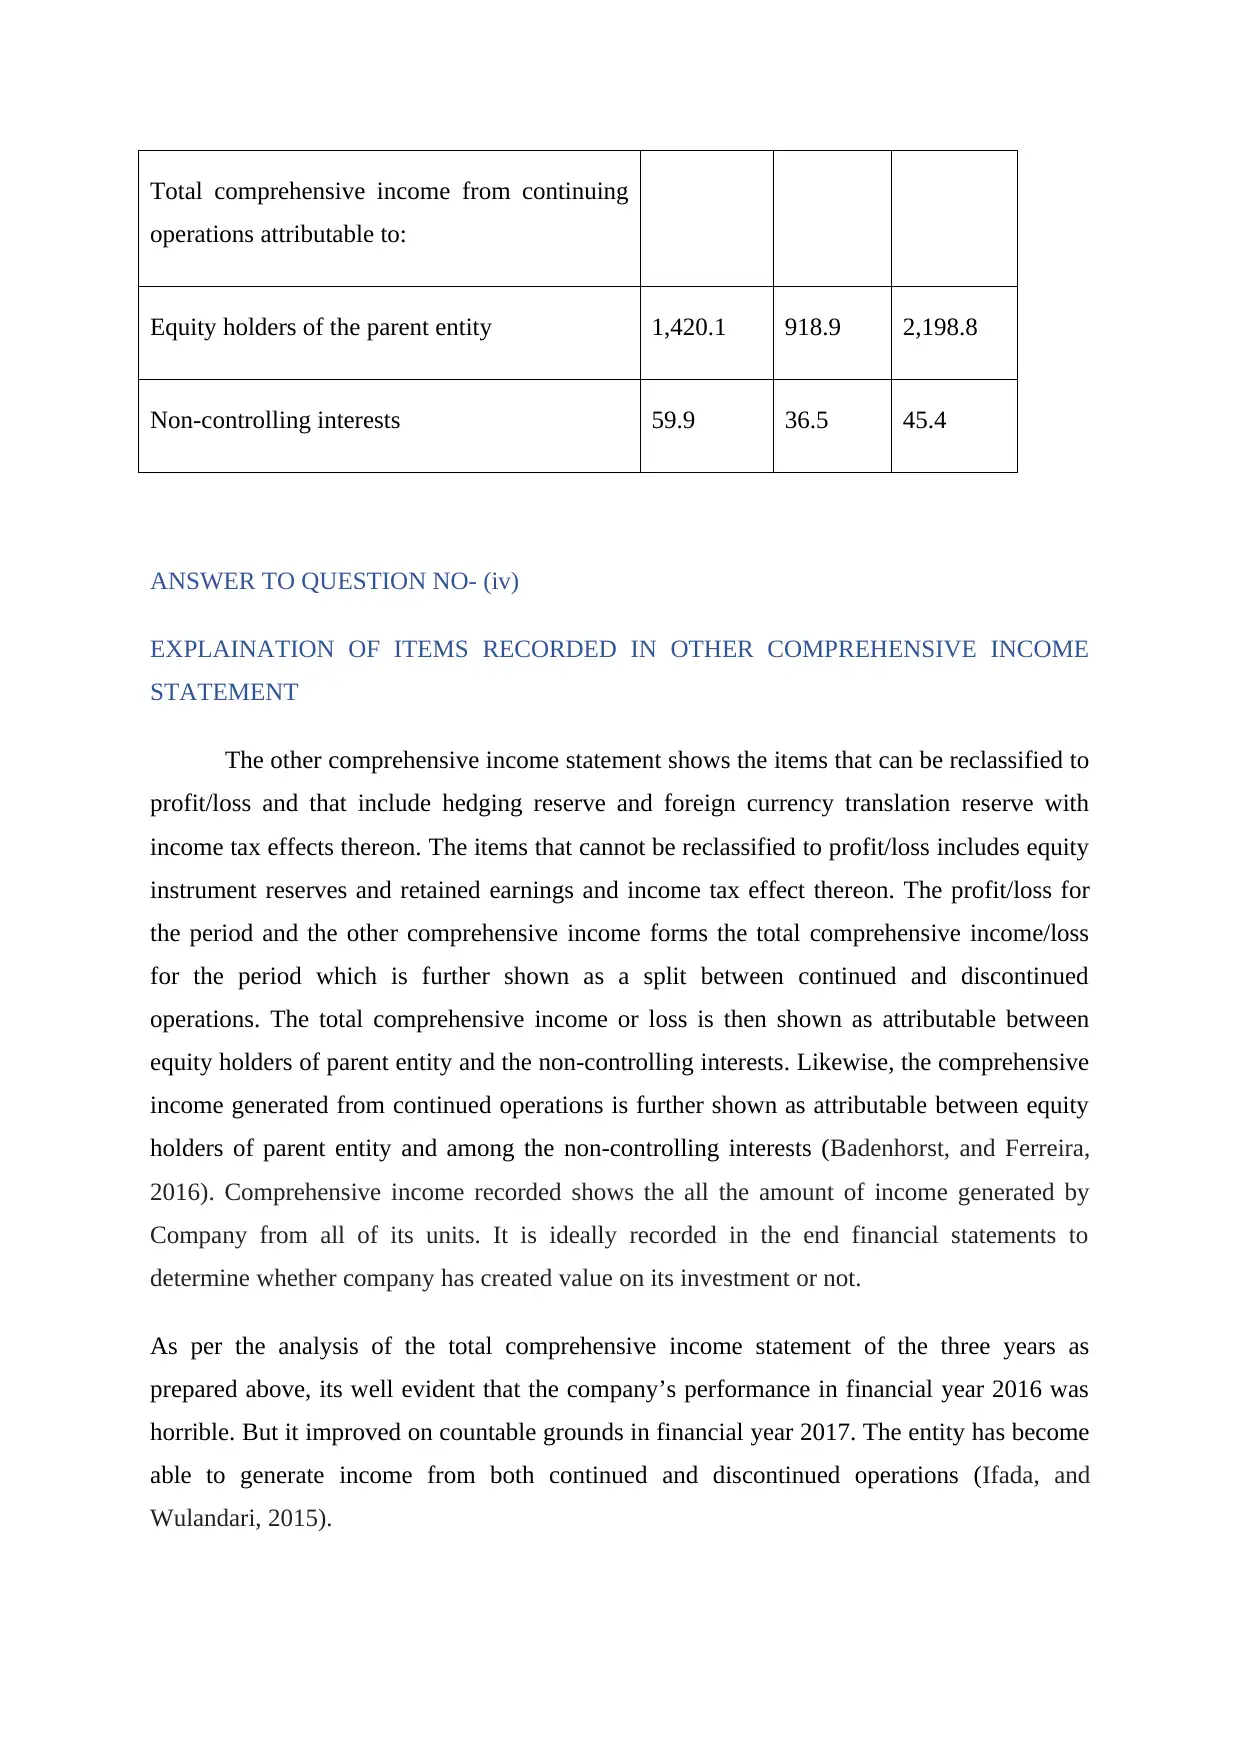
Total comprehensive income from continuing
operations attributable to:
Equity holders of the parent entity 1,420.1 918.9 2,198.8
Non-controlling interests 59.9 36.5 45.4
ANSWER TO QUESTION NO- (iv)
EXPLAINATION OF ITEMS RECORDED IN OTHER COMPREHENSIVE INCOME
STATEMENT
The other comprehensive income statement shows the items that can be reclassified to
profit/loss and that include hedging reserve and foreign currency translation reserve with
income tax effects thereon. The items that cannot be reclassified to profit/loss includes equity
instrument reserves and retained earnings and income tax effect thereon. The profit/loss for
the period and the other comprehensive income forms the total comprehensive income/loss
for the period which is further shown as a split between continued and discontinued
operations. The total comprehensive income or loss is then shown as attributable between
equity holders of parent entity and the non-controlling interests. Likewise, the comprehensive
income generated from continued operations is further shown as attributable between equity
holders of parent entity and among the non-controlling interests (Badenhorst, and Ferreira,
2016). Comprehensive income recorded shows the all the amount of income generated by
Company from all of its units. It is ideally recorded in the end financial statements to
determine whether company has created value on its investment or not.
As per the analysis of the total comprehensive income statement of the three years as
prepared above, its well evident that the company’s performance in financial year 2016 was
horrible. But it improved on countable grounds in financial year 2017. The entity has become
able to generate income from both continued and discontinued operations (Ifada, and
Wulandari, 2015).
Paraphrase This Document
Need a fresh take? Get an instant paraphrase of this document with our AI Paraphraser
ANSWER TO QUESTION NO- (v)
WHY OTHER COMPREHENSIVE INCOME IS NOT SHOWN IN STATEMENT OF
PROFIT AND LOSS?
As per the latest International Financial Reporting Standards (IFRS), the presentation
of profit and loss statements required that either one statement that will be a combined
statement of profit and loss and other comprehensive income, or two separate statements
made individually being statement of profit and loss and statement of other comprehensive
income shall be made by an entity. In the statement of other comprehensive income, the
entity is bound to show the items that can be reclassified into profit/loss and those that cannot
be reclassified. This statement contains all the items that are not allowed or that aren’t
permitted to be shown in profit/loss statement (Cazier, et al. 2015).
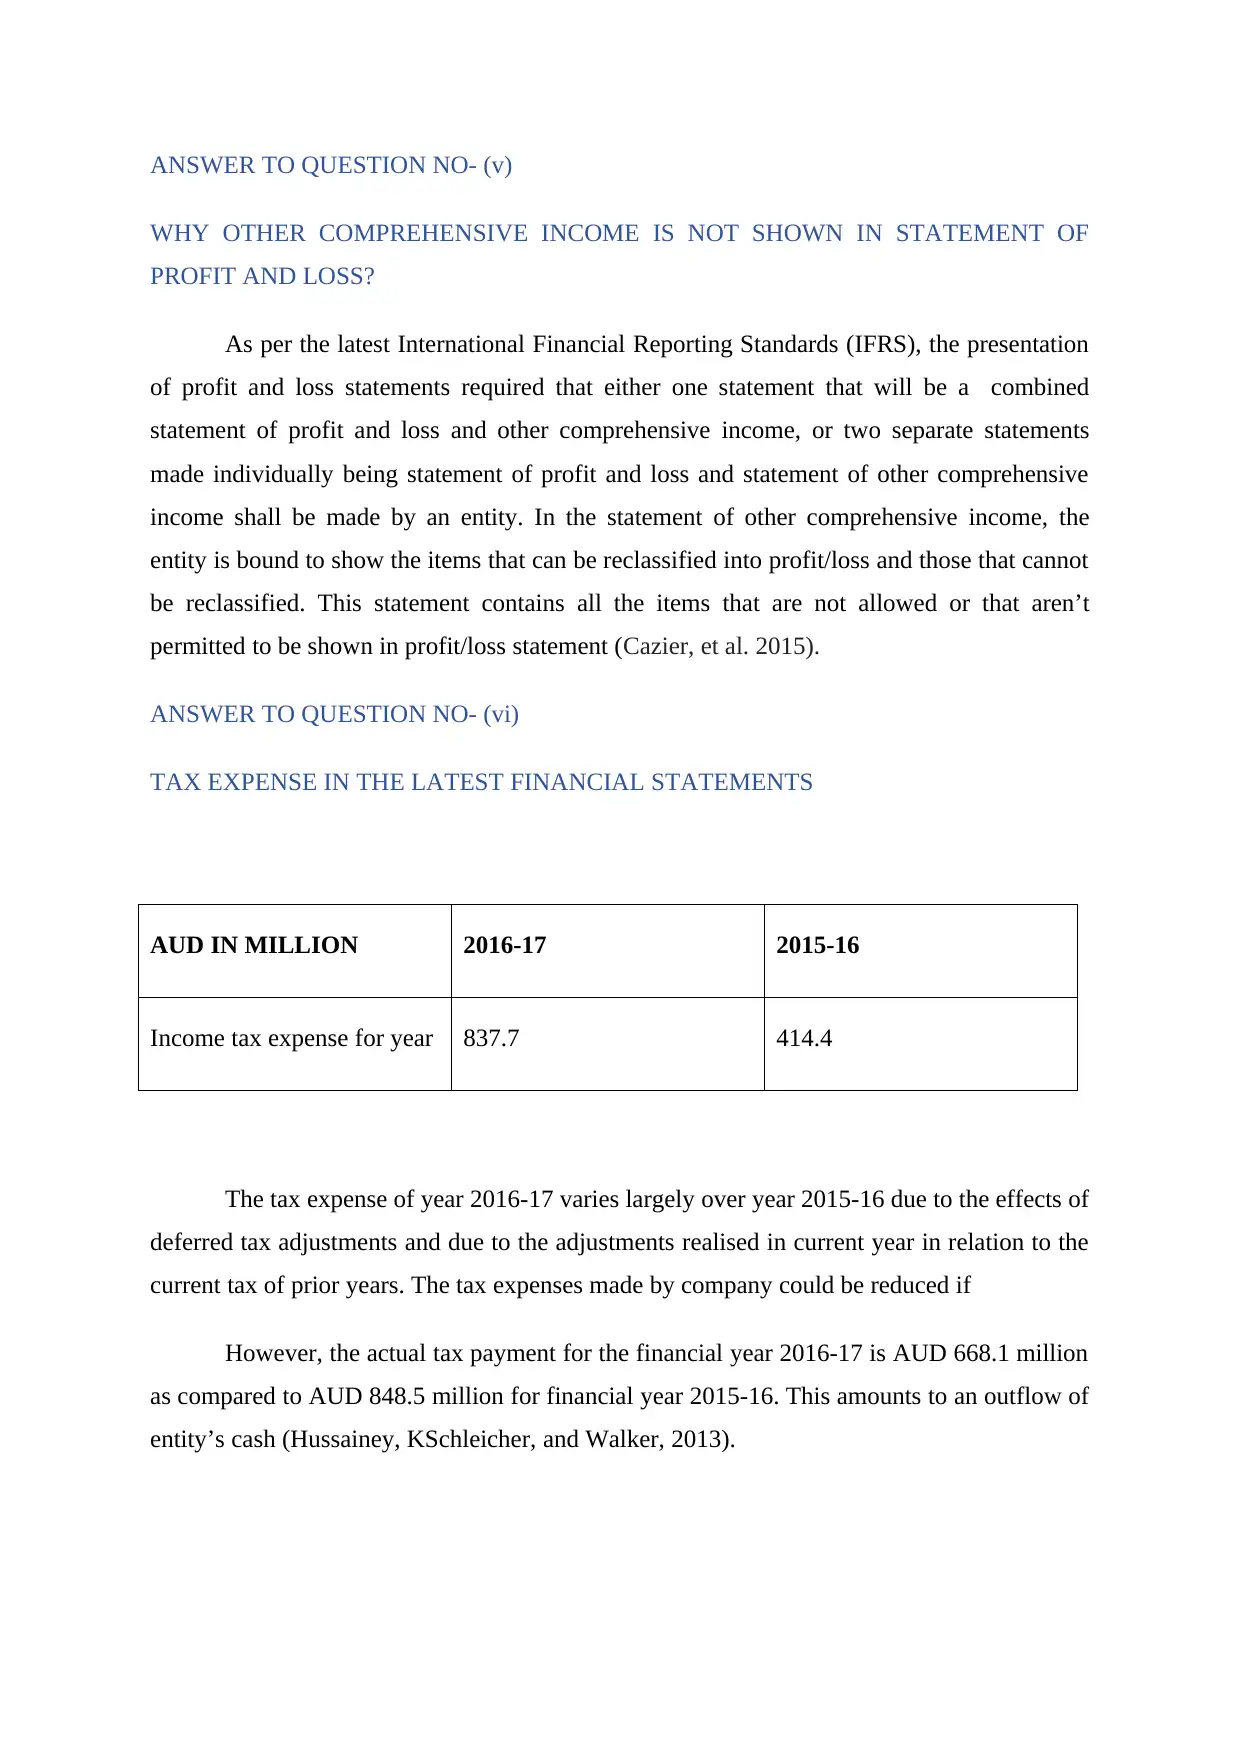
ANSWER TO QUESTION NO- (vi)
TAX EXPENSE IN THE LATEST FINANCIAL STATEMENTS
AUD IN MILLION 2016-17 2015-16
Income tax expense for year 837.7 414.4
The tax expense of year 2016-17 varies largely over year 2015-16 due to the effects of
deferred tax adjustments and due to the adjustments realised in current year in relation to the
current tax of prior years. The tax expenses made by company could be reduced if
However, the actual tax payment for the financial year 2016-17 is AUD 668.1 million
as compared to AUD 848.5 million for financial year 2015-16. This amounts to an outflow of
entity’s cash (Hussainey, KSchleicher, and Walker, 2013).
WHY OTHER COMPREHENSIVE INCOME IS NOT SHOWN IN STATEMENT OF
PROFIT AND LOSS?
As per the latest International Financial Reporting Standards (IFRS), the presentation
of profit and loss statements required that either one statement that will be a combined
statement of profit and loss and other comprehensive income, or two separate statements
made individually being statement of profit and loss and statement of other comprehensive
income shall be made by an entity. In the statement of other comprehensive income, the
entity is bound to show the items that can be reclassified into profit/loss and those that cannot
be reclassified. This statement contains all the items that are not allowed or that aren’t
permitted to be shown in profit/loss statement (Cazier, et al. 2015).
ANSWER TO QUESTION NO- (vi)
TAX EXPENSE IN THE LATEST FINANCIAL STATEMENTS
AUD IN MILLION 2016-17 2015-16
Income tax expense for year 837.7 414.4
The tax expense of year 2016-17 varies largely over year 2015-16 due to the effects of
deferred tax adjustments and due to the adjustments realised in current year in relation to the
current tax of prior years. The tax expenses made by company could be reduced if
However, the actual tax payment for the financial year 2016-17 is AUD 668.1 million
as compared to AUD 848.5 million for financial year 2015-16. This amounts to an outflow of
entity’s cash (Hussainey, KSchleicher, and Walker, 2013).
ANSWER TO QUESTION NO- (vii)
IS THE TAX EXPENSE EQUAL TO THE TAX RATE MULTIPLIED BY ACCOUNTING
INCOME?
The tax expense is not equal to the tax rate multiplied by accounting income due to
tax effects of amounts that are not deductible or either not taxable while calculating the
taxable income, like non-deductible expenses, unrecognised tax losses from the current year,
difference in offshore tax rates, non-deductible impairment expense. Other reasons are also
evident from analysis of the annual report of the company (Mullinova, and Simonyants,
2016).
The other reason being, the calculation of tax expense is a different approach in the
income tax aspect as compared to the accounting aspect. As taxable income is different from
the accounting income, hence the tax expense is different than the product of entity’s
applicable tax rate and accounting income (Ballas, Skoutela and Tzovas, 2010).
ANSWER TO QUESTION NO- (viii)
DEFERRED TAX ASSET/LIABILTY RECORDED IN BALANCE SHEET
When an entity has higher taxable income over accounting income or lower taxable
income over accounting income, it generates deferred asset and deferred liability
respectively. When there is a deferred tax, it means the company has paid taxes higher than
the amount bound to occur if tax was to be paid on accounting income. Likewise, if a
company has deferred tax liability, it means it has paid a tax amount that is lower than the tax
amount it was bound to pay on its accounting income.
Woolworths has reported deferred tax asset in both financial year 2017 and 2016. It
had been AUD 497.7 million in financial year 2016, whereas AUD 372.3 million in financial
year 2017. It means that the company had taxable income which was way to higher both in
financial year 2017 and financial year 2016.
⊘ This is a preview!⊘
Do you want full access?
Subscribe today to unlock all pages.
Trusted by 1+ million students worldwide
ANSWER TO QUESTION NO- (ix)
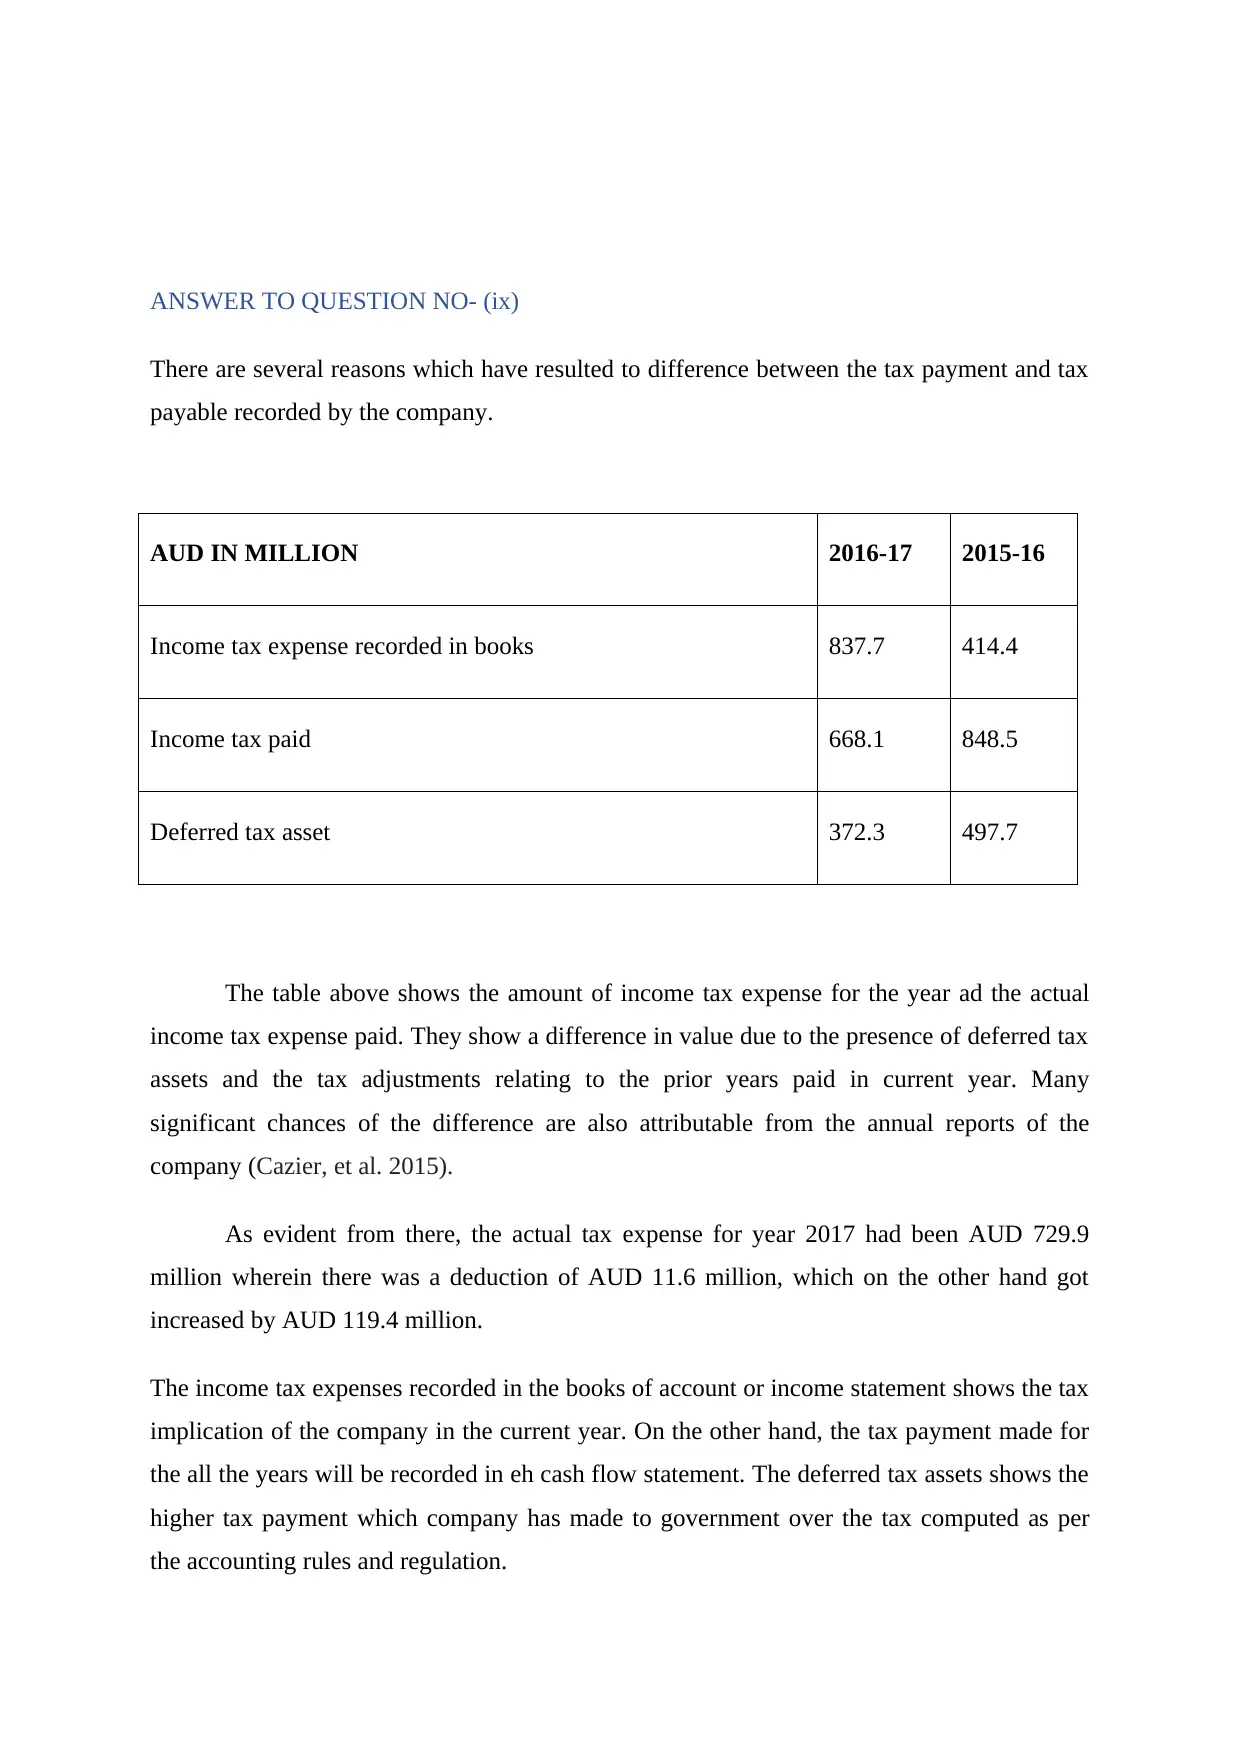
There are several reasons which have resulted to difference between the tax payment and tax
payable recorded by the company.
AUD IN MILLION 2016-17 2015-16
Income tax expense recorded in books 837.7 414.4
Income tax paid 668.1 848.5
Deferred tax asset 372.3 497.7
The table above shows the amount of income tax expense for the year ad the actual
income tax expense paid. They show a difference in value due to the presence of deferred tax
assets and the tax adjustments relating to the prior years paid in current year. Many
significant chances of the difference are also attributable from the annual reports of the
company (Cazier, et al. 2015).
As evident from there, the actual tax expense for year 2017 had been AUD 729.9
million wherein there was a deduction of AUD 11.6 million, which on the other hand got
increased by AUD 119.4 million.
The income tax expenses recorded in the books of account or income statement shows the tax
implication of the company in the current year. On the other hand, the tax payment made for
the all the years will be recorded in eh cash flow statement. The deferred tax assets shows the
higher tax payment which company has made to government over the tax computed as per
the accounting rules and regulation.
Paraphrase This Document
Need a fresh take? Get an instant paraphrase of this document with our AI Paraphraser
ANSWER TO QUESTION NO- (x)
The income tax paid amount shown in cash flow statement shows the amount of tax
actually paid to authorities, irrespective of the fact whether it belongs to current year or
previous years, while the income tax expense in the financial accounts is a tax figure only of
the current year. It does not take into account the effects of previous periods (Štangová, 2017).
From the annual report of Woolworths, it’s available that the income tax expense for
financial year 2017 was AUD 837.7 million whereas the actual payment stood out to be AUD
668.1 million. This difference is due to the amount of deferred tax assets and the items of
previous periods (Cooke, 2009). The income tax payment has been increasing throughout the time
which have shown that company has been increasing its profit throughout the time.
ANSWER TO QUESTION NO- (xi)
INTERESTING
The interesting part about the annual reports of Woolworths is the presentation. A
clear segregation of all the items of the statement are shown in the report. E.g. the tax
expense is properly bifurcated into the deferred, current and prior segments. This gives a
complete information about the different aspects. In addition to this, the main interesting
thing about the recording of the deferred tax assets and deferred tax liabilities of company is
related to the recording of the both. Company cannot record deferred tax assets and deferred
tax liabilities in the books of account at the same time. The deferred tax liabilities should be
carried forward to the extent to which it could be realised in the books of account of company
(Cazier, et al. 2015).
CONFUSING
The confusing part is the analysis portion. Various reasons seem accurate regarding
various conclusions. It’s confusing to determine any particular reason and the accurate one
also behind the scenario. Every second reason leads to another story. However, while
computing the deferred tax assets or recording of income tax payments, company needs to
evaluate whether there is contradiction between the assets and liabilities recording of the
company as per the accounting and income tax rules of AASB 112. It is evaluated that The
deferred tax assets shows the higher tax payment which company has made to government
over the tax computed as per the accounting rules and regulation. On the other hand, deferred
tax liabilities is recorded when the tax payment determined is less to the actual tax payment
to be made by company as per the AASB 112.
DIFFICULT
The interesting part itself becomes the difficult one. With too much of detailing given
in the reports, It is difficult to understand them with a clarity. Too many questions are raised
in mind with every other statement (Sickles, 2012).
But the annual reports as an overall document are full of information. They do tell that
the company is not lacking anywhere in disclosing its information. Transparency is well
evident from the reports. This shows good governance on part of management (Adhikari, and
Tondkar, 2012). The difficulty arises due to the sudden changes in the income tax rules and
regulations. These amendments in the tax rates increase the cash amount blockage of
company.
Conclusion
After analysing the cash flow statement and other books of accounts of the company, it is
inferred that Woolworth Company has maintained an effective compliance program in its
books of account to make the payment of the tax. It has been observed that the tax payment
and its calculation made in the books of account of company should be done as per the
accounting rules and regulation and income tax standards as per the AASB 112. It is
analyzed that the actual tax expense for year 2017 had been AUD 729.9 million wherein there
was a deduction of AUD 11.6 million, which on the other hand got increased by AUD 119.4
million. It shows that company has been consistently using the effective tax planning and
compliance program for the payment of the tax. The main issues in preparing this report was
related to The items that cannot be reclassified to profit/loss includes equity instrument
reserves and retained earnings and income tax effect thereon it is observed that generated
from continued operations is further shown as attributable between equity holders of parent
entity and among the non-controlling interests. Now in the end, it could be inferred that in
case of the contradiction between the set of rules and regulation of the accounting and income
tax, all the applicable rules of the AASB 112 will override in the compliance program of
company (Porter, Hatherly, and Simon, 2018).
⊘ This is a preview!⊘
Do you want full access?
Subscribe today to unlock all pages.
Trusted by 1+ million students worldwide
1 out of 16
Related Documents


Your All-in-One AI-Powered Toolkit for Academic Success.
+13062052269
info@desklib.com
Available 24*7 on WhatsApp / Email
![[object Object]](/_next/static/media/star-bottom.7253800d.svg)
Unlock your academic potential
Copyright © 2020–2026 A2Z Services. All Rights Reserved. Developed and managed by ZUCOL.