Financial Analysis Report: Woolworths Group Limited (MBS539)
VerifiedAdded on 2023/03/20
|8
|1120
|53
Report
AI Summary
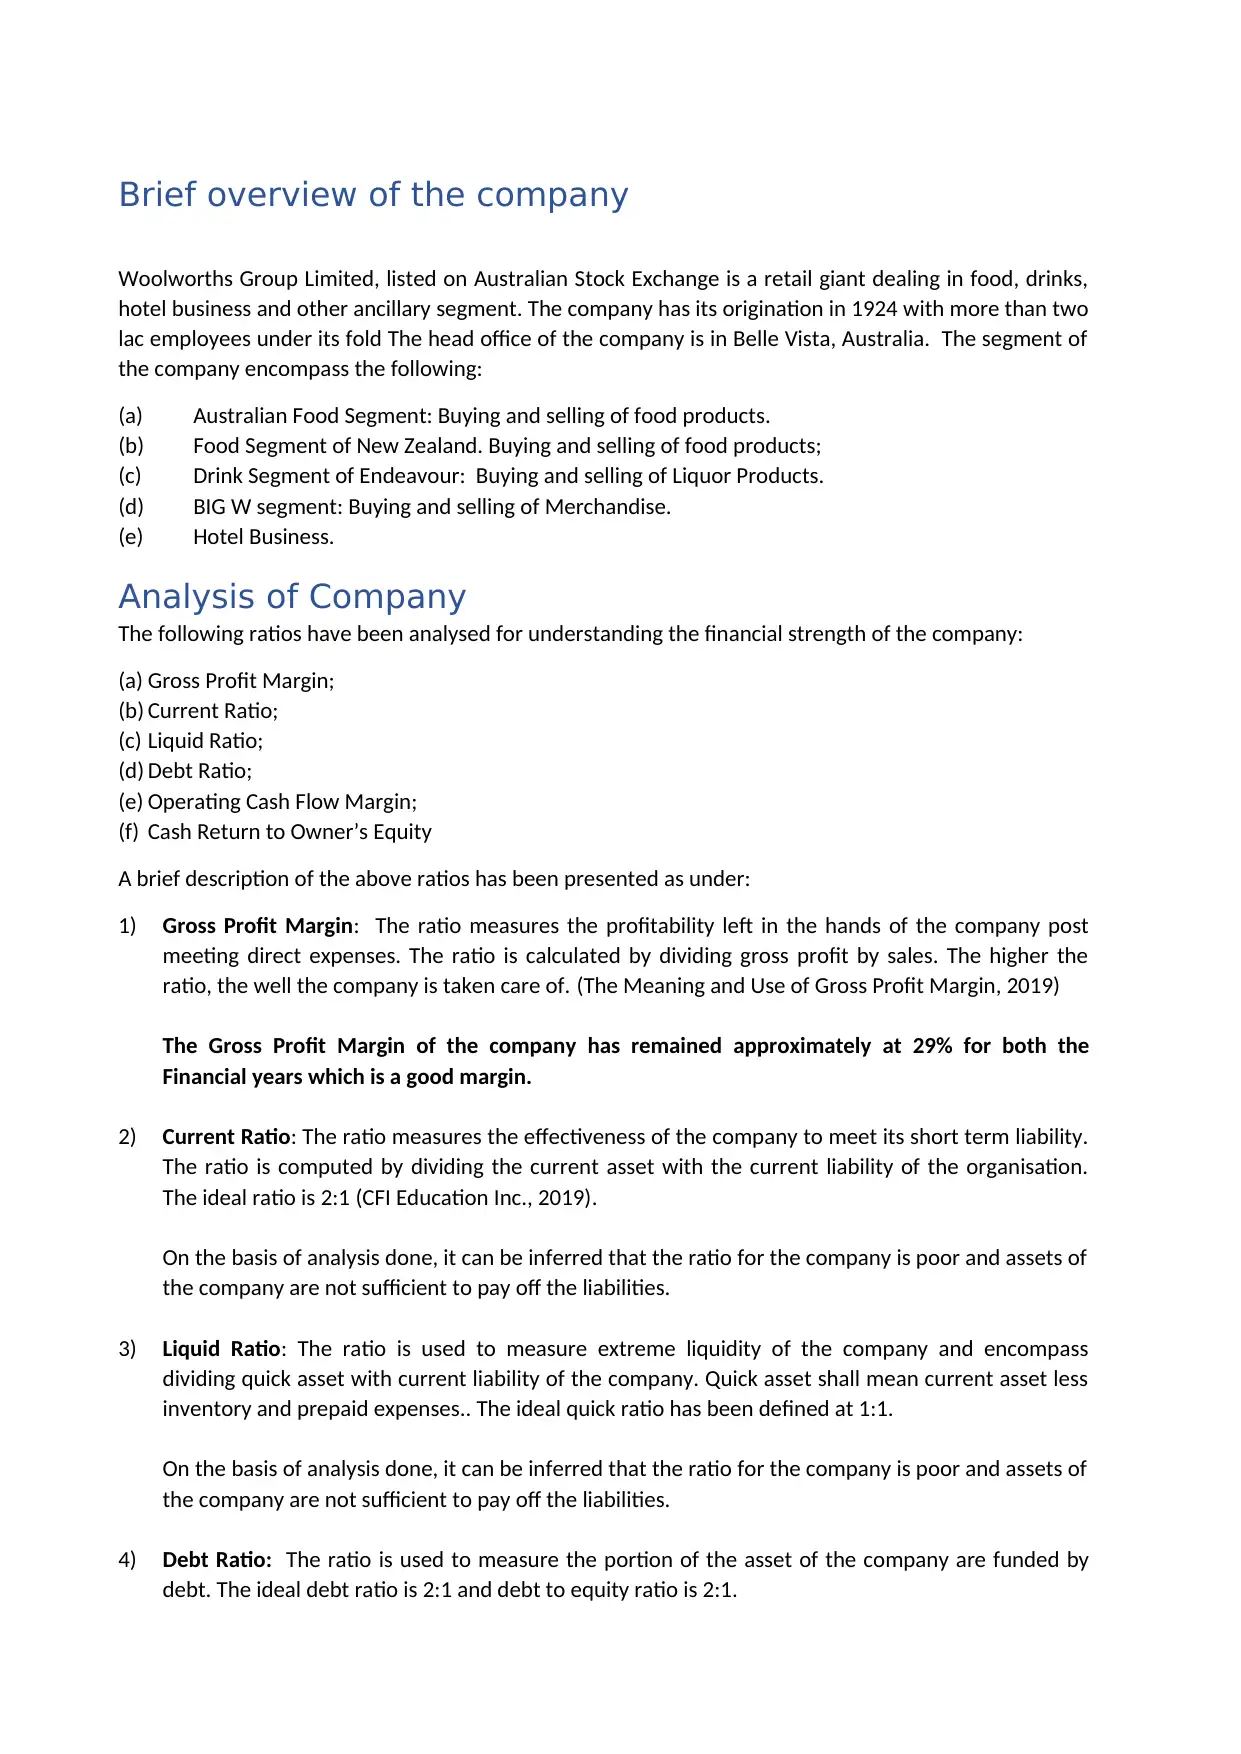
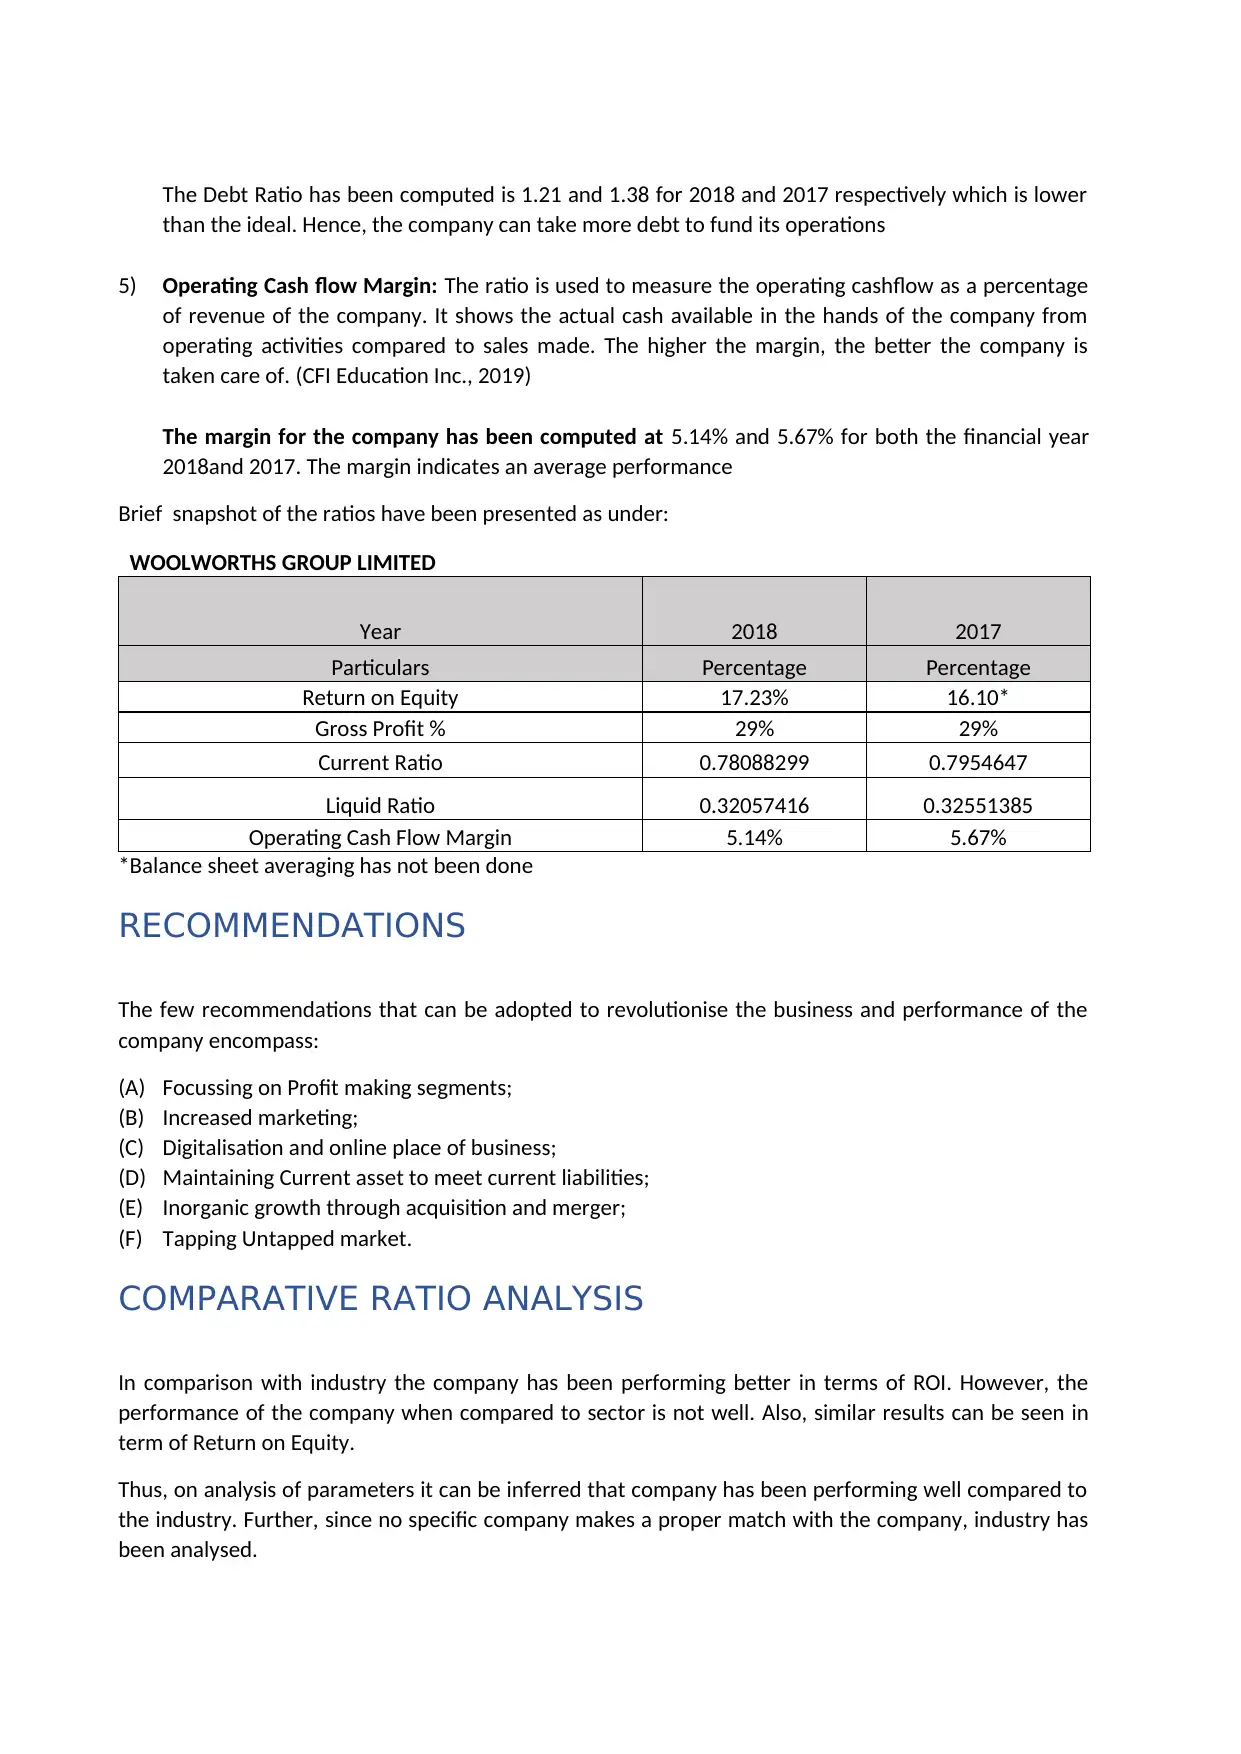
This report provides a financial analysis of Woolworths Group Limited, focusing on key financial ratios and overall company performance. The analysis includes the examination of Gross Profit Margin, Current Ratio, Liquid Ratio, Debt Ratio, Operating Cash Flow Margin, and Cash Return to Owner’s Equity for the years 2017 and 2018. The report assesses the company's profitability, liquidity, and solvency, and provides a comparative ratio analysis with industry standards. Recommendations for improvement are also included, such as focusing on profit-making segments, increased marketing, digitalization, maintaining current assets, inorganic growth, and tapping untapped markets. The report concludes that while the company's profitability and returns are better compared to the industry, there is potential for investment, with some areas requiring improvement. The report is designed to meet the requirements of the MBS539 Major Assignment, with the goal of providing a comprehensive analysis of the company's financial standing and potential for future growth.

FINANCIAL ANALYSIS
OF WOOLWORTHS
COMPANYLIMITED-
ASX
OF WOOLWORTHS
COMPANYLIMITED-
ASX
Paraphrase This Document
Need a fresh take? Get an instant paraphrase of this document with our AI Paraphraser

EXECUTIVE SUMMARY
Woolworths is an Australian retail giant listed on Australian Stock Exchange and is engaged in procuring
good from foreign countries and disposing off the same in the domestic market. Further, on the basis of
financial analysis of the company it can be inferred that on profitability front company has been
performing well compared to its peers while in terms of short term liquidity is graved compared to
stand alone position.
Further, for the purpose of analysing the financial strength of the company various financial analysis
tools have been used.

Contents
EXECUTIVE SUMMARY................................................................................................................................2
Brief overview of the company...................................................................................................................4
Analysis of Company...................................................................................................................................4
RECOMMENDATIONS..................................................................................................................................5
COMPARATIVE RATIO ANALYSIS.................................................................................................................5
CONCLUSION...............................................................................................................................................6
References..................................................................................................................................................7
⊘ This is a preview!⊘
Do you want full access?
Subscribe today to unlock all pages.

Trusted by 1+ million students worldwide

Brief overview of the company
Woolworths Group Limited, listed on Australian Stock Exchange is a retail giant dealing in food, drinks,
hotel business and other ancillary segment. The company has its origination in 1924 with more than two
lac employees under its fold The head office of the company is in Belle Vista, Australia. The segment of
the company encompass the following:
(a) Australian Food Segment: Buying and selling of food products.
(b) Food Segment of New Zealand. Buying and selling of food products;
(c) Drink Segment of Endeavour: Buying and selling of Liquor Products.
(d) BIG W segment: Buying and selling of Merchandise.
(e) Hotel Business.
Analysis of Company
The following ratios have been analysed for understanding the financial strength of the company:
(a) Gross Profit Margin;
(b) Current Ratio;
(c) Liquid Ratio;
(d) Debt Ratio;
(e) Operating Cash Flow Margin;
(f) Cash Return to Owner’s Equity
A brief description of the above ratios has been presented as under:
1) Gross Profit Margin: The ratio measures the profitability left in the hands of the company post
meeting direct expenses. The ratio is calculated by dividing gross profit by sales. The higher the
ratio, the well the company is taken care of. (The Meaning and Use of Gross Profit Margin, 2019)
The Gross Profit Margin of the company has remained approximately at 29% for both the
Financial years which is a good margin.
2) Current Ratio: The ratio measures the effectiveness of the company to meet its short term liability.
The ratio is computed by dividing the current asset with the current liability of the organisation.
The ideal ratio is 2:1 (CFI Education Inc., 2019).
On the basis of analysis done, it can be inferred that the ratio for the company is poor and assets of
the company are not sufficient to pay off the liabilities.
3) Liquid Ratio: The ratio is used to measure extreme liquidity of the company and encompass
dividing quick asset with current liability of the company. Quick asset shall mean current asset less
inventory and prepaid expenses.. The ideal quick ratio has been defined at 1:1.
On the basis of analysis done, it can be inferred that the ratio for the company is poor and assets of
the company are not sufficient to pay off the liabilities.
4) Debt Ratio: The ratio is used to measure the portion of the asset of the company are funded by
debt. The ideal debt ratio is 2:1 and debt to equity ratio is 2:1.
Paraphrase This Document
Need a fresh take? Get an instant paraphrase of this document with our AI Paraphraser

The Debt Ratio has been computed is 1.21 and 1.38 for 2018 and 2017 respectively which is lower
than the ideal. Hence, the company can take more debt to fund its operations
5) Operating Cash flow Margin: The ratio is used to measure the operating cashflow as a percentage
of revenue of the company. It shows the actual cash available in the hands of the company from
operating activities compared to sales made. The higher the margin, the better the company is
taken care of. (CFI Education Inc., 2019)
The margin for the company has been computed at 5.14% and 5.67% for both the financial year
2018and 2017. The margin indicates an average performance
Brief snapshot of the ratios have been presented as under:
WOOLWORTHS GROUP LIMITED
Year 2018 2017
Particulars Percentage Percentage
Return on Equity 17.23% 16.10*
Gross Profit % 29% 29%
Current Ratio 0.78088299 0.7954647
Liquid Ratio 0.32057416 0.32551385
Operating Cash Flow Margin 5.14% 5.67%
*Balance sheet averaging has not been done
RECOMMENDATIONS
The few recommendations that can be adopted to revolutionise the business and performance of the
company encompass:
(A) Focussing on Profit making segments;
(B) Increased marketing;
(C) Digitalisation and online place of business;
(D) Maintaining Current asset to meet current liabilities;
(E) Inorganic growth through acquisition and merger;
(F) Tapping Untapped market.
COMPARATIVE RATIO ANALYSIS
In comparison with industry the company has been performing better in terms of ROI. However, the
performance of the company when compared to sector is not well. Also, similar results can be seen in
term of Return on Equity.
Thus, on analysis of parameters it can be inferred that company has been performing well compared to
the industry. Further, since no specific company makes a proper match with the company, industry has
been analysed.

CONCLUSION
On the basis of above, it can be concluded that from profit point of view, the company has been
performing average with a margin of 3% and from overall return on Equity and Investment, the returns
are better compared to industry. Hence, there is huge potential in company from investment point of
view.
⊘ This is a preview!⊘
Do you want full access?
Subscribe today to unlock all pages.

Trusted by 1+ million students worldwide

References
CFI Education Inc. (2019, May 18). What is the Current Ratio? Retrieved May 15, 2019, from
corporatefinanceinstitute.com:
https://corporatefinanceinstitute.com/resources/knowledge/finance/current-ratio-formula/
CFI Education Inc. (2019, May 18). What is the Operating Cash Flow Ratio? Retrieved May 18, 2019,
from corporatefinanceinstitute.com:
https://corporatefinanceinstitute.com/resources/knowledge/finance/operating-cash-flow-
ratio/
The Meaning and Use of Gross Profit Margin. (2019, May 18). Retrieved May 18, 2019, from
www.thebalancesmb.com: https://www.thebalancesmb.com/what-is-the-gross-profit-margin-
393201
Paraphrase This Document
Need a fresh take? Get an instant paraphrase of this document with our AI Paraphraser

1 out of 8
Related Documents
Your All-in-One AI-Powered Toolkit for Academic Success.
+13062052269
info@desklib.com
Available 24*7 on WhatsApp / Email
Unlock your academic potential
Copyright © 2020–2025 A2Z Services. All Rights Reserved. Developed and managed by ZUCOL.


