Report on Financial Analysis of Woolworths Group Limited (Finance)
VerifiedAdded on 2021/05/31
|18
|4127
|259
Report
AI Summary
This report provides a comprehensive financial analysis of Woolworths Group Limited, an Australian retailer. It begins with an introduction to the company, its ownership structure, and governance. The analysis then delves into key fundamental ratios, including short-term and long-term solvency ratios, asset utilization ratios, profitability ratios, and market value ratios. The report calculates and interprets these ratios for 2016 and 2017, providing insights into the company's financial health and performance. Further, it includes a share price analysis, a discussion of the company's weighted average cost of capital (WACC), debt ratio analysis, and dividend policy. The report concludes with recommendations based on the findings and offers an overall assessment of Woolworths' financial position. The analysis is crucial for investors and stakeholders to understand the company's financial performance and make informed decisions.
RUNNING HEAD: FINANCE
Financial analysis
Financial analysis
Paraphrase This Document
Need a fresh take? Get an instant paraphrase of this document with our AI Paraphraser
Finance 1
Contents
Introduction...........................................................................................................................................2
Description of Woolworths Group Limited...........................................................................................2
Ownership-governance structure...........................................................................................................3
Key Fundamental Ratios.......................................................................................................................3
Short-term solvency ratios.................................................................................................................3
Long term solvency ratio...................................................................................................................5
Asset utilization ratios.......................................................................................................................6
Profitability ratios..............................................................................................................................8
Market value ratios............................................................................................................................9
Share price analysis.............................................................................................................................10
Announcements...................................................................................................................................12
Analysis of stock.................................................................................................................................13
Estimation of weighted average cost of capital....................................................................................14
Analysis of Debt ratio..........................................................................................................................14
Dividend policy...................................................................................................................................15
Recommendations...............................................................................................................................16
Conclusion...........................................................................................................................................16
References...........................................................................................................................................17
Finance 2
Introduction
Financial performance analysis is very important for the company as well as for the investor.
It helps the potential investors in taking important decisions regarding their investment in a
particular company. The analysis include overall evaluation and measurement of company’s
financial position. It includes all the financial and non-financial aspects that reflects the true
performance of an organization.
This report contains an overall financial analysis of an Australian company named as
Woolworths Group Limited. It contains a brief introduction about the company and its
substantial shareholders. Later the fundamental ratios are also calculated along with the
measurement of company’s stock performance against ordinaries indices. The report also
focuses on the WACC of the firm and its debt ratio analysis. In addition to this, the dividend
policy followed by Woolworth is also discussed later in this report. The last part focuses on
the recommendation and the conclusion which includes findings of the report.
Description of Woolworths Group Limited
The company is a major retailer operating in Australia. The company majorly operates
through Australia and New Zealand. After Wesfarmers, it is the second largest retailer in
terms of revenue and also known as the largest takeaway liquor retailer in Australia.
Approximately 205,000 employees are working in Woolworths and the company serves over
29 million customers across the world. The mission of company is to deliver best and quality
products to its customers along with the easy and amazing convenience facility. The main
aim and focus of Woolworths is to be ranked first across all its brands by the customers.
Being an Australian company, it is publicly listed on the ASX and has ticker symbol
WOW.AX.
⊘ This is a preview!⊘
Do you want full access?
Subscribe today to unlock all pages.
Trusted by 1+ million students worldwide
Finance 3
Ownership-governance structure
Main substantial shareholders
The company has no substantial shareholders which holds more than 5% and 20% share in
the business.
Firm Governance
The Chairman: Gordon Cairns
Members of Board: Jillian Broadbent, Holly Kramer, Siobhan McKenna, Scott
Perkins, Kathee Tesija and Michael Ullmer.
The CEO: Brad Banducci (Woolworths Group. 2018).
None of the firm governance member is involved in the list of substantial shareholders of the
company.
Key Fundamental Ratios
These ratios are calculated to measure the financial performance of the company. They
provides a snapshot of the company financial situation internally and externally. A-Cap
Resource Limited’s performance is measure by the fundamental ratios which are as follows:
Short-term solvency ratios
These ratios are basically the liquidity ratios which attempts to measure Company’s ability to
meet its short term obligations. In other words, they seek to determine the ability of the firm
to avoid financial distress in short term period (Bragg, 2012).
1. Current ratio: It is a liquidity ratio which tends to determine the capability of a
company to pay its current liabilities with the use of its current assets. The ideal ratio
is 2:1.
Paraphrase This Document
Need a fresh take? Get an instant paraphrase of this document with our AI Paraphraser
Finance 4
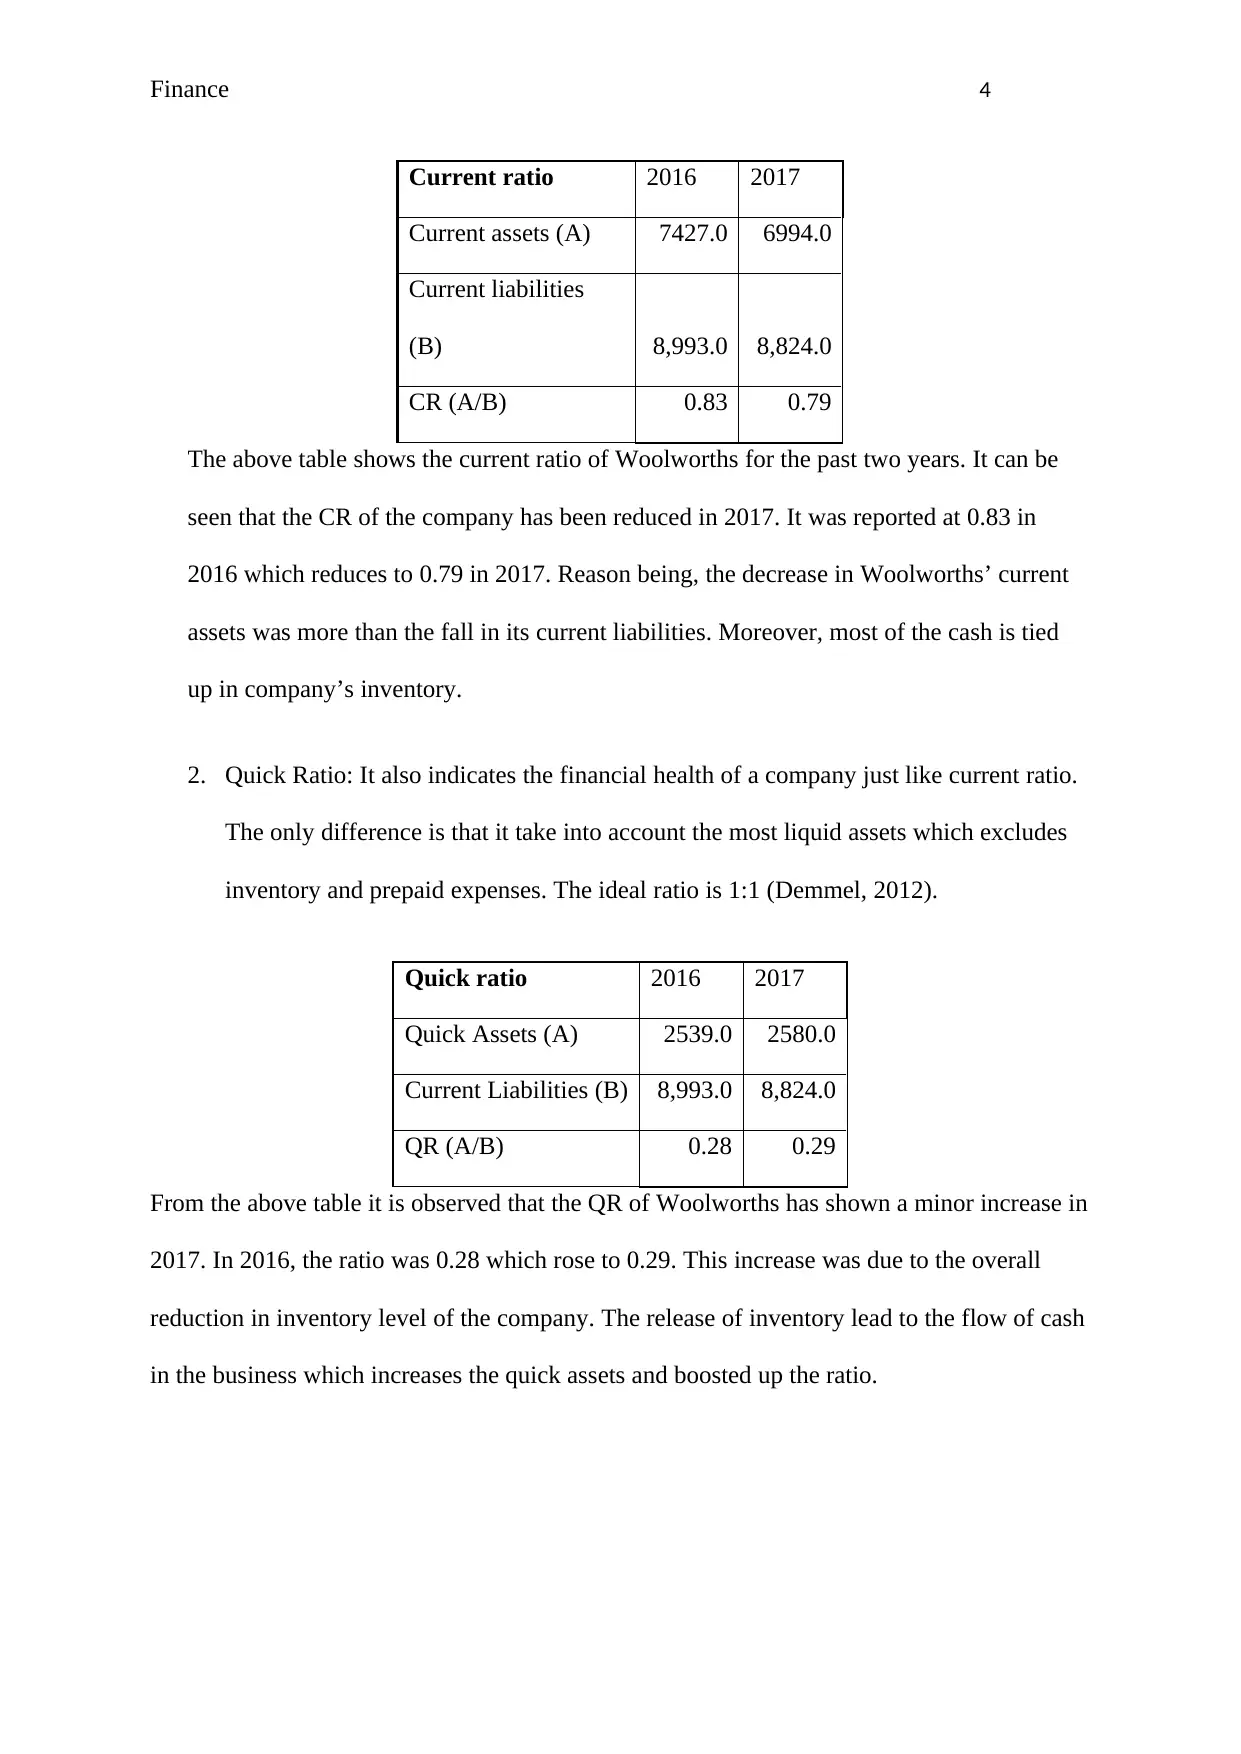
Current ratio 2016 2017
Current assets (A) 7427.0 6994.0
Current liabilities
(B) 8,993.0 8,824.0
CR (A/B) 0.83 0.79
The above table shows the current ratio of Woolworths for the past two years. It can be
seen that the CR of the company has been reduced in 2017. It was reported at 0.83 in
2016 which reduces to 0.79 in 2017. Reason being, the decrease in Woolworths’ current
assets was more than the fall in its current liabilities. Moreover, most of the cash is tied
up in company’s inventory.
2. Quick Ratio: It also indicates the financial health of a company just like current ratio.
The only difference is that it take into account the most liquid assets which excludes
inventory and prepaid expenses. The ideal ratio is 1:1 (Demmel, 2012).
Quick ratio 2016 2017
Quick Assets (A) 2539.0 2580.0
Current Liabilities (B) 8,993.0 8,824.0
QR (A/B) 0.28 0.29
From the above table it is observed that the QR of Woolworths has shown a minor increase in
2017. In 2016, the ratio was 0.28 which rose to 0.29. This increase was due to the overall
reduction in inventory level of the company. The release of inventory lead to the flow of cash
in the business which increases the quick assets and boosted up the ratio.
Finance 5
Long term solvency ratio
They are also known as financial leverage ratios which measure the long term solvency of a
company. The ratios evaluate the capability of the firm to meet its long term liabilities and
determine the extent of financial risk taken by a company (Gibson, 2011).
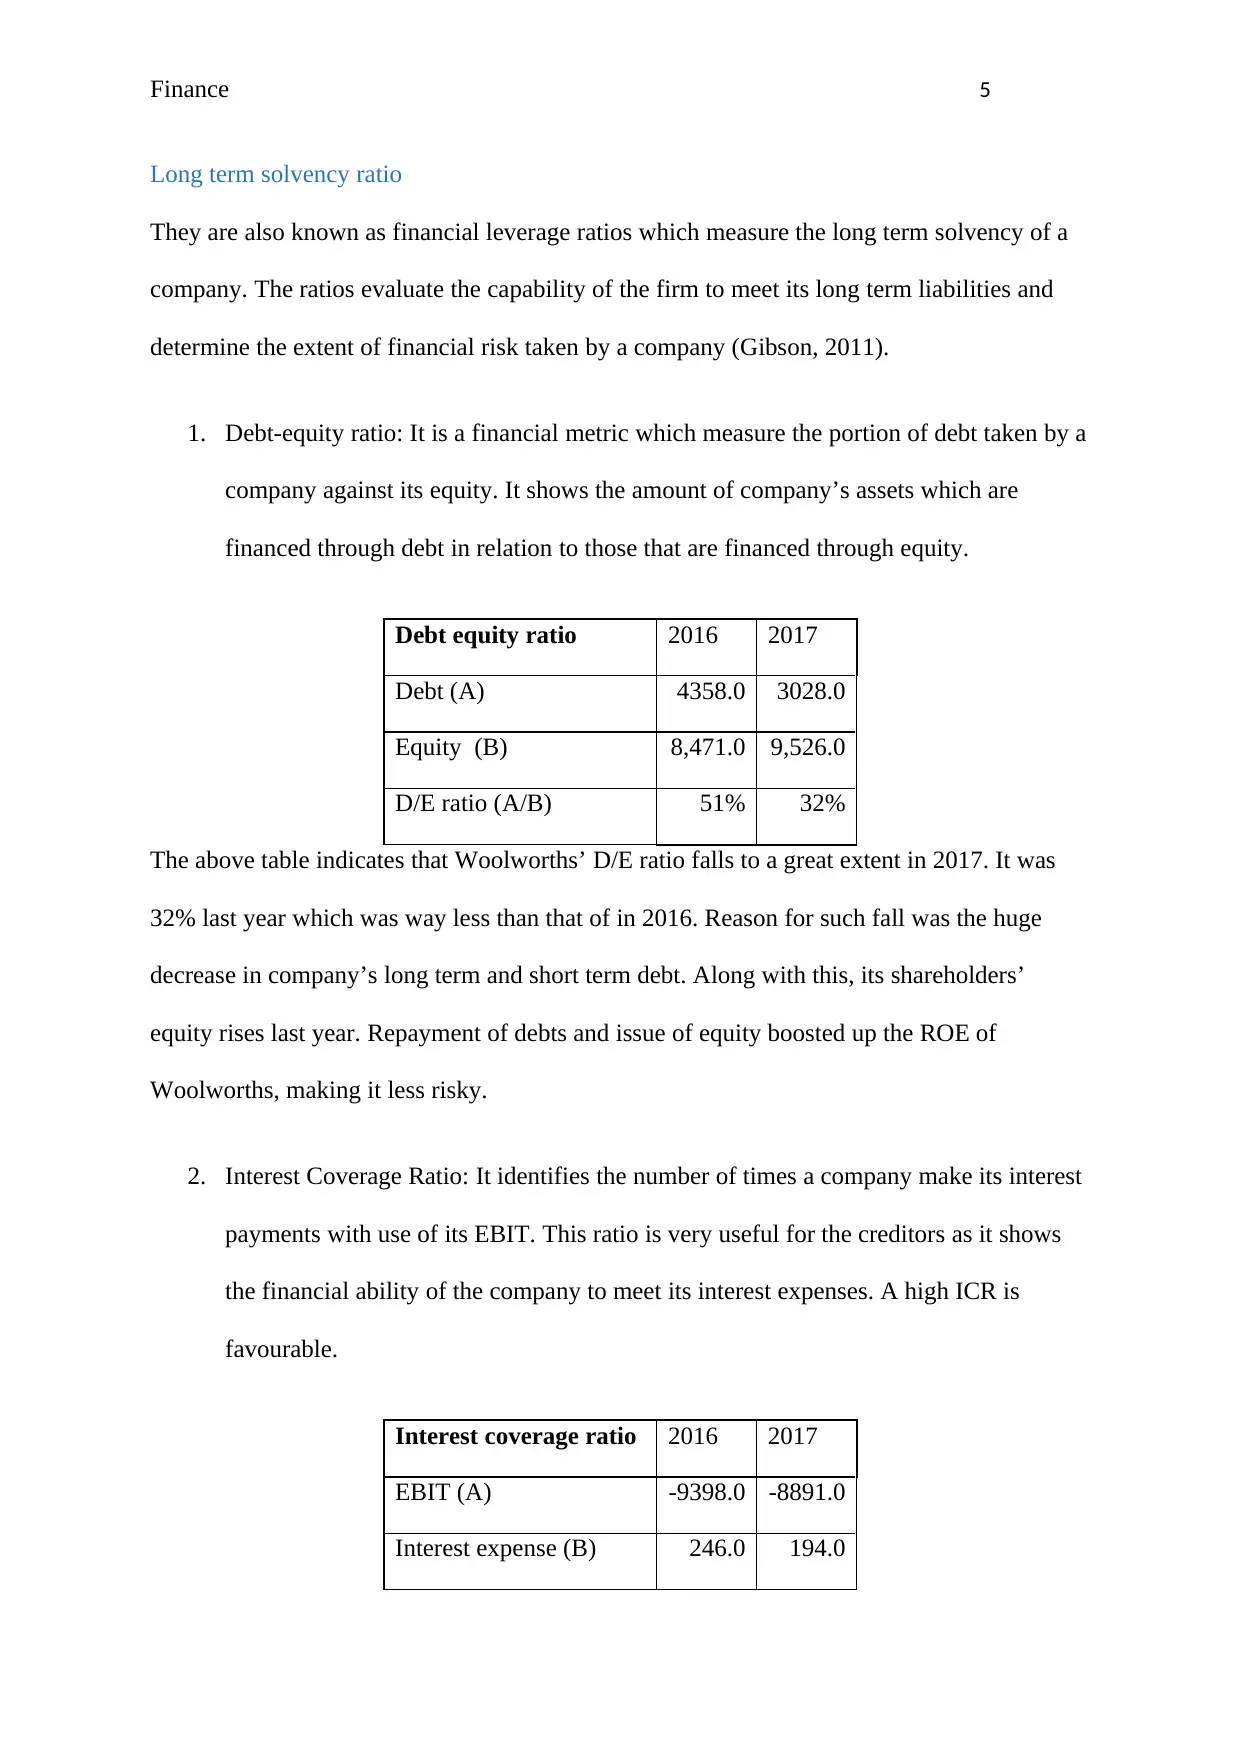
1. Debt-equity ratio: It is a financial metric which measure the portion of debt taken by a
company against its equity. It shows the amount of company’s assets which are
financed through debt in relation to those that are financed through equity.
Debt equity ratio 2016 2017
Debt (A) 4358.0 3028.0
Equity (B) 8,471.0 9,526.0
D/E ratio (A/B) 51% 32%
The above table indicates that Woolworths’ D/E ratio falls to a great extent in 2017. It was
32% last year which was way less than that of in 2016. Reason for such fall was the huge
decrease in company’s long term and short term debt. Along with this, its shareholders’
equity rises last year. Repayment of debts and issue of equity boosted up the ROE of
Woolworths, making it less risky.
2. Interest Coverage Ratio: It identifies the number of times a company make its interest
payments with use of its EBIT. This ratio is very useful for the creditors as it shows
the financial ability of the company to meet its interest expenses. A high ICR is
favourable.
Interest coverage ratio 2016 2017
EBIT (A) -9398.0 -8891.0
Interest expense (B) 246.0 194.0
Long term solvency ratio
They are also known as financial leverage ratios which measure the long term solvency of a
company. The ratios evaluate the capability of the firm to meet its long term liabilities and
determine the extent of financial risk taken by a company (Gibson, 2011).
1. Debt-equity ratio: It is a financial metric which measure the portion of debt taken by a
company against its equity. It shows the amount of company’s assets which are
financed through debt in relation to those that are financed through equity.
Debt equity ratio 2016 2017
Debt (A) 4358.0 3028.0
Equity (B) 8,471.0 9,526.0
D/E ratio (A/B) 51% 32%
The above table indicates that Woolworths’ D/E ratio falls to a great extent in 2017. It was
32% last year which was way less than that of in 2016. Reason for such fall was the huge
decrease in company’s long term and short term debt. Along with this, its shareholders’
equity rises last year. Repayment of debts and issue of equity boosted up the ROE of
Woolworths, making it less risky.
2. Interest Coverage Ratio: It identifies the number of times a company make its interest
payments with use of its EBIT. This ratio is very useful for the creditors as it shows
the financial ability of the company to meet its interest expenses. A high ICR is
favourable.
Interest coverage ratio 2016 2017
EBIT (A) -9398.0 -8891.0
Interest expense (B) 246.0 194.0
⊘ This is a preview!⊘
Do you want full access?
Subscribe today to unlock all pages.
Trusted by 1+ million students worldwide
Finance 6
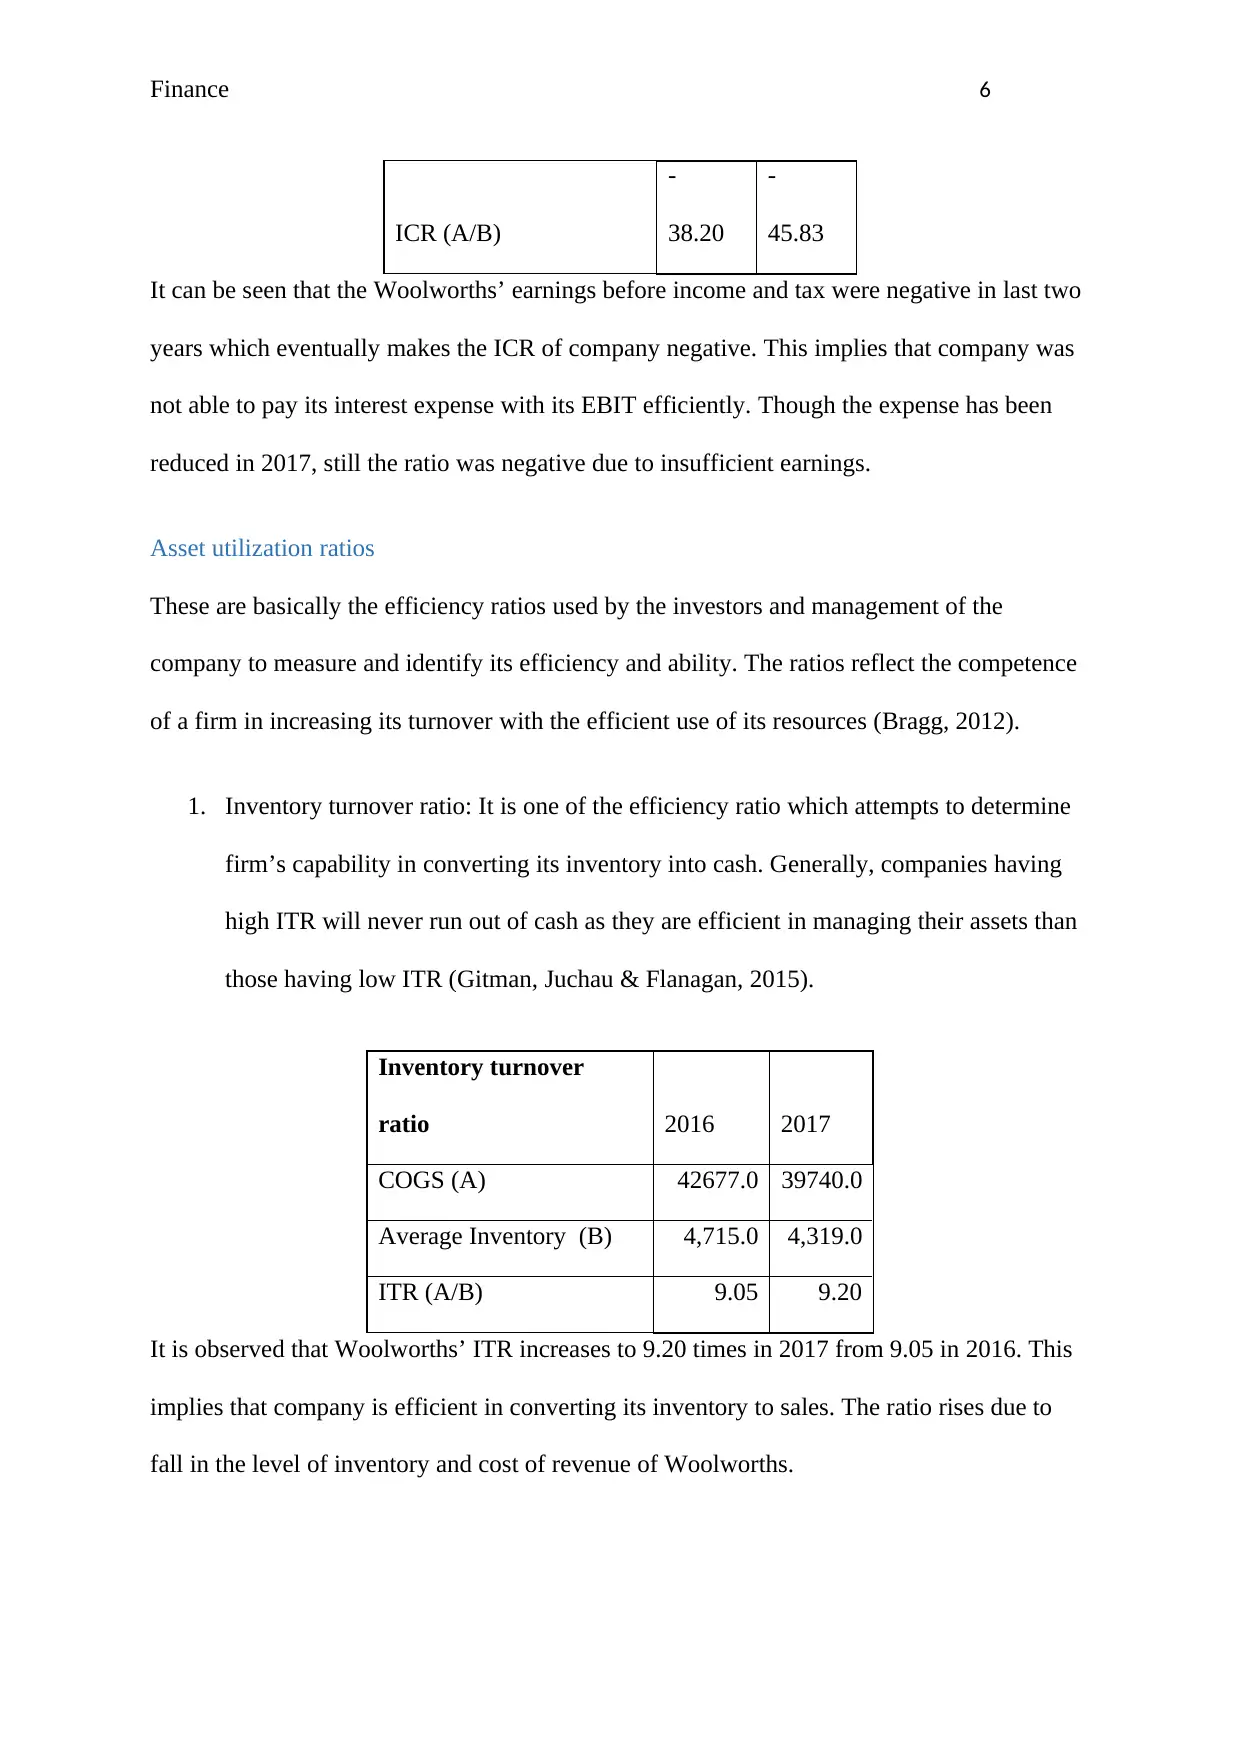
ICR (A/B)
-
38.20
-
45.83
It can be seen that the Woolworths’ earnings before income and tax were negative in last two
years which eventually makes the ICR of company negative. This implies that company was
not able to pay its interest expense with its EBIT efficiently. Though the expense has been
reduced in 2017, still the ratio was negative due to insufficient earnings.
Asset utilization ratios
These are basically the efficiency ratios used by the investors and management of the
company to measure and identify its efficiency and ability. The ratios reflect the competence
of a firm in increasing its turnover with the efficient use of its resources (Bragg, 2012).
1. Inventory turnover ratio: It is one of the efficiency ratio which attempts to determine
firm’s capability in converting its inventory into cash. Generally, companies having
high ITR will never run out of cash as they are efficient in managing their assets than
those having low ITR (Gitman, Juchau & Flanagan, 2015).
Inventory turnover
ratio 2016 2017
COGS (A) 42677.0 39740.0
Average Inventory (B) 4,715.0 4,319.0
ITR (A/B) 9.05 9.20
It is observed that Woolworths’ ITR increases to 9.20 times in 2017 from 9.05 in 2016. This
implies that company is efficient in converting its inventory to sales. The ratio rises due to
fall in the level of inventory and cost of revenue of Woolworths.
Paraphrase This Document
Need a fresh take? Get an instant paraphrase of this document with our AI Paraphraser
Finance 7
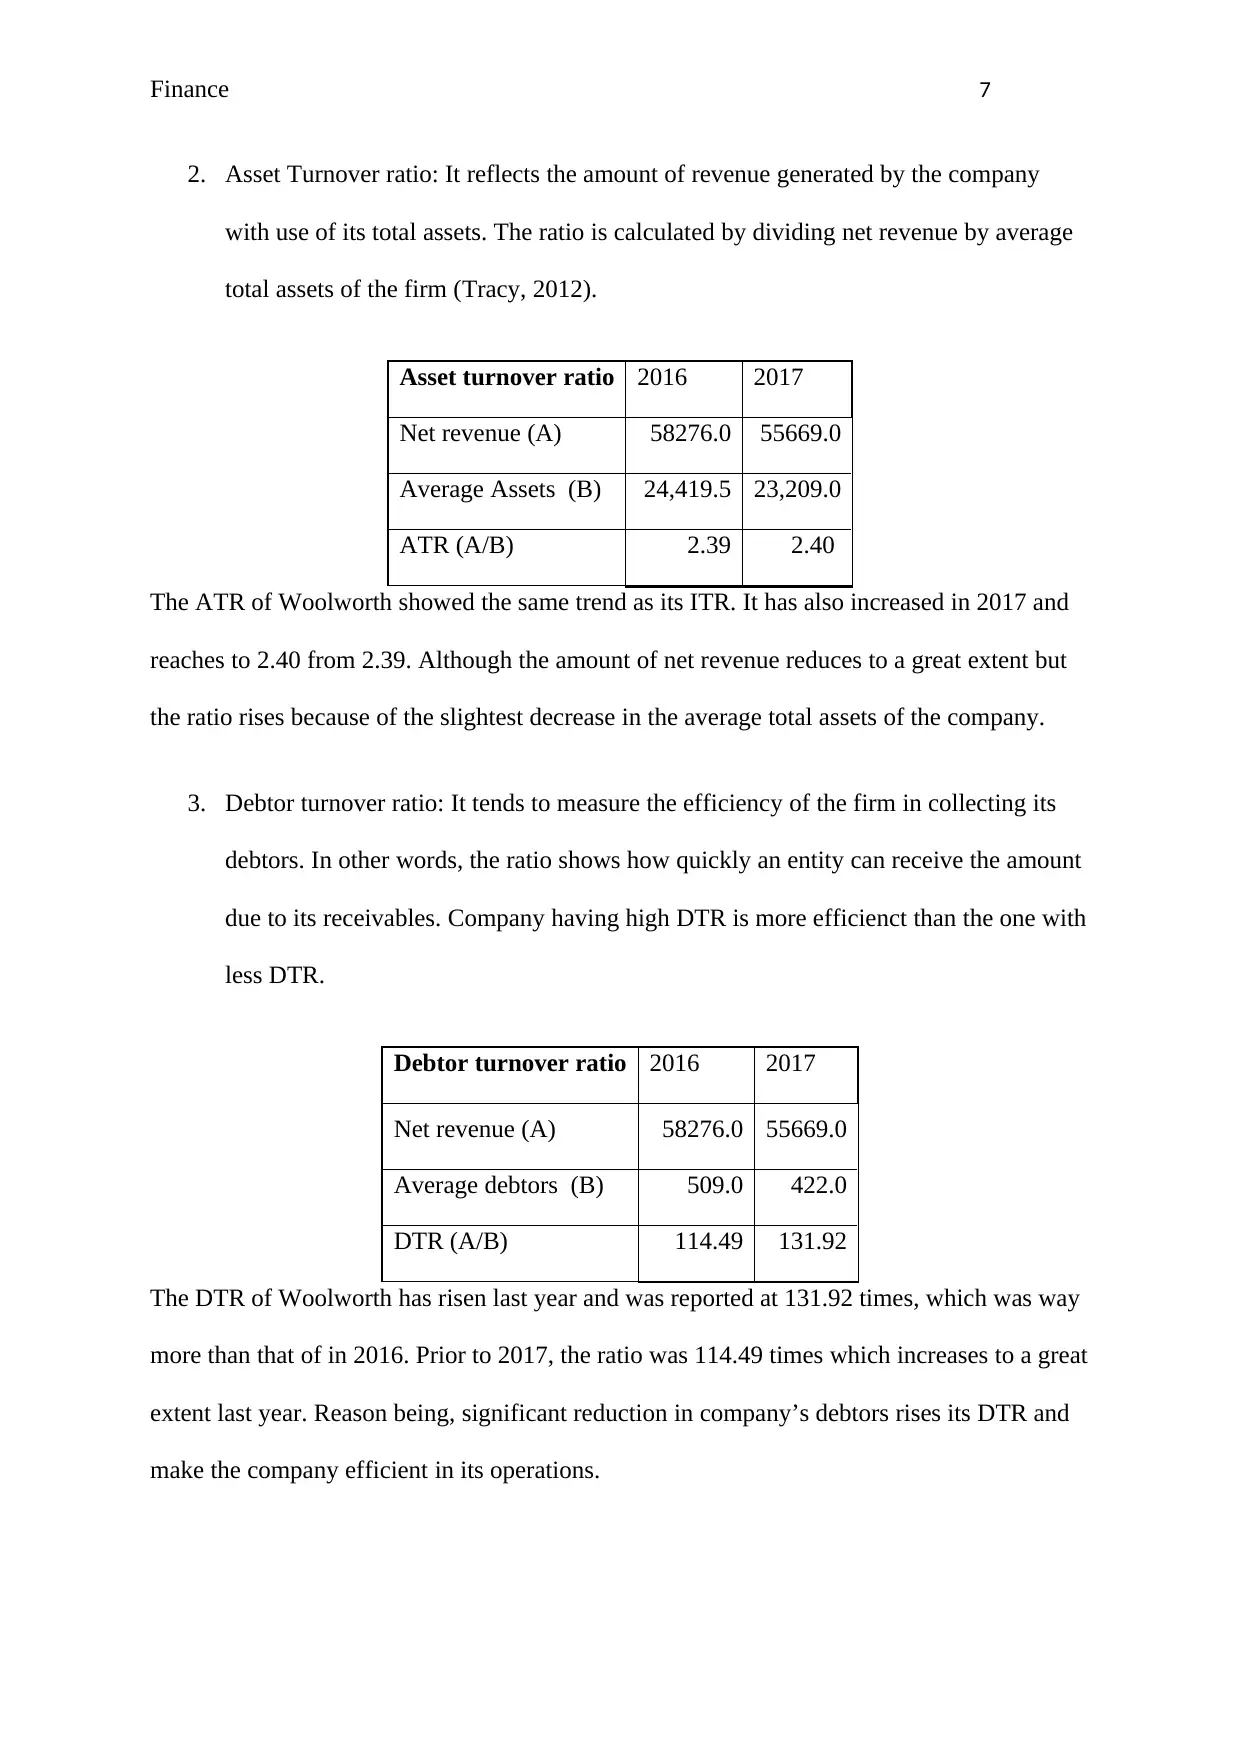
2. Asset Turnover ratio: It reflects the amount of revenue generated by the company
with use of its total assets. The ratio is calculated by dividing net revenue by average
total assets of the firm (Tracy, 2012).
Asset turnover ratio 2016 2017
Net revenue (A) 58276.0 55669.0
Average Assets (B) 24,419.5 23,209.0
ATR (A/B) 2.39 2.40
The ATR of Woolworth showed the same trend as its ITR. It has also increased in 2017 and
reaches to 2.40 from 2.39. Although the amount of net revenue reduces to a great extent but
the ratio rises because of the slightest decrease in the average total assets of the company.
3. Debtor turnover ratio: It tends to measure the efficiency of the firm in collecting its
debtors. In other words, the ratio shows how quickly an entity can receive the amount
due to its receivables. Company having high DTR is more efficienct than the one with
less DTR.
Debtor turnover ratio 2016 2017
Net revenue (A) 58276.0 55669.0
Average debtors (B) 509.0 422.0
DTR (A/B) 114.49 131.92
The DTR of Woolworth has risen last year and was reported at 131.92 times, which was way
more than that of in 2016. Prior to 2017, the ratio was 114.49 times which increases to a great
extent last year. Reason being, significant reduction in company’s debtors rises its DTR and
make the company efficient in its operations.
Finance 8
Profitability ratios
These ratios measures the overall profitability position of the firm operating within the
industry. It gives a snapshot of the profits earned by the company in relation to its revenue,
equity and assets.
1. Net profit ratio: It measures the amount of profit made by a company in proportion of
its total revenue. The value is expressed in terms of percentage and is mostly used by
investors and owners (Jenter & Lewellen, 2015).
Net profit
margin 2016 2017
Net profit (A) -1235.0 1534.0
Total revenue (B) 58,276.0 55,669.0
NPR (A/B) -2% 3%
The position of Woolworth has improved in 2017 and its NPR became positive. In 2016,
company incurred loss of $1235 million which change into profit worth $1534 million in
2017. This boosted up its NPR from -2% to 3% last year.
2. Return on assets: It reflects the amount of net profit made by the firm in respect to its
total assets. It is also one of the profitability ratio and it takes into account the
performance of all the firm’s assets (Saleem & Rehman, 2011).
Return on Assets 2016 2017
Net profit (A) -1235.0 1534.0
Total Assets (B)
23,502.
0
22,916.
0
ROA (A/B) -5% 7%
⊘ This is a preview!⊘
Do you want full access?
Subscribe today to unlock all pages.
Trusted by 1+ million students worldwide
Finance 9
It also shows the same trend as NPR of Woolworths. It has increased from -5% to 7% last
year due to the profits made by the company. Also the amount of assets is less which means
company has properly utilized its resources in generating revenue.
3. Return on Equity: It is a financial ratio which measure the amount of return offered by
an organization to its shareholders for their investment in its business. This ratio is
majorly used by the stakeholders of the company to measure the viability and
profitability of their investment.
Return on Equity 2016 2017
Net income available to
shareholders (A) -1235.0 1534.0
Shareholder's equity (B) 8,471.0 9,526.0
ROE (A/B) -15% 16%
Due to increase in profits, Woolworths’ ROE also rises along with the increase in its equity.
In 2016, the ratio was -15% which turns out to be 16% in 2017. Reason for such upsurge was
the overall increase in company’s shareholder equity and net income.
Market value ratios
They measure the current stock performance of an entity in respect of the market conditions.
They include the following:
1. Earnings per share: It shows the amount of earnings earned by each outstanding share
of the company.
Earnings per share 2016 2017
Net income (A) -1235.0 1534.0
Outstanding shares 1,264.0 1,288.0
Paraphrase This Document
Need a fresh take? Get an instant paraphrase of this document with our AI Paraphraser
Finance 10
(B)
EPS (A/B) - 0.98 1.19
Woolworths’ EPS also shows the same trend as its profitability ratio. It increases from -0.98
cents to 1.19 cents in year 2017. Reason being, the number of shares issued by the company
increases last year along with its profits.
2. Price earnings ratio: The ratio is also known as price multiple as it shows the
willingness of an investor in paying an amount for each dollar of earnings (Parrino,
Kidwell & Bates, 2011).
Price Earnings
ratio 2016 2017
MPS (A) 22.47 26.69
EPS (B) -0.98 1.19
P/E ratio (A/B) - 23.00 22.41
The P/E ratio of Woolworths has shown an increase in the last two years and has also become
positive. Its market price per share rose from $22.47 to $26.69, EPS became positive and the
ratio got a hike. This implies that company’s stock has performed better in last two years.
Share price analysis
Graphical representation
Finance 11
4/1/2016
6/1/2016
8/1/2016
10/1/2016
12/1/2016
2/1/2017
4/1/2017
6/1/2017
8/1/2017
10/1/2017
12/1/2017
2/1/2018
4/1/2018
(0.06)
(0.04)
(0.02)
-
0.02
0.04
0.06
0.08
0.10
0.12
0.14
Woolworths Limited
Average return
(Au.finance.yahoo.com. 2018).
4/1/2016
6/1/2016
8/1/2016
10/1/2016
12/1/2016
2/1/2017
4/1/2017
6/1/2017
8/1/2017
10/1/2017
12/1/2017
2/1/2018
4/1/2018
(0.06)
(0.04)
(0.02)
-
0.02
0.04
0.06
0.08
All Ordinaries Indices
Average return
(Au.finance.yahoo.com. 2018).
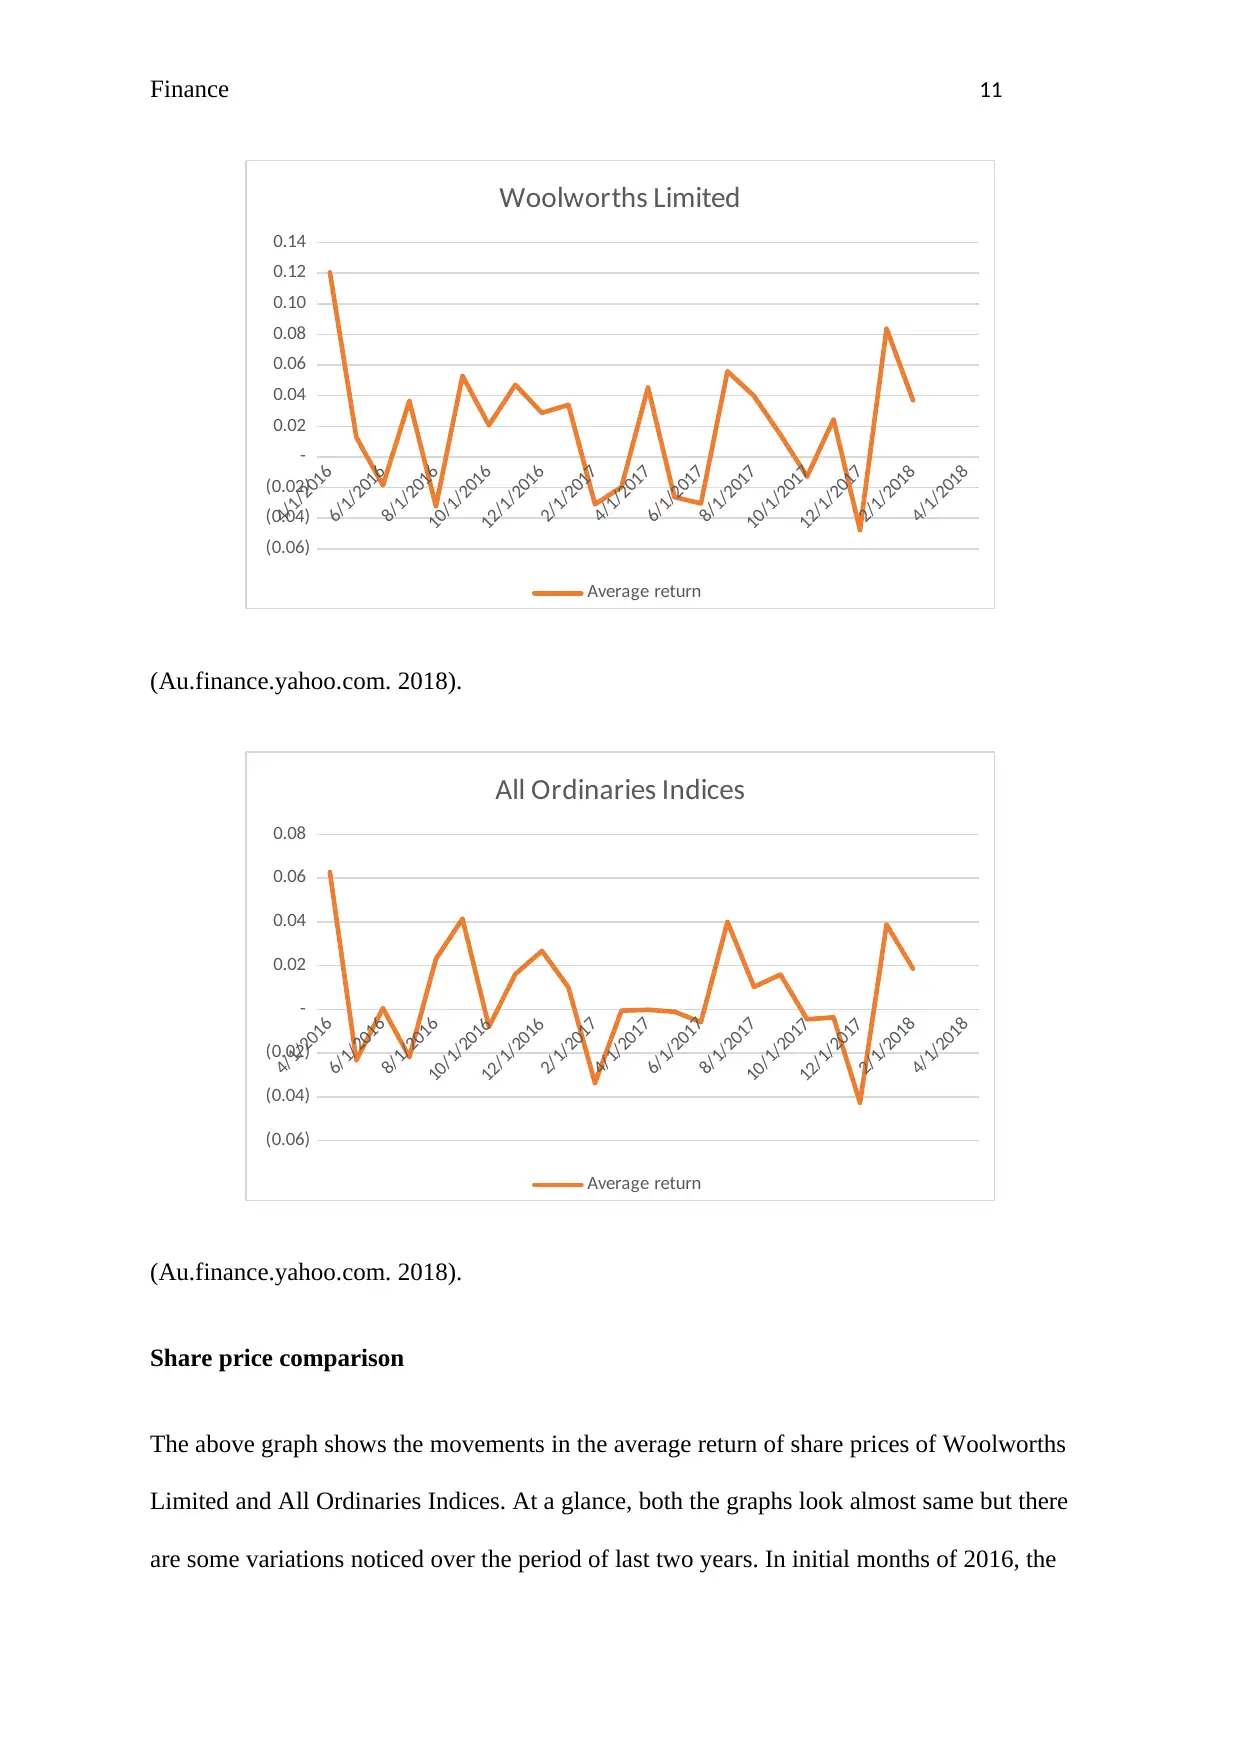
Share price comparison
The above graph shows the movements in the average return of share prices of Woolworths
Limited and All Ordinaries Indices. At a glance, both the graphs look almost same but there
are some variations noticed over the period of last two years. In initial months of 2016, the
4/1/2016
6/1/2016
8/1/2016
10/1/2016
12/1/2016
2/1/2017
4/1/2017
6/1/2017
8/1/2017
10/1/2017
12/1/2017
2/1/2018
4/1/2018
(0.06)
(0.04)
(0.02)
-
0.02
0.04
0.06
0.08
0.10
0.12
0.14
Woolworths Limited
Average return
(Au.finance.yahoo.com. 2018).
4/1/2016
6/1/2016
8/1/2016
10/1/2016
12/1/2016
2/1/2017
4/1/2017
6/1/2017
8/1/2017
10/1/2017
12/1/2017
2/1/2018
4/1/2018
(0.06)
(0.04)
(0.02)
-
0.02
0.04
0.06
0.08
All Ordinaries Indices
Average return
(Au.finance.yahoo.com. 2018).
Share price comparison
The above graph shows the movements in the average return of share prices of Woolworths
Limited and All Ordinaries Indices. At a glance, both the graphs look almost same but there
are some variations noticed over the period of last two years. In initial months of 2016, the
⊘ This is a preview!⊘
Do you want full access?
Subscribe today to unlock all pages.
Trusted by 1+ million students worldwide
1 out of 18
Related Documents


Your All-in-One AI-Powered Toolkit for Academic Success.
+13062052269
info@desklib.com
Available 24*7 on WhatsApp / Email
![[object Object]](/_next/static/media/star-bottom.7253800d.svg)
Unlock your academic potential
Copyright © 2020–2026 A2Z Services. All Rights Reserved. Developed and managed by ZUCOL.