Comprehensive Financial Analysis of Woolworths Company: ACC701 Report
VerifiedAdded on 2023/06/04
|22
|4468
|407
Report
AI Summary
This report presents a financial analysis of Woolworths Ltd, fulfilling the requirements of an ACC701 assignment. The analysis encompasses a detailed examination of Woolworths' financial statements, including ratio analysis (liquidity, profitability, efficiency, and capital structure) and common size analysis for 2016 and 2017. The report further extends to trend analysis over a five-year period (2013-2017), evaluating key financial metrics and performance indicators. The study also includes an assessment of the company's long-term solvency and culminates in a well-reasoned recommendation regarding investment in Woolworths. The report aims to provide insights into the company's financial health, performance trends, and overall investment potential, based on the provided data and analysis tools.

Woolworths Company
Financial Management
Financial analysis
PC-AS0197
[Pick the date]
Financial Management
Financial analysis
PC-AS0197
[Pick the date]
Paraphrase This Document
Need a fresh take? Get an instant paraphrase of this document with our AI Paraphraser

Executive Summary
With the ramified economic changes, and complex business activities, every investor
needs to take imperative financial decisions to create value on their invested capital. There
are several financial analysis tools such as ratio analysis, top down analysis, du pont analysis,
share price valuation analysis and capital budgeting tools which could be used to evaluate the
financial performance of company.

Table of Contents
Executive Summary...............................................................................................................................1
INTRODUCTION.................................................................................................................................2
Description of Woolworths Company...............................................................................................3
Task-1....................................................................................................................................................3
Assess the company’s performance over the last three years.................................................................3
LIQUIDITY RATIOS.......................................................................................................................3
PROFITABILITY RATIOS..............................................................................................................3
EFFECIENCY RATIO OR ACTIVITY RATIO...............................................................................6
CAPITAL STRUCTURE RATIOS...................................................................................................7
Long -term solvency of the company over the last three years..............................................................8
Trend analysis of Woolworths Company...............................................................................................8
Recommendation to investors............................................................................................................11
Conclusion...........................................................................................................................................12
References...........................................................................................................................................13
INTRODUCTION
This report reveals the key information and financial analysis of company which
could strengthen the financial investment decisions of company. In this report, financial
performance of Woolworths has been assessed which will help in determining whether the
invested capital could be used to create value on the investment. The ratio analysis and
shareholder value analysis is the most effective tool which could be used to assess
profitability, liquidity, efficiency and share price fluctuation of company in long run. In the
starting, financial performance analysis is made. After that share price value analysis has
been done by using the share price valuation tool. Afterward, CAPM method is used to
identify the cost of capital and weighted average cost of capital of company. It will assist
organization to determine whether it has performed well in market. After that, discussion
about the share valuation and financial position of company has been made by analysing the
data. Investors needs to assess the financial performance of company before investing their
⊘ This is a preview!⊘
Do you want full access?
Subscribe today to unlock all pages.
Trusted by 1+ million students worldwide

money so that they could identify whether the invested capital will provide return to company
or not.
Description of Woolworths Company
It is an Australian company which is engaged in providing the super market services to
clients so they could get all types of goods from only single one store chain. The
headquartered of company is in Bella, Vista, Australia. The share price value of company has
increased by 14% since last three years which reflects higher amount of business growth and
sustainability in long run (Woolworths Limited, 2017).
Task-1
Assess the company’s performance over the last two years
The ratio analysis of company is made to establish the relation between two financial factors.
It would assist in assessing the profitability, liquidity, efficiency and share price fluctuation
of company (Woolworths Limited, 2017).
LIQUIDITY RATIOS
The liquidity ratio is used to analysis whether company is able to meet its short term and long
term liabilities. It is analyzed that company has good amount of cash blockage in its current
assets (Delen, Kuzey, &Uyar, 2013). This company has decreased its cash blockage in its
current assets with a view to lower down its cost of capital. It is analysed that company has
reduced its investment in its current assets which might negatively impact the business
growth of the organization. It is analyzed that company could easily reduce the cost of capital
if it effectively manages its liquid assets. With the changes in time, it has lower down its cash
blockage but it might negatively impact the business functioning of organization if there is
high demand in market (Goldmann, 2017). As compared to market industry ratio, it has
maintained higher liquidity in its business.
PROFITABILITY RATIOS
This ratio divulges the profit earning capacity of company in long run. It measures
company’s earning capacity which will assist in determining how well company has
Paraphrase This Document
Need a fresh take? Get an instant paraphrase of this document with our AI Paraphraser
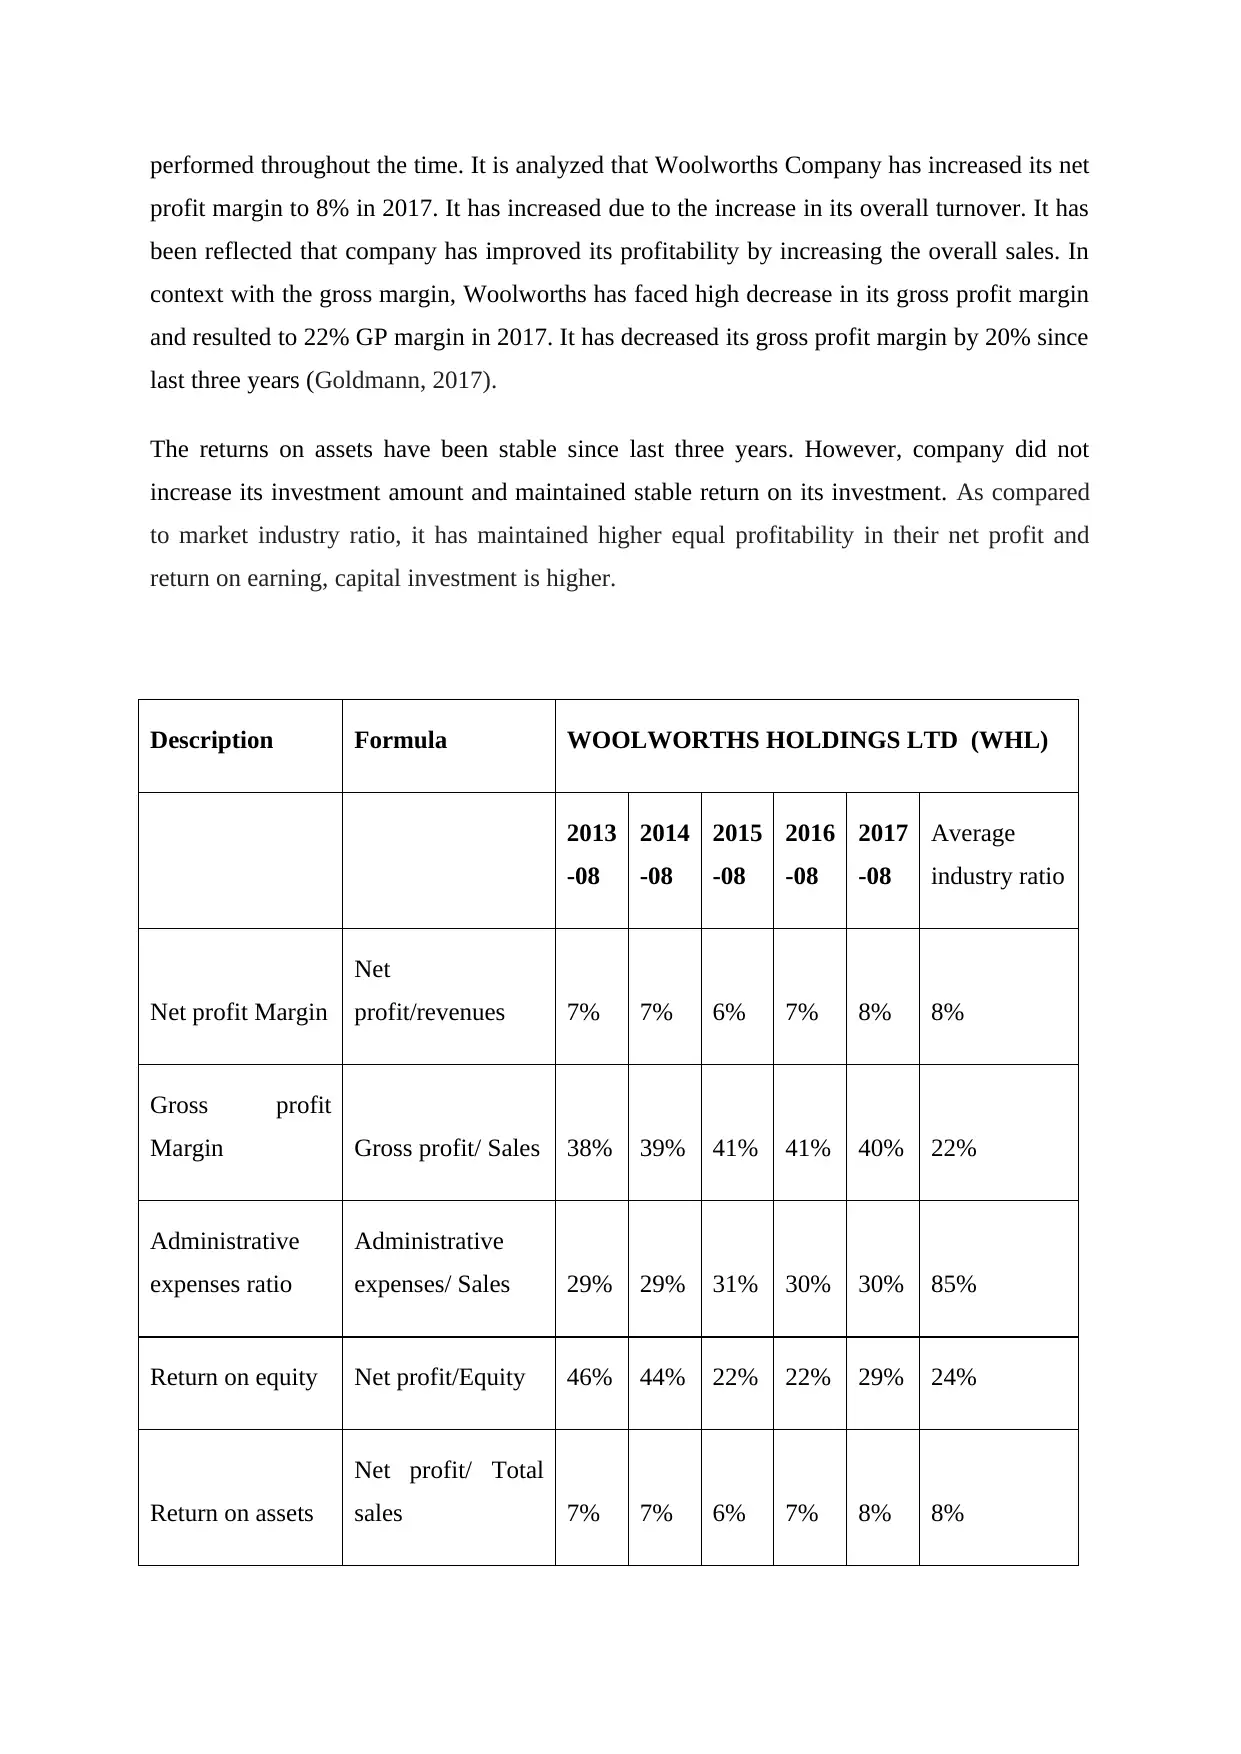
performed throughout the time. It is analyzed that Woolworths Company has increased its net
profit margin to 8% in 2017. It has increased due to the increase in its overall turnover. It has
been reflected that company has improved its profitability by increasing the overall sales. In
context with the gross margin, Woolworths has faced high decrease in its gross profit margin
and resulted to 22% GP margin in 2017. It has decreased its gross profit margin by 20% since
last three years (Goldmann, 2017).
The returns on assets have been stable since last three years. However, company did not
increase its investment amount and maintained stable return on its investment. As compared
to market industry ratio, it has maintained higher equal profitability in their net profit and
return on earning, capital investment is higher.
Description Formula WOOLWORTHS HOLDINGS LTD (WHL)
2013
-08
2014
-08
2015
-08
2016
-08
2017
-08
Average
industry ratio
Net profit Margin
Net
profit/revenues 7% 7% 6% 7% 8% 8%
Gross profit
Margin Gross profit/ Sales 38% 39% 41% 41% 40% 22%
Administrative
expenses ratio
Administrative
expenses/ Sales 29% 29% 31% 30% 30% 85%
Return on equity Net profit/Equity 46% 44% 22% 22% 29% 24%
Return on assets
Net profit/ Total
sales 7% 7% 6% 7% 8% 8%

Earnings per
share
Net profit/ Share
outstanding 0.50 0.25 .1.5 0.65 0.45 0.85
The return on equity of company has increased to 24% which is 2% higher since last three
years. This reflects that company has more earning available to distribute to its equity
shareholders (Woolworths Limited, 2016).The earning per share of company has also
decreased with the decrease in its overall profit. These all things have reflected that company
has lower down its profitability. In order to improve the profitability, company must lower
down its operating expenses and increase its overall revenue (Goel, Chadha, and Sharma,
2015).
⊘ This is a preview!⊘
Do you want full access?
Subscribe today to unlock all pages.
Trusted by 1+ million students worldwide
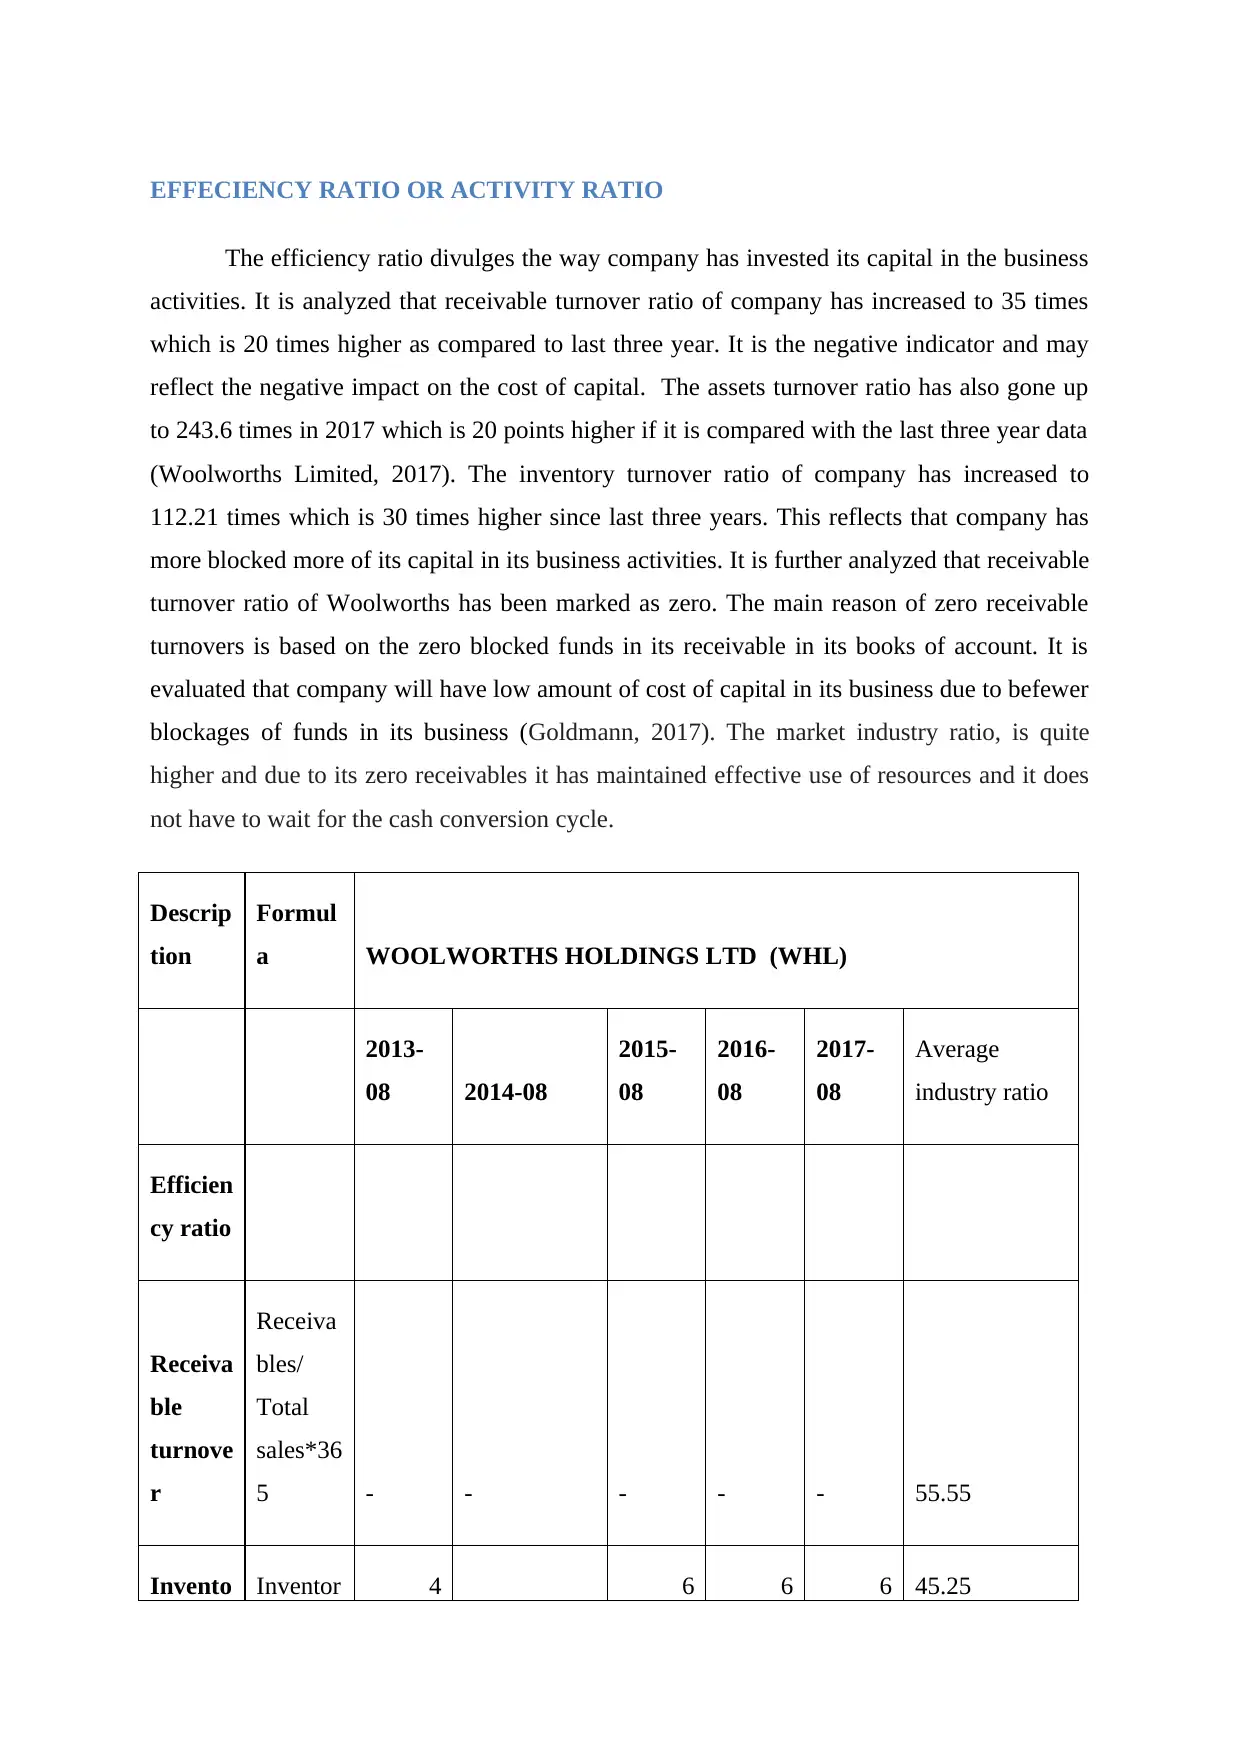
EFFECIENCY RATIO OR ACTIVITY RATIO
The efficiency ratio divulges the way company has invested its capital in the business
activities. It is analyzed that receivable turnover ratio of company has increased to 35 times
which is 20 times higher as compared to last three year. It is the negative indicator and may
reflect the negative impact on the cost of capital. The assets turnover ratio has also gone up
to 243.6 times in 2017 which is 20 points higher if it is compared with the last three year data
(Woolworths Limited, 2017). The inventory turnover ratio of company has increased to
112.21 times which is 30 times higher since last three years. This reflects that company has
more blocked more of its capital in its business activities. It is further analyzed that receivable
turnover ratio of Woolworths has been marked as zero. The main reason of zero receivable
turnovers is based on the zero blocked funds in its receivable in its books of account. It is
evaluated that company will have low amount of cost of capital in its business due to befewer
blockages of funds in its business (Goldmann, 2017). The market industry ratio, is quite
higher and due to its zero receivables it has maintained effective use of resources and it does
not have to wait for the cash conversion cycle.
Descrip
tion
Formul
a WOOLWORTHS HOLDINGS LTD (WHL)
2013-
08 2014-08
2015-
08
2016-
08
2017-
08
Average
industry ratio
Efficien
cy ratio
Receiva
ble
turnove
r
Receiva
bles/
Total
sales*36
5 - - - - - 55.55
Invento Inventor 4 6 6 6 45.25
Paraphrase This Document
Need a fresh take? Get an instant paraphrase of this document with our AI Paraphraser

ry
turnove
r
y / cost
of
goods
sold
*365 8.85 51.80 4.35 7.27 2.63
Accoun
ts
Payabl
e ratio
Payable
s/ Total
sales*36
5
3
9.76 42.51
4
9.73
2
7.77
2
4.17 32.55
Debt to equity ratio
Debt to capital ratio
The debt to equity ratio shows the relation between the debt and equity of company.
Woolworths needs to manage its debt and equity in its business effectively so that it could
manage its financial leverage and cost of capital. If company have high debt capital in its
capital structure then it will also result to higher financial leverage. The debt to equity of
Woolworths is 1.36 which is .60 points higher as compared to last three year data. It shows
that company needs to reduce its debt portion in its business for some time as it is facing
downfall in its profitability. The downfall in its profitability will destruct the business if it
fails to cover the financial leverage (Hunjra, and Bashir, 2014).
Time interest ratio
Time interest ratio is used to measure the how well company has managed its interest
payment. The interest payment of company should not be more than the profit earning
capacity. If company fails to pay off its interest payment then it will destruct its business and
result to loss of business in long run (Maina, and Sakwa, 2017).

Long -term solvency of the company over the last three years
The long term solvency of the Woolworths could be measured by evaluating the debt and
equity of company and it’s gearing ratio which could be available to cover up its interest
payment. The long term solvency of company is good. However company has kept 36% debt
portion and 64% part of the capital is equity. Nonetheless, due to the low profitability, it
might negatively impact the financial leverage and may result to destruction of the business
(Meena, and Dhar, 2016).
Trend analysis of Woolworths Company
The trend analysis is used to analysis the financial performance of company in the future. It is
used to analysis the trend of the company and how it has been increasing its net profit and
revenue (Miller-Nobles, Mattison, and Matsumura, 2016).
Trend analysis of the Revenue
The trend analysis is used to analysis the changes in the revenue of the Woolworths Company
(Ehiedu, 2014). However, as per the basis of the last year data, company has it has been
analysed that company has been increasing its overall revenue throughout the time
(Woolworths Limited, 2017).
Trend analysis of Woolworth Company
Part
icul
ar 2013 2014 2015 2016 2017 2018 2019 2020 2021 2022
Rev
enu
e
$
35,22
7.00
$
39,70
7.00
$
56,50
6.00
$
65,00
4.00
$
67,41
1.00
$
79,67
0.50
$
88,63
7.00
$
97,60
3.50
$
106,57
0.00
$
115,53
6.50
⊘ This is a preview!⊘
Do you want full access?
Subscribe today to unlock all pages.
Trusted by 1+ million students worldwide

2013 2014 2015 2016 2017 2018 2019 2020 2021 2022
$-
$20,000.00
$40,000.00
$60,000.00
$80,000.00
$100,000.00
$120,000.00
Trend analysis of Reveune
Revenue
This graph reflect that Woolworths Company has increasing revenue in its business which
reflects that it could have increased business outcomes if it consistently perform like its
previous year. However, there might be possible changes which could have faced throughout
the time (Mwangi, and Murigu, 2015).
Trend analysis of the net profit
Trend analysis of Woolworth company
Parti
cula
r 2013 2014 2015 2016 2017 2018 2019 2020 2021 2022
Net
Prof
it
$
2,597.
00
$
2,888.
00
$
3,116.
00
$
4,344.
00
$
5,446.
00
$
5,824.
40
$
6,539.
80
$
7,255.
20
$
7,970.
60
$
8,686.
00
This analysis reveals that Woolworths would have increasing profit earing capacity which
reflects positive indicator for the future growth and sustainable business practice (Rani,
Yadav, and Jain, 2015).
Paraphrase This Document
Need a fresh take? Get an instant paraphrase of this document with our AI Paraphraser

This trend analysis has reflected how well company has created value on its investment and
increased its business outcomes. It is further analyzed that company will also have increased
revenue which will eventually impact positively on the business outcomes throughout the
time.
2013 2014 2015 2016 2017 2018 2019 2020 2021 2022
$-
$1,000.00
$2,000.00
$3,000.00
$4,000.00
$5,000.00
$6,000.00
$7,000.00
$8,000.00
$9,000.00
Trend analysis of Net Profit
Net Profit
Share price analysis of Woolworths
The share price analysis is used to identify the ups and down related to financial performance
of Company. It is analyzed that the share price value of company has been increasing
throughout the time (Sujan, Islam, Azad, and Rayhan, 2017).Nonetheless, the increasing
share price movement has reflected that Woolworths will grow effectively with the increase
in the movement of the capital outcomes. The share price analysis of the Woolworths
company could be made by using the below given graph. This graph has been prepared on the
basis of the share price changes of the company since last three years. However, after
analysing the historical changes in the share price of the company it is found that Woolworths
Company has faced high loss in its business in 2017 and faced downfall in its share price
movement (Woolworths Limited, 2017). It is analyzed that company has increased its share
price in 2016 and after ending of the 2016 the share price of company started to go down.
This reflects how well company has been performing. In 2017 due to the downfall in its
profitability, low business efficiency, it has faced high loss in its business and resulted to
decreased business outcomes (Vogel, 2014).

8/31/2015
12/1/2015
3/2/2016
6/2/2016
9/2/2016
12/3/2016
3/5/2017
6/5/2017
9/5/2017
12/6/2017
3/8/2018
6/8/2018
9/8/2018
-1
-0.8
-0.6
-0.4
-0.2
0
0.2
Woolworths Plc Adj Close (All ordinary
share index) null
4947.899902
5151.799805 5316
5447.799805
5310.399902 5644
5529.399902
5525.200195
5402.399902
5502.399902
5719.100098 5675 5761
5903.799805
5947.600098
5761.299805 5764
5773.899902
5776.299805
5744.899902 5976.399
Recommendation to investors
After analysing the financial performance and business digits of Woolworths, it could be
inferred that due to the strengthen sustainability and strong financial performance, investors
may have good amount of value creation if they invest their capital in long run. There are
several recommendations given as below for the betterment of the investment decision made
by the investors (Waemustafa, and Sukri, 2016).
The financial leverage of company is high it might be risky for the investors to get
back their money if company fails to earn profit and goes into liquidation. It is
advised that those investors who are afraid to take risk should not invest their capital
in Woolworths.
Investors should invest their capital in Woolworths only for long run. If they invest
their capital in Woolworths for short term then they will end up having high amount
of business loss in their business. Nonetheless, there are some chances when investors
could invest their money in short run and could create value on their investment.
The share price fluctuation of Woolworths is high. It could be beneficial for the
organization as if they uses the proper investment tool then they could find out some
of the situation when the share price of company will rise and down. Investors should
wait for the right moment and right financial tools to create value on its investment
(Woolworths Limited, 2017).
⊘ This is a preview!⊘
Do you want full access?
Subscribe today to unlock all pages.
Trusted by 1+ million students worldwide
1 out of 22
Related Documents


Your All-in-One AI-Powered Toolkit for Academic Success.
+13062052269
info@desklib.com
Available 24*7 on WhatsApp / Email
![[object Object]](/_next/static/media/star-bottom.7253800d.svg)
Unlock your academic potential
Copyright © 2020–2026 A2Z Services. All Rights Reserved. Developed and managed by ZUCOL.