Financial Statistics Report: Woolworths Group Performance Analysis

Verified

Added on  2023/06/10

|10
|1551
|383
Report
AI Summary
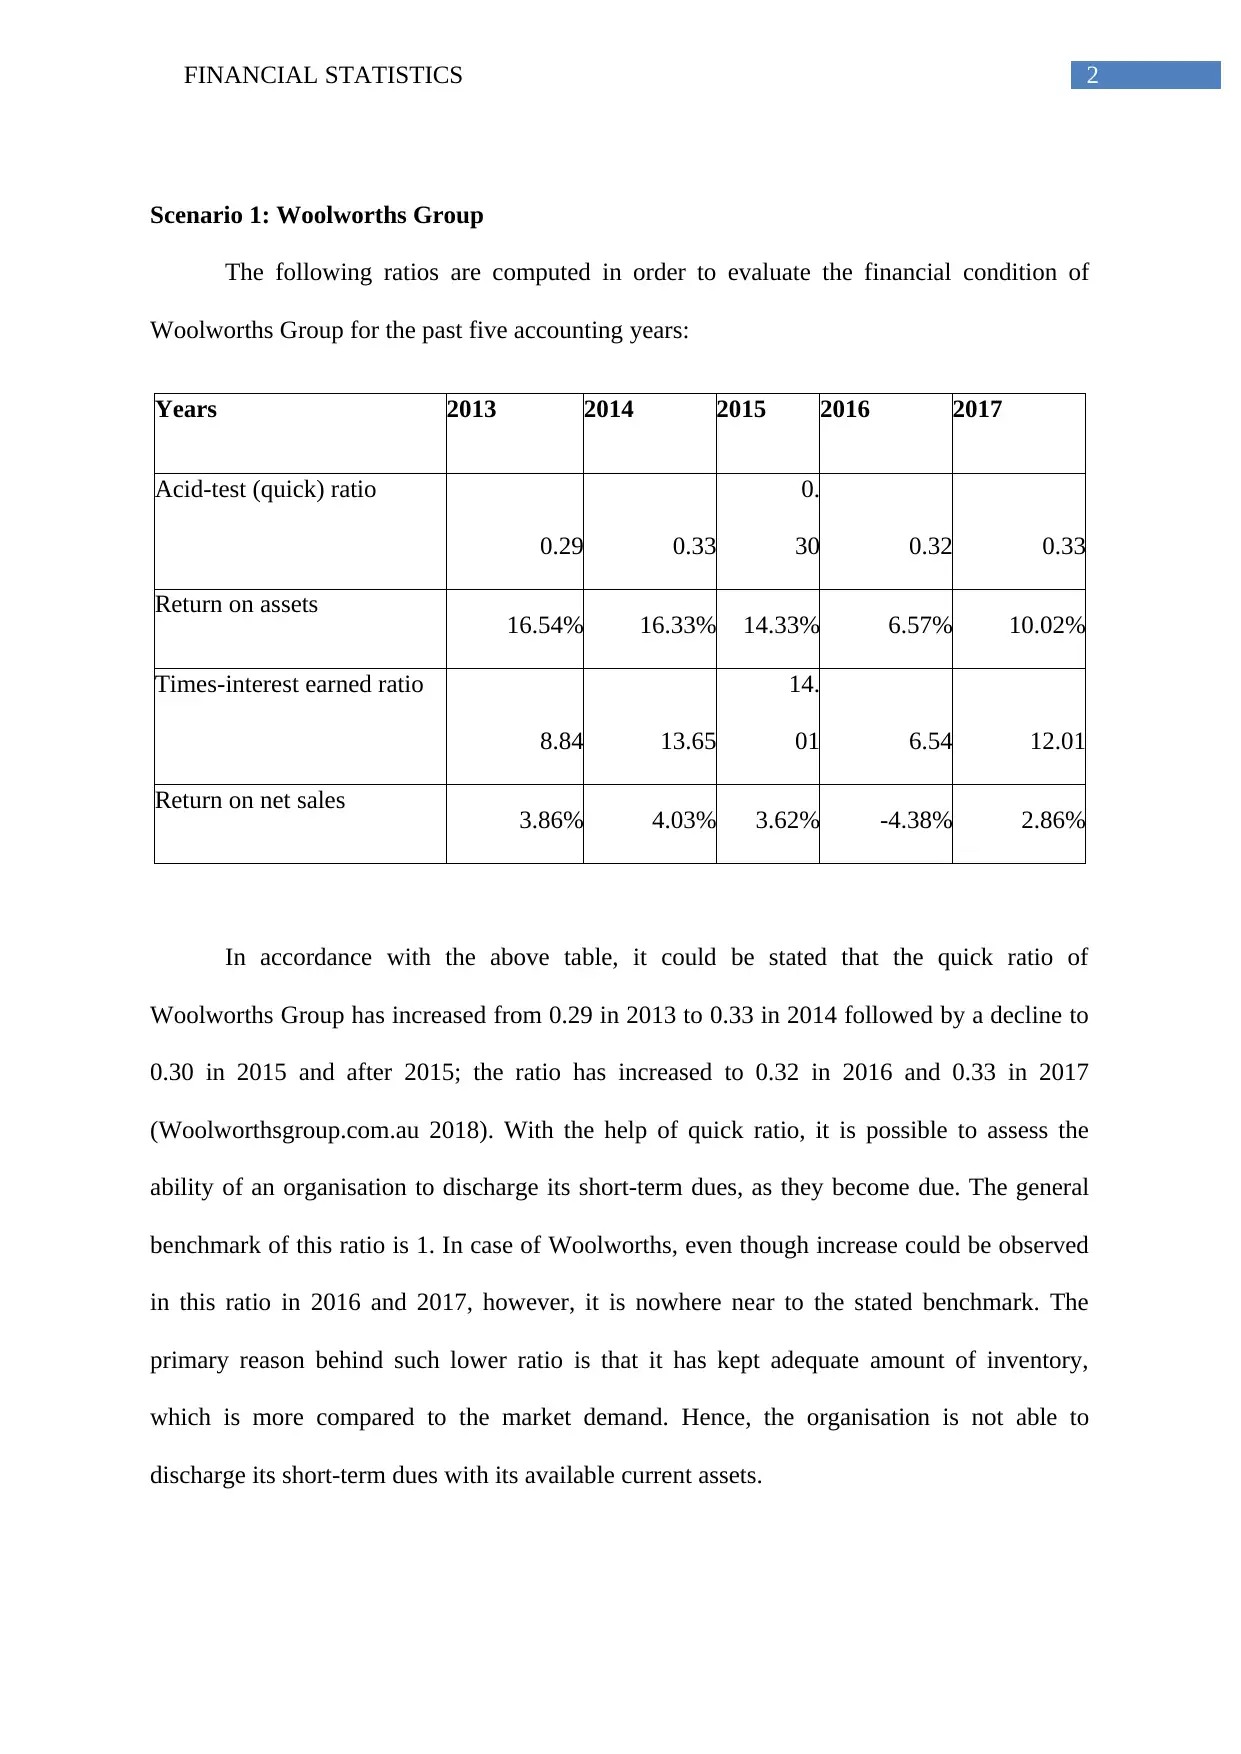
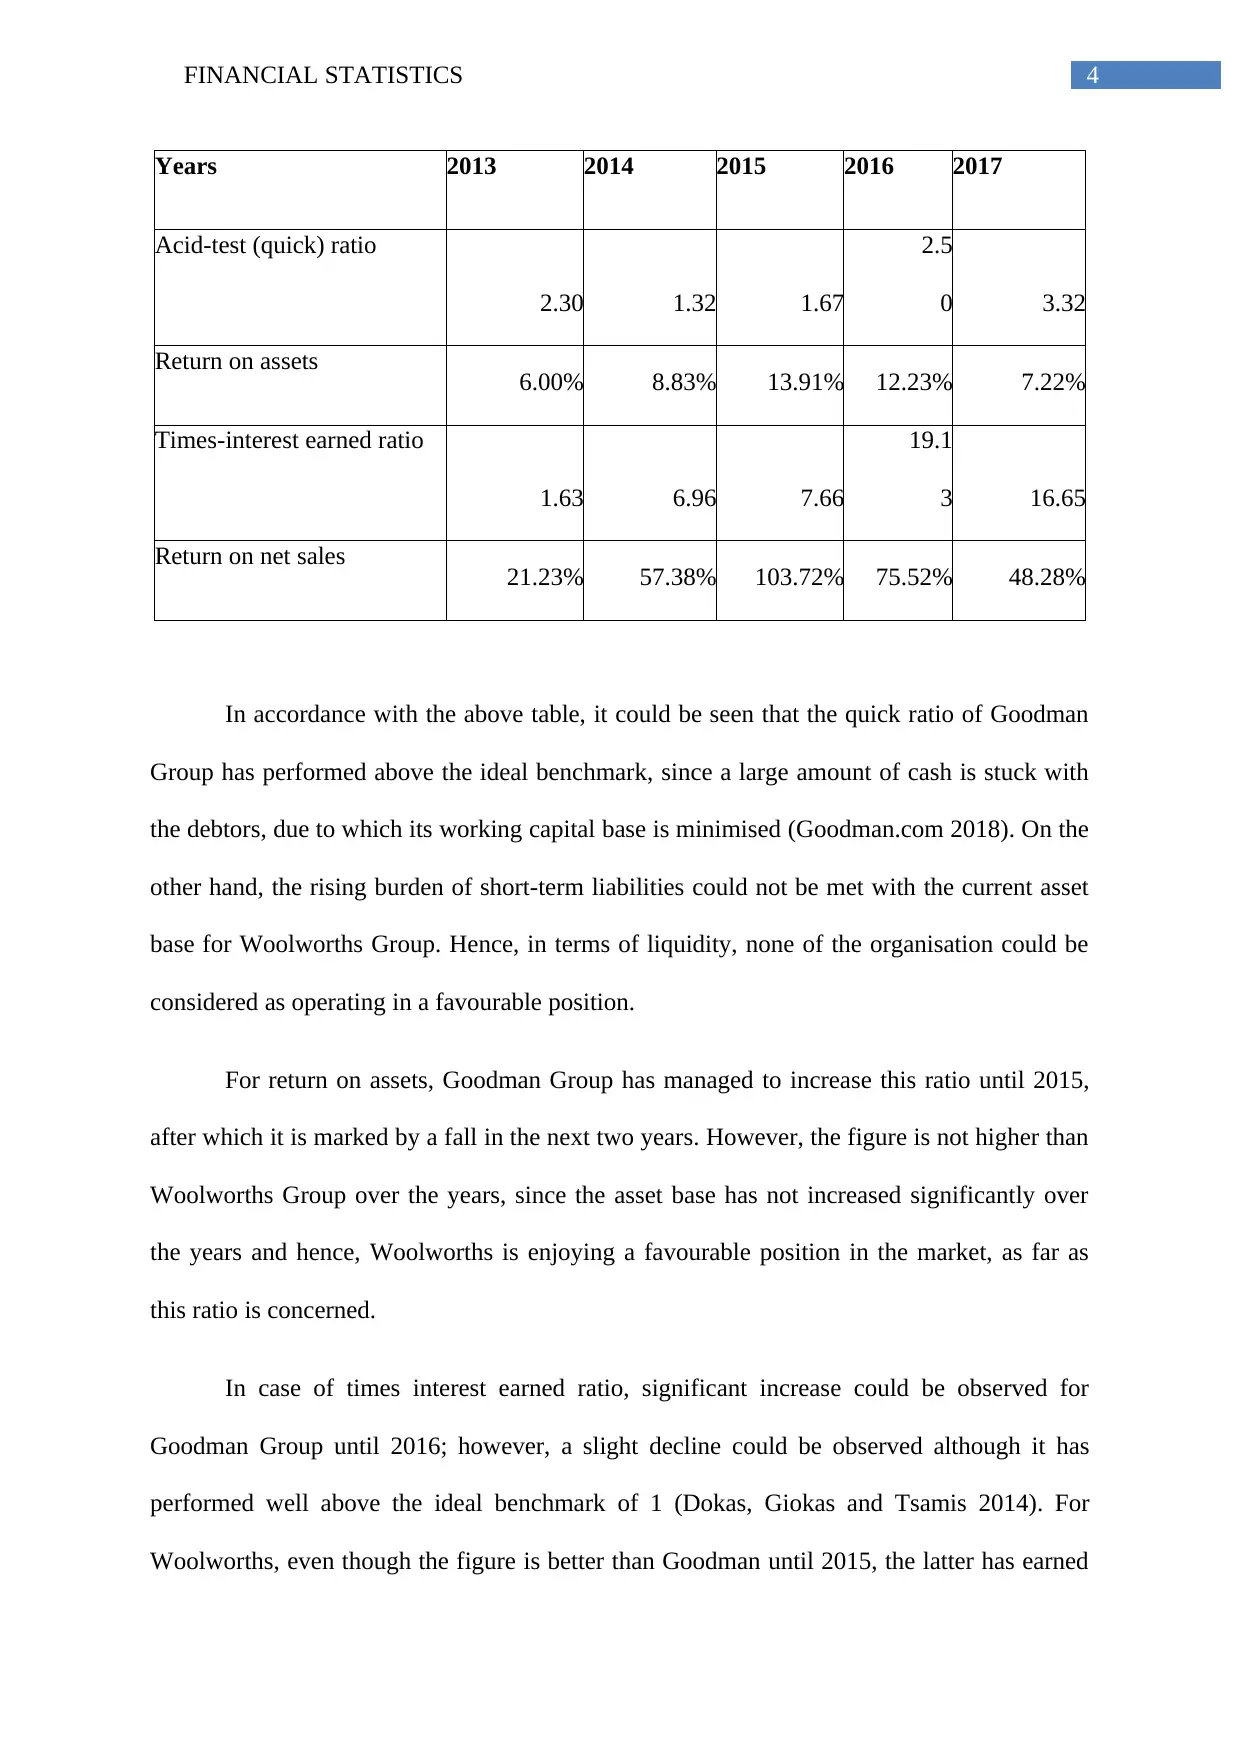
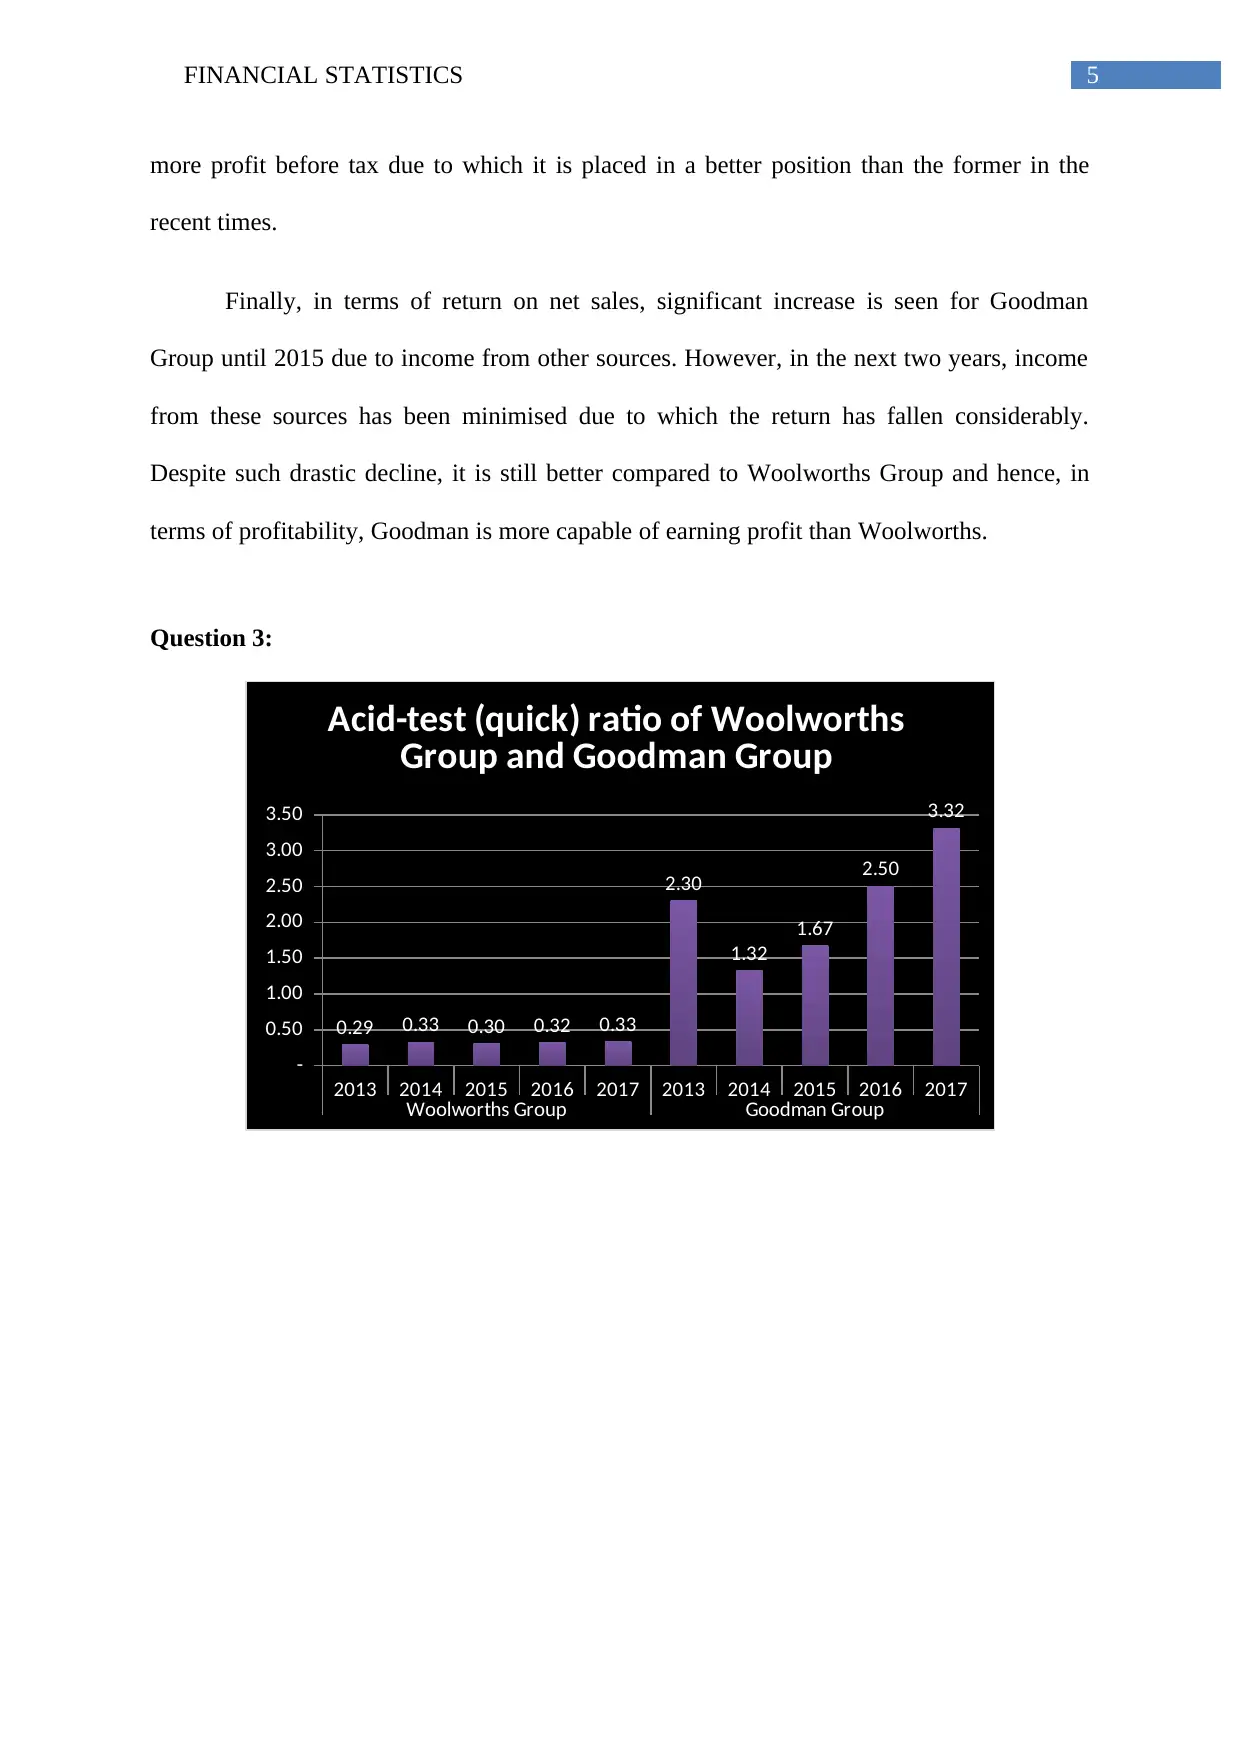
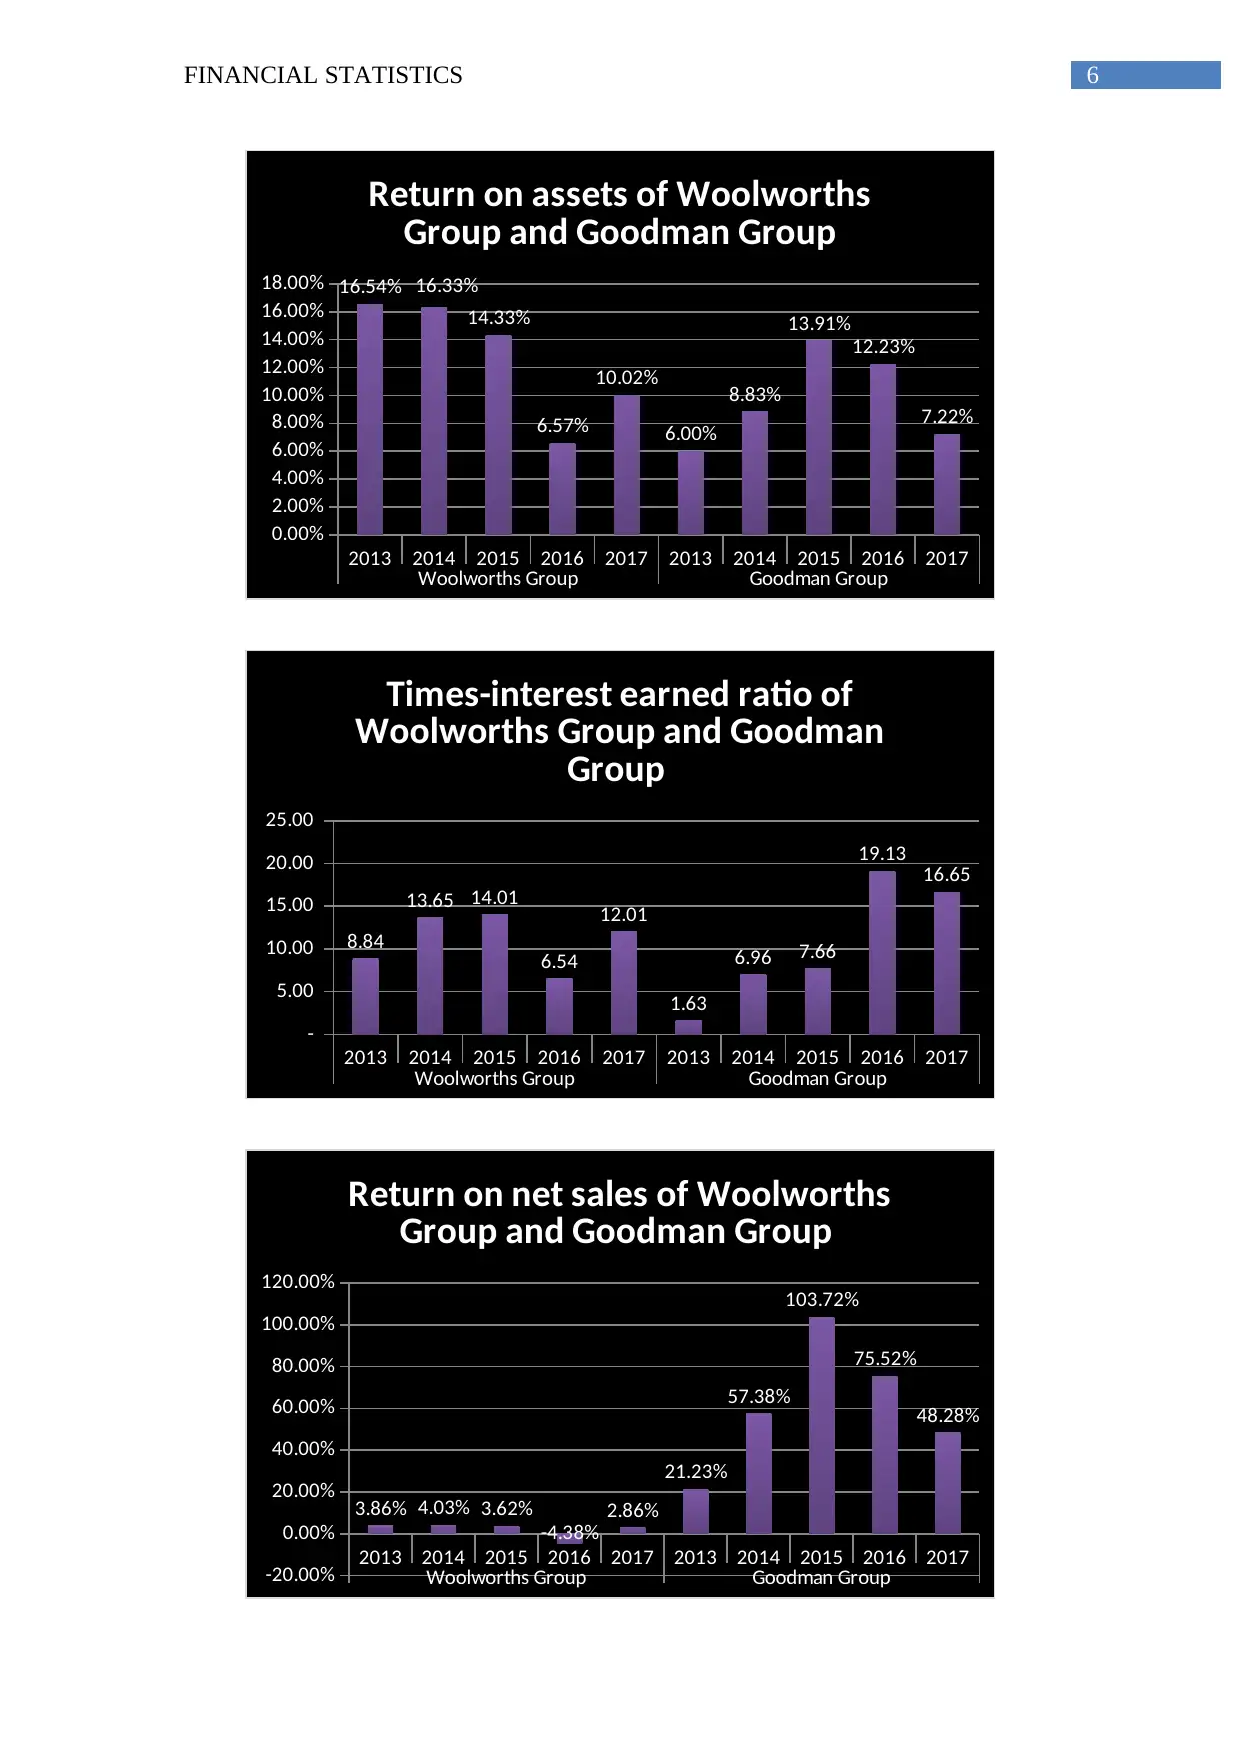
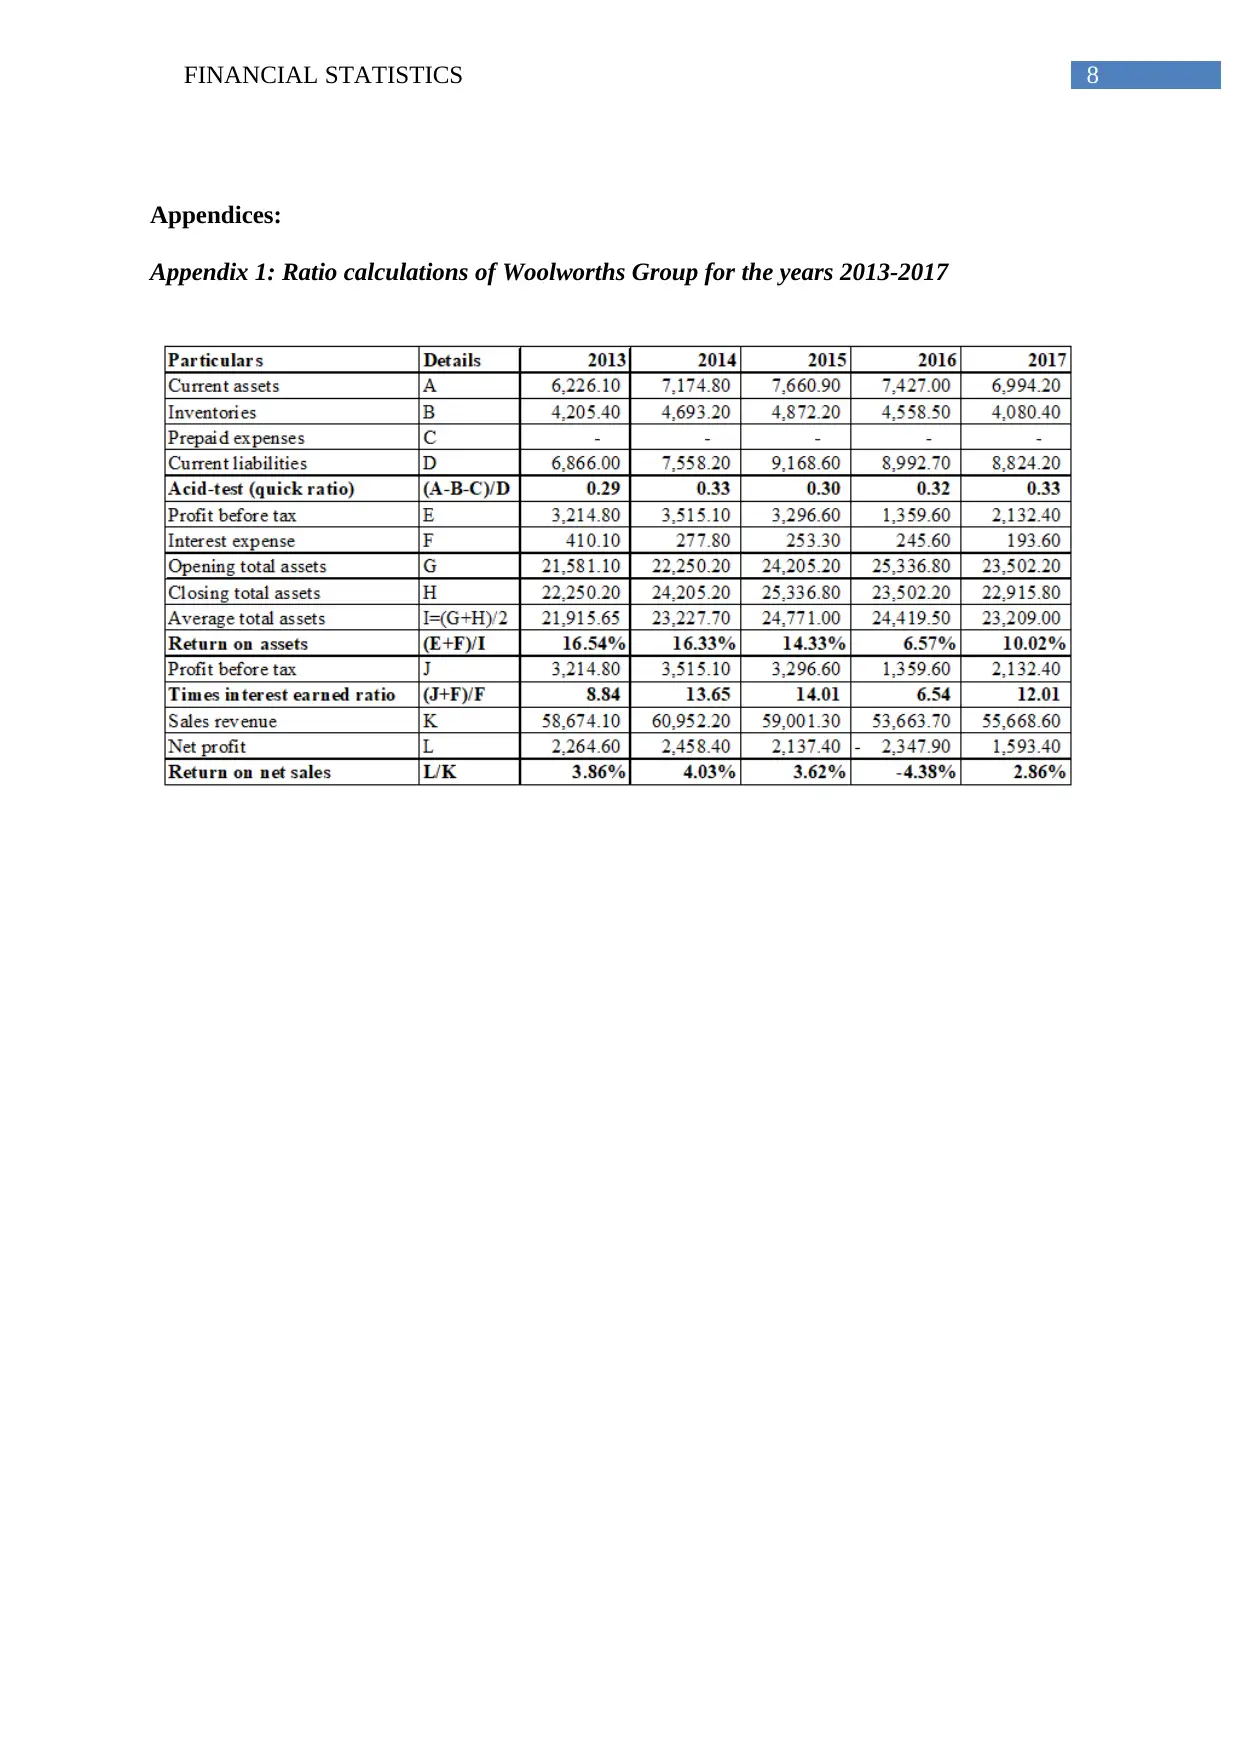
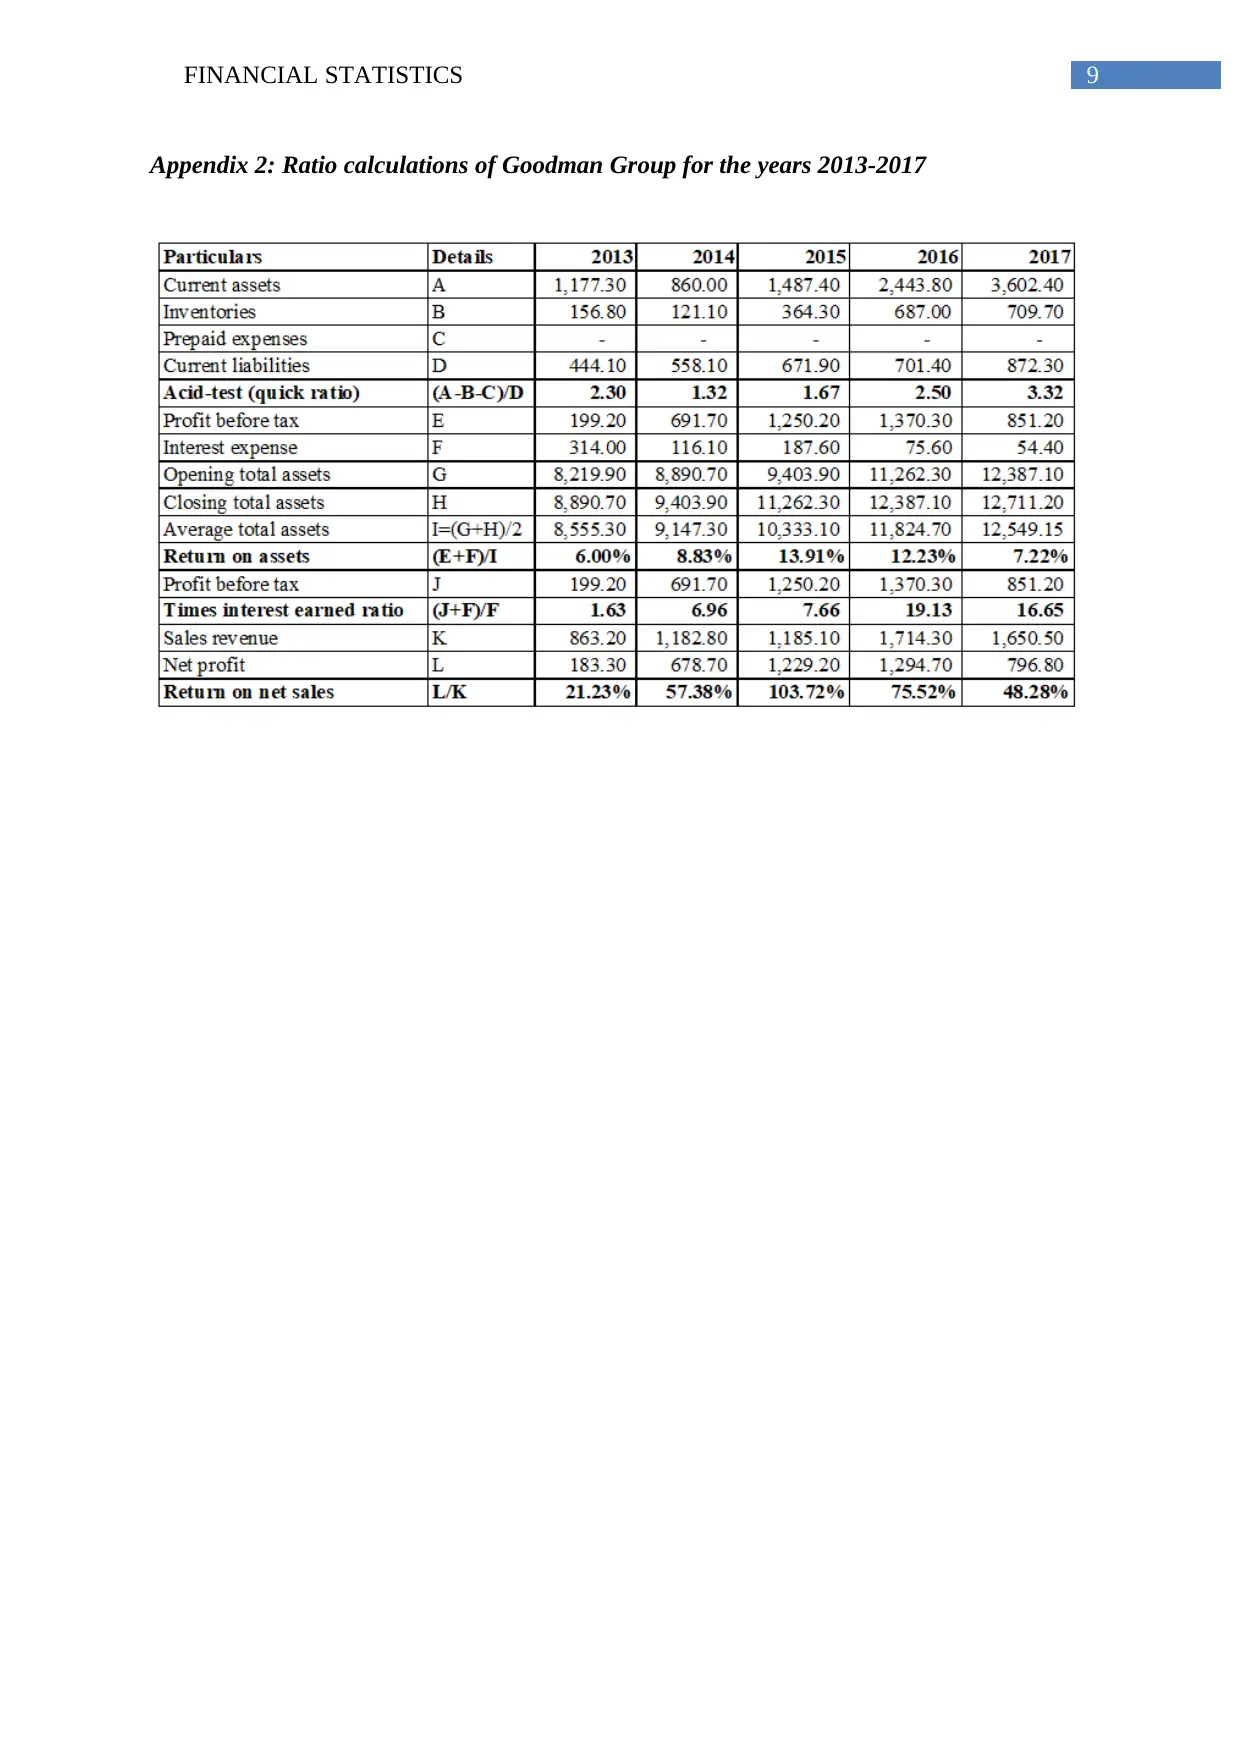
This report presents a financial analysis of Woolworths Group, evaluating its performance from 2013 to 2017 using key financial ratios. The analysis includes the quick ratio, return on assets, times interest earned ratio, and return on net sales. The report examines the trends in each ratio over the five-year period, assessing whether the company's performance is improving or worsening. The quick ratio indicates an increasing trend, though remaining below the benchmark. Return on assets initially declined but improved in later years. The times-interest-earned ratio fluctuated but generally remained above the ideal standard. Return on net sales showed fluctuations, including a negative value in 2016, with improvement in 2017. The report attributes these trends to factors like inventory management, profitability, and market demand. Furthermore, the report compares Woolworths' performance with Goodman Group, highlighting differences in liquidity, profitability, and solvency based on the calculated ratios. Graphs are used to visually compare the performance of both companies.
Document Page
Running head: FINANCIAL STATISTICS
Financial Statistics
Name of the Student:
Name of the University:
Author’s Note:
Course ID:
tabler-icon-diamond-filled.svg

Secure Best Marks with AI Grader

Need help grading? Try our AI Grader for instant feedback on your assignments.
Document Page
1FINANCIAL STATISTICS
Table of Contents
Scenario 1: Woolworths Group..................................................................................................2
Question 2: Goodman Group.....................................................................................................3
Question 3:.................................................................................................................................5
References:.................................................................................................................................7
Appendices:................................................................................................................................8
Document Page
2FINANCIAL STATISTICS
Scenario 1: Woolworths Group
The following ratios are computed in order to evaluate the financial condition of
Woolworths Group for the past five accounting years:
Years 2013 2014 2015 2016 2017
Acid-test (quick) ratio
0.29 0.33
0.
30 0.32 0.33
Return on assets 16.54% 16.33% 14.33% 6.57% 10.02%
Times-interest earned ratio
8.84 13.65
14.
01 6.54 12.01
Return on net sales 3.86% 4.03% 3.62% -4.38% 2.86%
In accordance with the above table, it could be stated that the quick ratio of
Woolworths Group has increased from 0.29 in 2013 to 0.33 in 2014 followed by a decline to
0.30 in 2015 and after 2015; the ratio has increased to 0.32 in 2016 and 0.33 in 2017
(Woolworthsgroup.com.au 2018). With the help of quick ratio, it is possible to assess the
ability of an organisation to discharge its short-term dues, as they become due. The general
benchmark of this ratio is 1. In case of Woolworths, even though increase could be observed
in this ratio in 2016 and 2017, however, it is nowhere near to the stated benchmark. The
primary reason behind such lower ratio is that it has kept adequate amount of inventory,
which is more compared to the market demand. Hence, the organisation is not able to
discharge its short-term dues with its available current assets.
Document Page
3FINANCIAL STATISTICS
In the words of Alo, Akosile and Ayoola (2016), return on assets gauges the
profitability of an organisation in utilising its asset base and a higher percentage is always
favourable. In case of Woolworths, the ratio has been observed to decline from 16.54% in
2013 to 6.57% in 2016; however, it has increased to 10.02% in 2017. This is because the
profit before income tax of the organisation has fallen significantly until 2016, despite the
fact that the average asset base of the organisation has increased over the years. Thus, after a
certain period of declining profit before tax, the organisation has generated additional profit
by utilising its asset base effectively.
As commented by Brigham et al. (2016), times interest earned ratio gauges the
number of times profit could cover finance cost. A higher figure is always desirable for an
organisation, since it denotes better financial condition of the concern. For Woolworths, the
ratio has increased from 8.84 in 2013 to 14.01 in 2015; however, it has fallen to 6.54 in 2016
and rise is inherent to 12.01 in 2017. A ratio above 1 is considered ideal for any business
organisation. The ratio is well above the ideal standard and hence, it denotes better solvency
position for Woolworths Group.
Finally, the return on net sales for Woolworths Group has fluctuated from 2013 to
2015 and in 2016; it has been negative, which has improved significantly in 2017. The falling
market demand could be attributed to the fall in return on net sales along with the aggressive
pricing strategy. However, it has minimised its stock level in 2017 due to which lower cost is
incurred for purchasing raw materials.
Question 2: Goodman Group
The following ratios are computed in order to evaluate the financial condition of
Woolworths Group by comparing with Goodman Group belonging to another industry for the
past five accounting years
tabler-icon-diamond-filled.svg

Secure Best Marks with AI Grader

Need help grading? Try our AI Grader for instant feedback on your assignments.
Document Page
4FINANCIAL STATISTICS
Years 2013 2014 2015 2016 2017
Acid-test (quick) ratio
2.30 1.32 1.67
2.5
0 3.32
Return on assets 6.00% 8.83% 13.91% 12.23% 7.22%
Times-interest earned ratio
1.63 6.96 7.66
19.1
3 16.65
Return on net sales 21.23% 57.38% 103.72% 75.52% 48.28%
In accordance with the above table, it could be seen that the quick ratio of Goodman
Group has performed above the ideal benchmark, since a large amount of cash is stuck with
the debtors, due to which its working capital base is minimised (Goodman.com 2018). On the
other hand, the rising burden of short-term liabilities could not be met with the current asset
base for Woolworths Group. Hence, in terms of liquidity, none of the organisation could be
considered as operating in a favourable position.
For return on assets, Goodman Group has managed to increase this ratio until 2015,
after which it is marked by a fall in the next two years. However, the figure is not higher than
Woolworths Group over the years, since the asset base has not increased significantly over
the years and hence, Woolworths is enjoying a favourable position in the market, as far as
this ratio is concerned.
In case of times interest earned ratio, significant increase could be observed for
Goodman Group until 2016; however, a slight decline could be observed although it has
performed well above the ideal benchmark of 1 (Dokas, Giokas and Tsamis 2014). For
Woolworths, even though the figure is better than Goodman until 2015, the latter has earned
Document Page
5FINANCIAL STATISTICS
more profit before tax due to which it is placed in a better position than the former in the
recent times.
Finally, in terms of return on net sales, significant increase is seen for Goodman
Group until 2015 due to income from other sources. However, in the next two years, income
from these sources has been minimised due to which the return has fallen considerably.
Despite such drastic decline, it is still better compared to Woolworths Group and hence, in
terms of profitability, Goodman is more capable of earning profit than Woolworths.
Question 3:
2013 2014 2015 2016 2017 2013 2014 2015 2016 2017
Woolworths Group Goodman Group
-
0.50
1.00
1.50
2.00
2.50
3.00
3.50
0.29 0.33 0.30 0.32 0.33
2.30
1.32
1.67
2.50
3.32
Acid-test (quick) ratio of Woolworths
Group and Goodman Group
Document Page
6FINANCIAL STATISTICS
2013 2014 2015 2016 2017 2013 2014 2015 2016 2017
Woolworths Group Goodman Group
0.00%
2.00%
4.00%
6.00%
8.00%
10.00%
12.00%
14.00%
16.00%
18.00% 16.54% 16.33%
14.33%
6.57%
10.02%
6.00%
8.83%
13.91%
12.23%
7.22%
Return on assets of Woolworths
Group and Goodman Group
2013 2014 2015 2016 2017 2013 2014 2015 2016 2017
Woolworths Group Goodman Group
-
5.00
10.00
15.00
20.00
25.00
8.84
13.65 14.01
6.54
12.01
1.63
6.96 7.66
19.13
16.65
Times-interest earned ratio of
Woolworths Group and Goodman
Group
2013 2014 2015 2016 2017 2013 2014 2015 2016 2017
Woolworths Group Goodman Group-20.00%
0.00%
20.00%
40.00%
60.00%
80.00%
100.00%
120.00%
3.86% 4.03% 3.62%
-4.38%
2.86%
21.23%
57.38%
103.72%
75.52%
48.28%
Return on net sales of Woolworths
Group and Goodman Group
tabler-icon-diamond-filled.svg

Paraphrase This Document

Need a fresh take? Get an instant paraphrase of this document with our AI Paraphraser
Document Page
7FINANCIAL STATISTICS
References:
Alo, E.A., Akosile, A.I. and Ayoola, A.O., 2016. The Statistical Evaluation of the
Performance of Financial Ratio Analysis in Nigerian Manufacturing Industry: An Empirical
Study of Guinness Nigeria PLC. The International Journal of Business & Management, 4(1),
p.295.
Brigham, E.F., Ehrhardt, M.C., Nason, R.R. and Gessaroli, J., 2016. Financial Managment:
Theory And Practice, Canadian Edition. Nelson Education.
Dokas, I., Giokas, D. and Tsamis, A., 2014. Liquidity efficiency in the Greek listed firms: a
financial ratio based on data envelopment analysis. International Journal of Corporate
Finance and Accounting (IJCFA), 1(1), pp.40-59.
Evans, J.R. and Mathur, A., 2014. Retailing and the period leading up to the Great Recession:
a model and a 25-year financial ratio analysis of US retailing. The International Review of
Retail, Distribution and Consumer Research, 24(1), pp.30-58.
Goodman.com., 2018. Annual reports | Goodman. [online] Available at:
https://www.goodman.com/investor-centre/goodman-group-australia/annual-reports
[Accessed 24 Jun. 2018].
Woolworthsgroup.com.au., 2018. Annual Reports - Woolworths Group. [online] Available at:
https://www.woolworthsgroup.com.au/page/investors/our-performance/reports/Reports/
Annual_Reports [Accessed 24 Jun. 2018].
Document Page
8FINANCIAL STATISTICS
Appendices:
Appendix 1: Ratio calculations of Woolworths Group for the years 2013-2017
Document Page
9FINANCIAL STATISTICS
Appendix 2: Ratio calculations of Goodman Group for the years 2013-2017
chevron_up_icon
1 out of 10
circle_padding
hide_on_mobile
zoom_out_icon
[object Object]