FIN5FSA: Financial Statement Analysis of Woolworths Limited Report
VerifiedAdded on 2023/06/03
|20
|5600
|75
Report
AI Summary
This report provides a comprehensive financial analysis of Woolworths Limited, a major Australian supermarket chain, covering a six-year period. The analysis includes horizontal and common size analysis of the income statement, balance sheet, and cash flow statement. Key areas of evaluation encompass cash flow analysis, liquidity analysis, income analysis, capital structure analysis, and growth and risk analysis. The report examines trends in revenue, profitability, and key financial ratios, providing insights into the company's financial health and performance. The analysis reveals insights into the company's financial performance, including discussions on PPE and intangible assets, sales, and net profit. The report concludes with recommendations for investors, assessing the company's overall financial stability and growth potential. Data was extracted from Data Analysis Premium, and the analysis follows the guidelines of FIN5FSA at La Trobe University.
RUNNING HEAD: FINANCIAL STATEMENT ANALYSIS
FINANCIAL STATEMENT ANALYSIS
FINANCIAL STATEMENT ANALYSIS
Paraphrase This Document
Need a fresh take? Get an instant paraphrase of this document with our AI Paraphraser
FINANCIAL STATEMENT ANALYSIS 1
Contents
WOOLWORTHS LIMITED........................................................................................................................2
INTRODUCTION.................................................................................................................................2
BACKGROUND...................................................................................................................................2
COMMON SIZE AND HORIZONTAL ANALYSIS....................................................................................3
CASH FLOW ANALYSIS.....................................................................................................................11
LIQUIDITY ANALYSIS........................................................................................................................12
INCOME ANALYSIS...........................................................................................................................13
CAPITAL STRUCTURE ANALYSIS.......................................................................................................15
COVERAGE ANALYSIS.......................................................................................................................16
GROWTH AND RISK ANALYSIS.........................................................................................................16
CONCLUSIONS.................................................................................................................................17
REFERENCES....................................................................................................................................19
FINANCIAL STATEMENT ANALYSIS 2
WOOLWORTHS LIMITED
INTRODUCTION
In this assignment operating and financial health of Woolworths Limited is analysed
which is registered in Australian stock market. The chosen company Woolworths limited of
Australia covered under Supermarket or Grocery Store Chain. The financial performance is
evaluated and assessed considering latest last six years. The data required for the analysis is
extracted from the Data Analysis Premium. This assignment covers background and mission
of the company and the assessment of the financial health is based on common size and
horizontal analysis, cash flow analysis, liquidity analysis, income analysis, capital structure
analysis, key coverage ratios and growth and risk analysis and on the basis of mentioned
criteria conclusions are drawn that the Woolworths limited are fundamentally better company
and it is advised to existing investors should continue to hold the stock and prospective
investors should consider buying the stock.
BACKGROUND
The Woolworths Limited was opened in the year 1924 in Sydney’s Imperial Arcade.
The company covered under Food and staples Retailing industry. It is one of the largest
company in terms of broad retail interest across New Zealand and Australia. It was
approximately more than 92 years of existence and around 20 years of being listed in
Australian market. Its stock ticker is WOW (Woolsworth Limited, 2018). The company
mostly specialises in grocery products such as vegetables, fruits, packaged foods etc. also
deals in selling magazines, health and household products, pet supplies, stationery items etc.
Further the company is also a largest retailer of liquor. In addition to above, company also
owns petrol divisions and also offers financial services in terms of credit cards, gift cards etc.
The company has approximately 1000 stores through Australia with nearly 202000
workforces. The Woolworths Limited works with an objective of serve exceptional services
and products to the customers and also deliver shareholders better value. The main highlight
⊘ This is a preview!⊘
Do you want full access?
Subscribe today to unlock all pages.
Trusted by 1+ million students worldwide
FINANCIAL STATEMENT ANALYSIS 3
of Woolworths group in 2017 financial year was an enhancement in customer scores in
Australian food which has resulted in transactions force all over the year. Woolworths
Limited created the culture that cheers expansion, image and reward boldness.
MISSION
There are five main aims and objectives of the company (Woolsworth Limited, 2018):
Building Customer’s value by providing best class shopping experience.
Empowering portfolio business to maximise shareholders return.
Another objective is to become a lean retailer through system excellence.
To develop solid brand with the family-friendly culture.
Better services only with reduced costs and changed values.
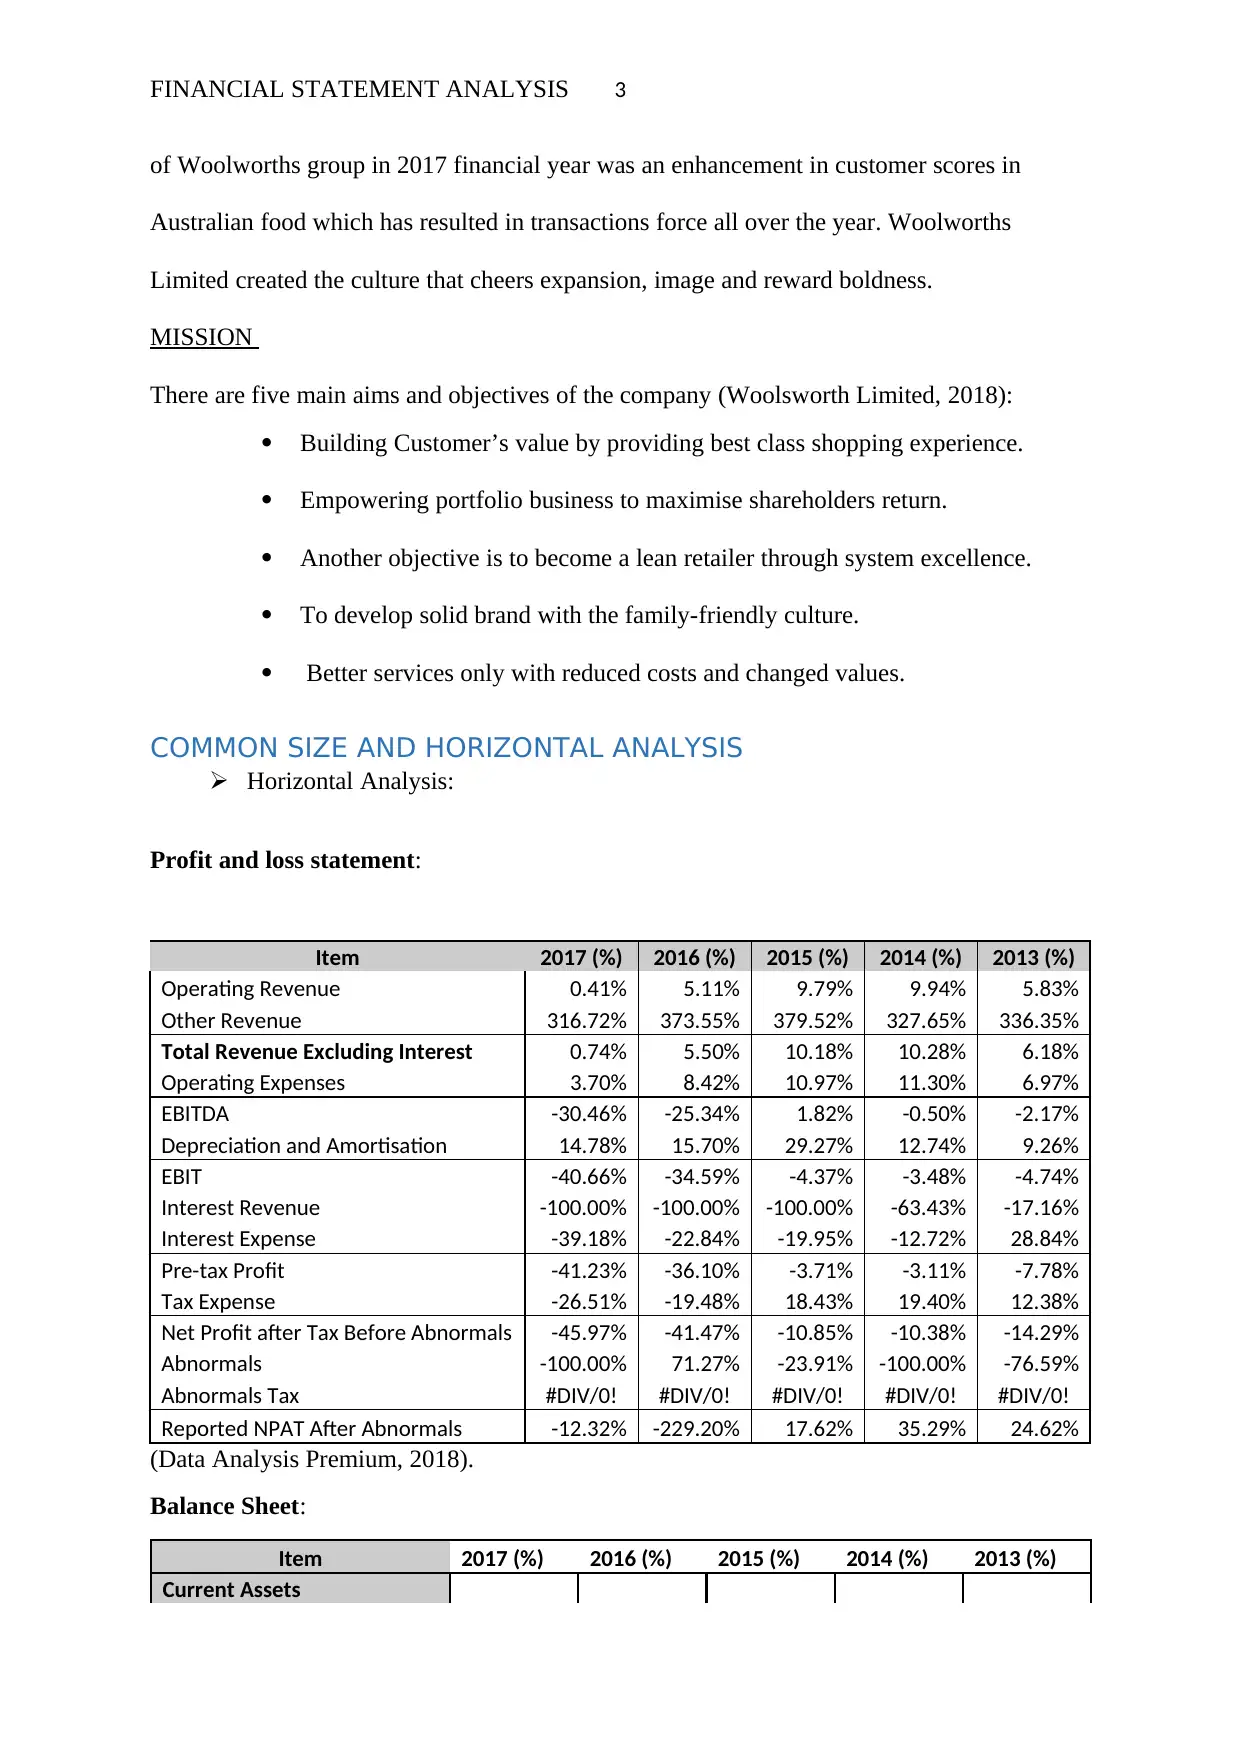
COMMON SIZE AND HORIZONTAL ANALYSIS
Horizontal Analysis:
Profit and loss statement:
Item 2017 (%) 2016 (%) 2015 (%) 2014 (%) 2013 (%)
Operating Revenue 0.41% 5.11% 9.79% 9.94% 5.83%
Other Revenue 316.72% 373.55% 379.52% 327.65% 336.35%
Total Revenue Excluding Interest 0.74% 5.50% 10.18% 10.28% 6.18%
Operating Expenses 3.70% 8.42% 10.97% 11.30% 6.97%
EBITDA -30.46% -25.34% 1.82% -0.50% -2.17%
Depreciation and Amortisation 14.78% 15.70% 29.27% 12.74% 9.26%
EBIT -40.66% -34.59% -4.37% -3.48% -4.74%
Interest Revenue -100.00% -100.00% -100.00% -63.43% -17.16%
Interest Expense -39.18% -22.84% -19.95% -12.72% 28.84%
Pre-tax Profit -41.23% -36.10% -3.71% -3.11% -7.78%
Tax Expense -26.51% -19.48% 18.43% 19.40% 12.38%
Net Profit after Tax Before Abnormals -45.97% -41.47% -10.85% -10.38% -14.29%
Abnormals -100.00% 71.27% -23.91% -100.00% -76.59%
Abnormals Tax #DIV/0! #DIV/0! #DIV/0! #DIV/0! #DIV/0!
Reported NPAT After Abnormals -12.32% -229.20% 17.62% 35.29% 24.62%
(Data Analysis Premium, 2018).
Balance Sheet:
Item 2017 (%) 2016 (%) 2015 (%) 2014 (%) 2013 (%)
Current Assets
of Woolworths group in 2017 financial year was an enhancement in customer scores in
Australian food which has resulted in transactions force all over the year. Woolworths
Limited created the culture that cheers expansion, image and reward boldness.
MISSION
There are five main aims and objectives of the company (Woolsworth Limited, 2018):
Building Customer’s value by providing best class shopping experience.
Empowering portfolio business to maximise shareholders return.
Another objective is to become a lean retailer through system excellence.
To develop solid brand with the family-friendly culture.
Better services only with reduced costs and changed values.
COMMON SIZE AND HORIZONTAL ANALYSIS
Horizontal Analysis:
Profit and loss statement:
Item 2017 (%) 2016 (%) 2015 (%) 2014 (%) 2013 (%)
Operating Revenue 0.41% 5.11% 9.79% 9.94% 5.83%
Other Revenue 316.72% 373.55% 379.52% 327.65% 336.35%
Total Revenue Excluding Interest 0.74% 5.50% 10.18% 10.28% 6.18%
Operating Expenses 3.70% 8.42% 10.97% 11.30% 6.97%
EBITDA -30.46% -25.34% 1.82% -0.50% -2.17%
Depreciation and Amortisation 14.78% 15.70% 29.27% 12.74% 9.26%
EBIT -40.66% -34.59% -4.37% -3.48% -4.74%
Interest Revenue -100.00% -100.00% -100.00% -63.43% -17.16%
Interest Expense -39.18% -22.84% -19.95% -12.72% 28.84%
Pre-tax Profit -41.23% -36.10% -3.71% -3.11% -7.78%
Tax Expense -26.51% -19.48% 18.43% 19.40% 12.38%
Net Profit after Tax Before Abnormals -45.97% -41.47% -10.85% -10.38% -14.29%
Abnormals -100.00% 71.27% -23.91% -100.00% -76.59%
Abnormals Tax #DIV/0! #DIV/0! #DIV/0! #DIV/0! #DIV/0!
Reported NPAT After Abnormals -12.32% -229.20% 17.62% 35.29% 24.62%
(Data Analysis Premium, 2018).
Balance Sheet:
Item 2017 (%) 2016 (%) 2015 (%) 2014 (%) 2013 (%)
Current Assets
Paraphrase This Document
Need a fresh take? Get an instant paraphrase of this document with our AI Paraphraser
FINANCIAL STATEMENT ANALYSIS 4
Cash 9.12% 13.76% 60.00% 10.70% 1.90%
Receivables -31.96% -28.15% -3.20% 2.22% 15.78%
Prepaid Expenses 25.36% 23.93% 12.98% 15.90% 1.31%
Inventories 10.33% 23.26% 31.74% 26.90% 13.71%
Investments -32.35% 135.29% 692.02% -46.64% 127.73%
NCA Held Sale 230.13% 192.14% 1.30% 64.75% -60.53%
Total Current Assets 20.55% 28.01% 32.04% 23.66% 7.31%
Non-Current Assets
Receivables 194.29% 250.61% 376.33% 341.63% -32.24%
Investments 112.27% 167.25% 108.38% 27.60% 50.21%
PP&E -12.01% -13.83% 4.93% 0.12% -3.58%
Intangibles(Ex GW) 12.44% 13.63% 17.38% 19.05% 15.69%
Goodwill 30.87% 12.90% 18.76% 20.50% 5.56%
Future Tax Benefit -42.25% 72.17% 17.11% 5.75% -4.08%
Total NCA 0.90% 1.88% 12.02% 7.93% 1.55%
Total Assets 6.18% 8.90% 17.40% 12.16% 3.10%
Current liabilities
Account Payable 30.44% 22.27% 20.62% 17.21% 3.03%
Short-Term Debt 365.99% 802.02% 2924.63% 303.49% 211.40%
Provisions 47.02% 59.41% 1.88% 5.02% 0.44%
NCL Held Sale -89.70% 0.85% -100.00% -100.00% -100.00%
Other -100.00% -90.73% -57.99% -100.00% 21.00%
Total Curr. Liabilities 30.42% 32.91% 35.51% 11.71% 1.47%
Non-Current liabilities
Long-Term Debt -40.86% -17.56% -34.42% -11.91% -8.79%
Provisions 14.89% 56.16% 66.66% 75.67% -16.13%
Other -54.97% -53.02% -53.43% -62.03% 41.30%
Total NCL -33.81% -10.07% -20.92% -3.88% -4.47%
Total Liabilities -0.72% 12.07% 8.15% 4.15% -1.41%
Equity
Share Capital 31.32% 22.83% 14.81% 8.31% 1.55%
Reserves -145.32% -137.40% -137.87% -178.93% -110.00%
Retained Earnings -8.80% -24.95% 40.03% 30.26% 11.95%
Outside Equity 35.65% 20.61% 15.38% 5.73% 5.42%
Total Equity 16.93% 3.97% 31.80% 24.62% 10.11%
Total liabilities + Total Equity 6.18% 8.90% 17.40% 12.16% 3.10%
(Data Analysis Premium, 2018).
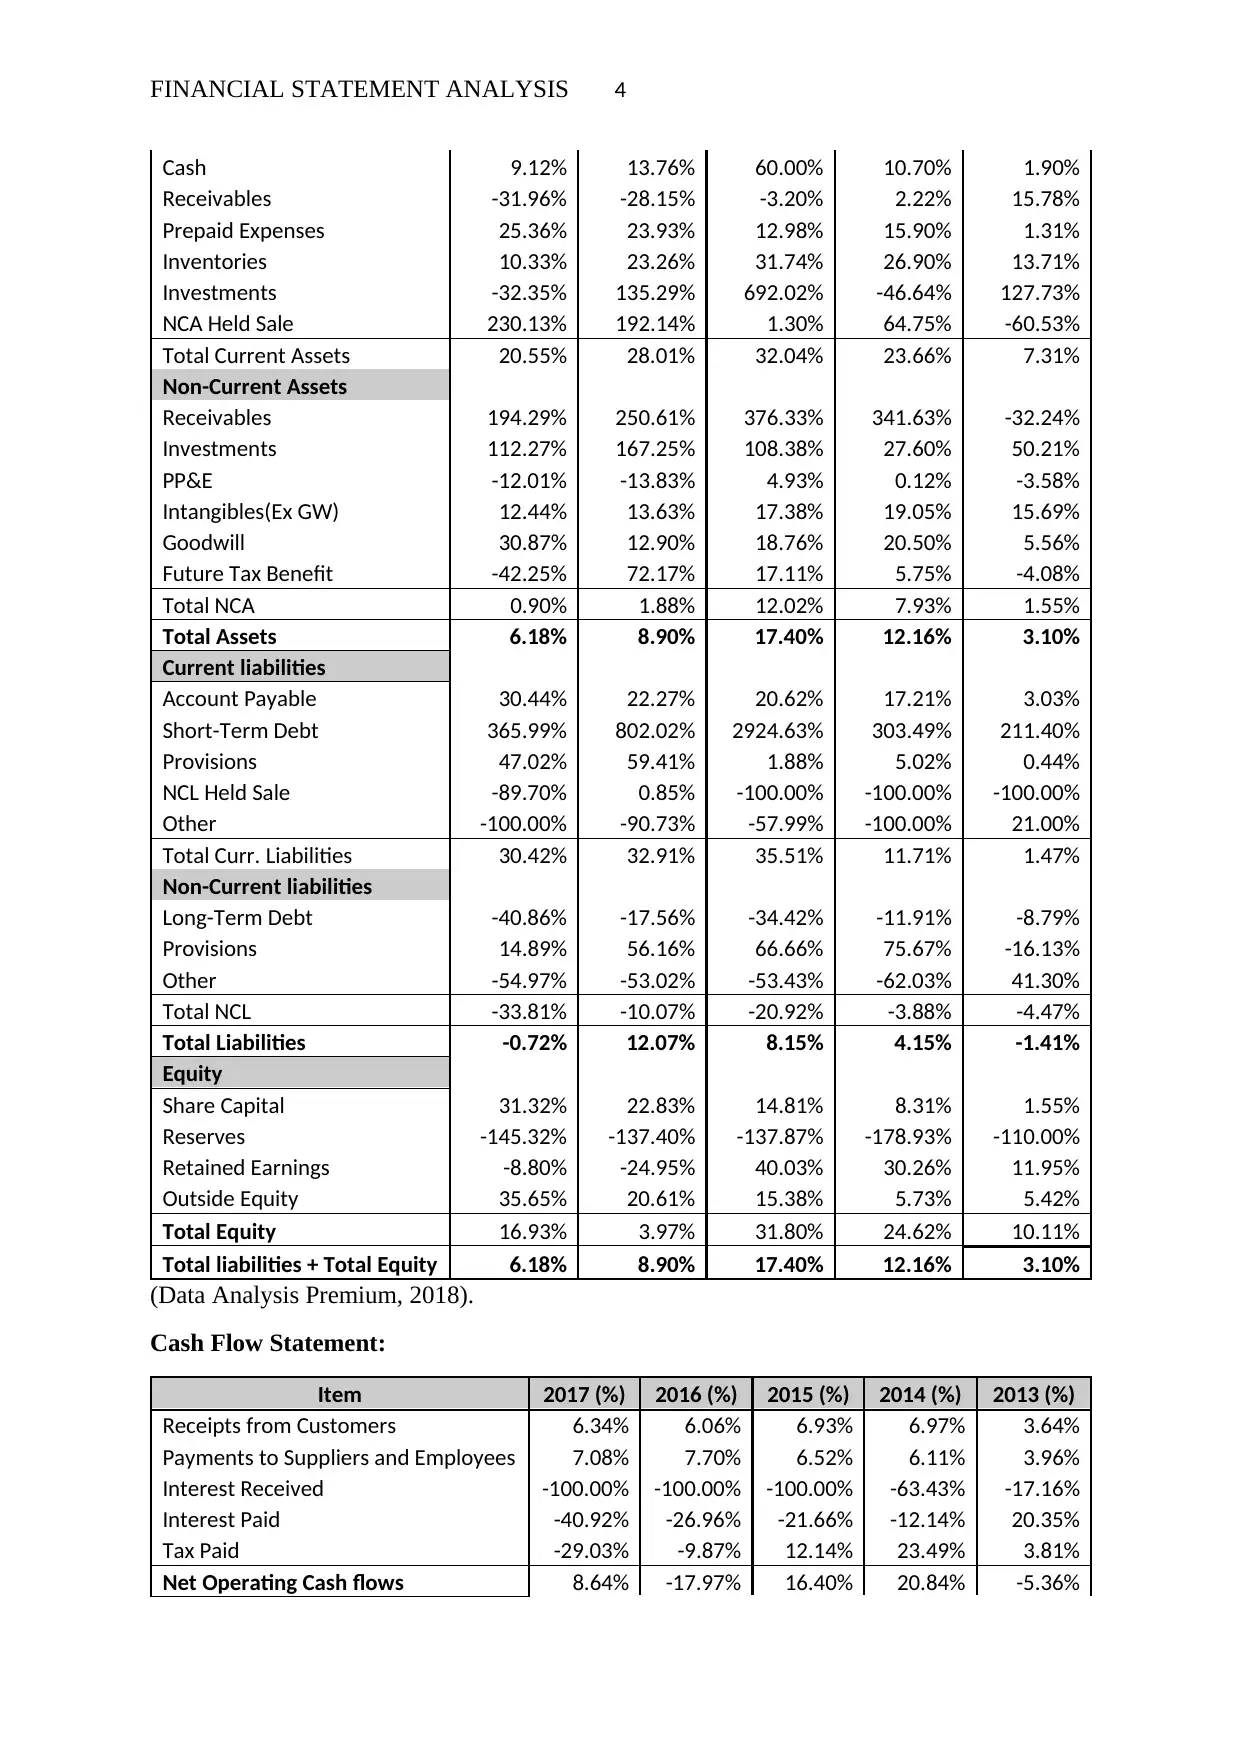
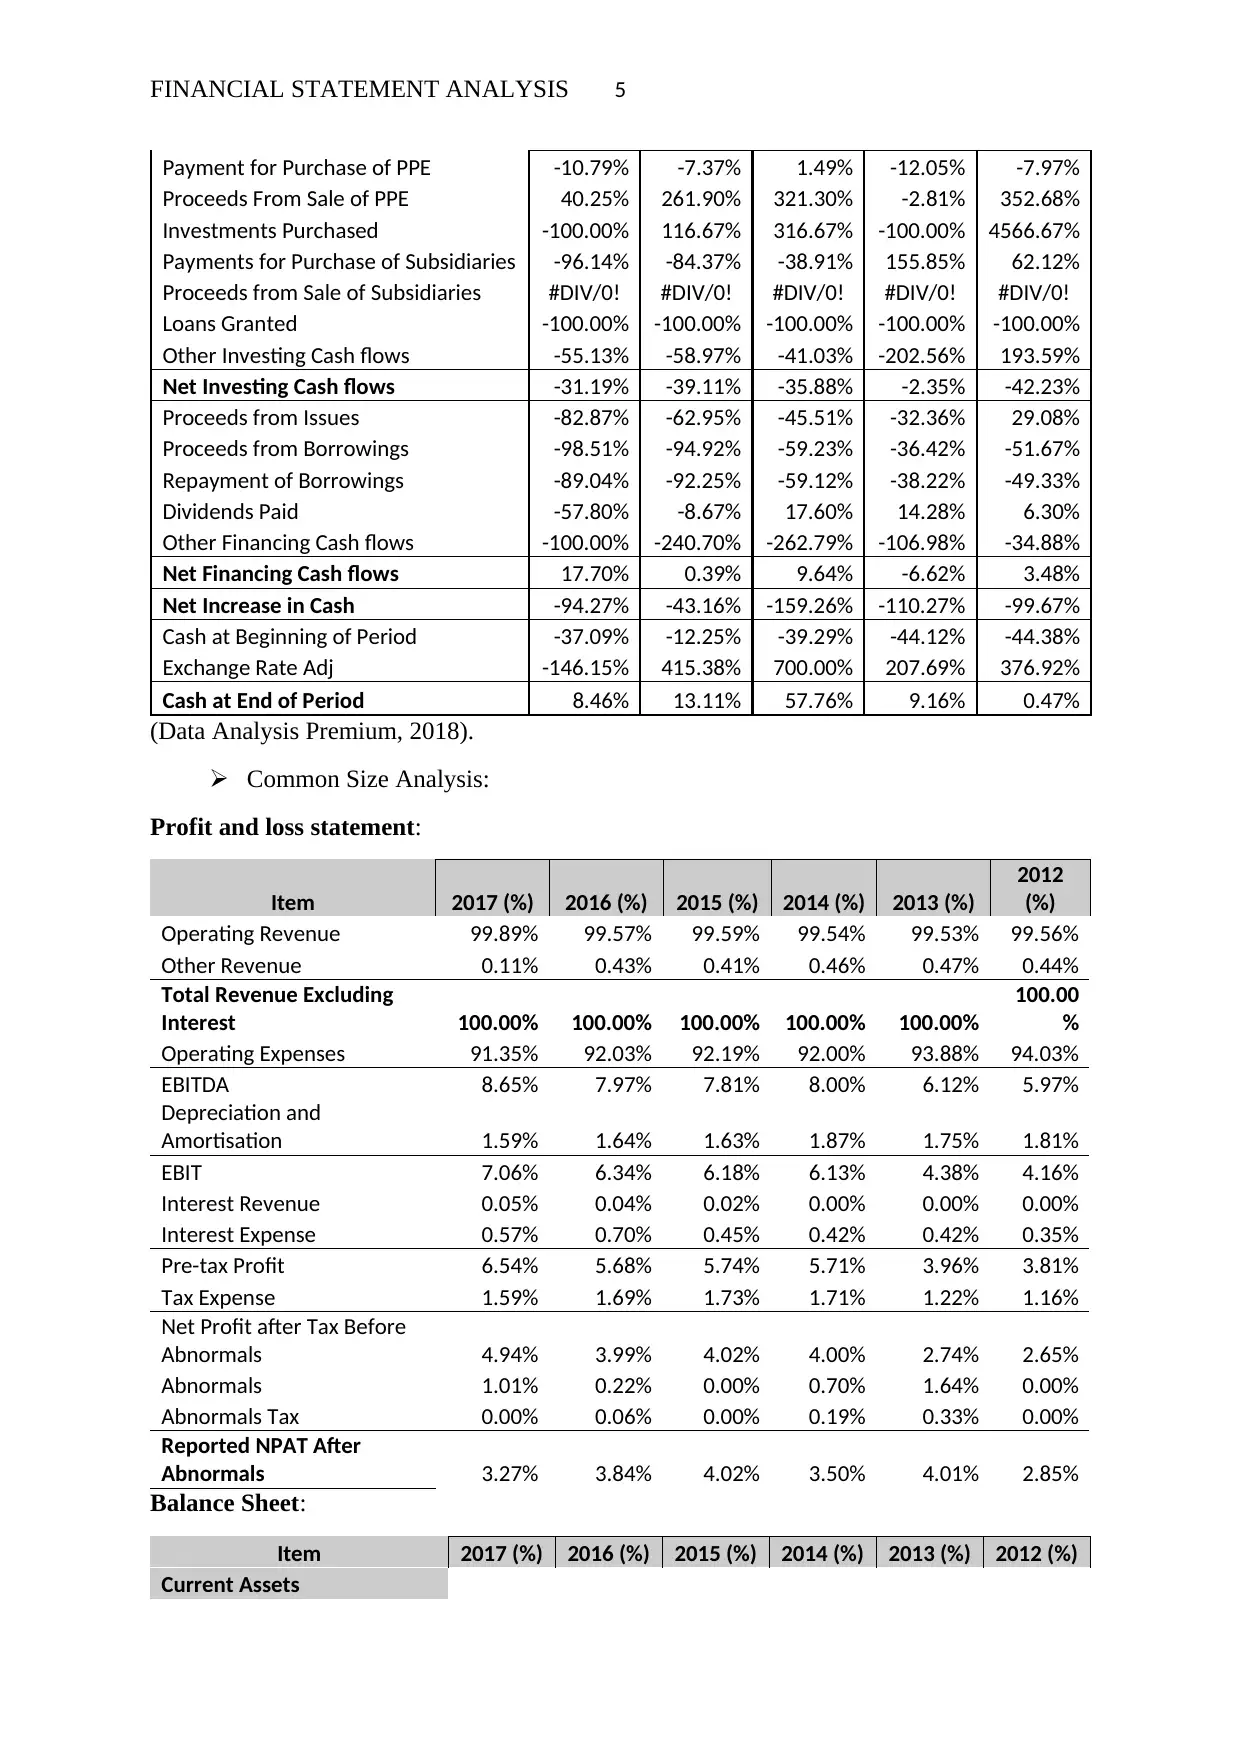
Cash Flow Statement:
Item 2017 (%) 2016 (%) 2015 (%) 2014 (%) 2013 (%)
Receipts from Customers 6.34% 6.06% 6.93% 6.97% 3.64%
Payments to Suppliers and Employees 7.08% 7.70% 6.52% 6.11% 3.96%
Interest Received -100.00% -100.00% -100.00% -63.43% -17.16%
Interest Paid -40.92% -26.96% -21.66% -12.14% 20.35%
Tax Paid -29.03% -9.87% 12.14% 23.49% 3.81%
Net Operating Cash flows 8.64% -17.97% 16.40% 20.84% -5.36%
Cash 9.12% 13.76% 60.00% 10.70% 1.90%
Receivables -31.96% -28.15% -3.20% 2.22% 15.78%
Prepaid Expenses 25.36% 23.93% 12.98% 15.90% 1.31%
Inventories 10.33% 23.26% 31.74% 26.90% 13.71%
Investments -32.35% 135.29% 692.02% -46.64% 127.73%
NCA Held Sale 230.13% 192.14% 1.30% 64.75% -60.53%
Total Current Assets 20.55% 28.01% 32.04% 23.66% 7.31%
Non-Current Assets
Receivables 194.29% 250.61% 376.33% 341.63% -32.24%
Investments 112.27% 167.25% 108.38% 27.60% 50.21%
PP&E -12.01% -13.83% 4.93% 0.12% -3.58%
Intangibles(Ex GW) 12.44% 13.63% 17.38% 19.05% 15.69%
Goodwill 30.87% 12.90% 18.76% 20.50% 5.56%
Future Tax Benefit -42.25% 72.17% 17.11% 5.75% -4.08%
Total NCA 0.90% 1.88% 12.02% 7.93% 1.55%
Total Assets 6.18% 8.90% 17.40% 12.16% 3.10%
Current liabilities
Account Payable 30.44% 22.27% 20.62% 17.21% 3.03%
Short-Term Debt 365.99% 802.02% 2924.63% 303.49% 211.40%
Provisions 47.02% 59.41% 1.88% 5.02% 0.44%
NCL Held Sale -89.70% 0.85% -100.00% -100.00% -100.00%
Other -100.00% -90.73% -57.99% -100.00% 21.00%
Total Curr. Liabilities 30.42% 32.91% 35.51% 11.71% 1.47%
Non-Current liabilities
Long-Term Debt -40.86% -17.56% -34.42% -11.91% -8.79%
Provisions 14.89% 56.16% 66.66% 75.67% -16.13%
Other -54.97% -53.02% -53.43% -62.03% 41.30%
Total NCL -33.81% -10.07% -20.92% -3.88% -4.47%
Total Liabilities -0.72% 12.07% 8.15% 4.15% -1.41%
Equity
Share Capital 31.32% 22.83% 14.81% 8.31% 1.55%
Reserves -145.32% -137.40% -137.87% -178.93% -110.00%
Retained Earnings -8.80% -24.95% 40.03% 30.26% 11.95%
Outside Equity 35.65% 20.61% 15.38% 5.73% 5.42%
Total Equity 16.93% 3.97% 31.80% 24.62% 10.11%
Total liabilities + Total Equity 6.18% 8.90% 17.40% 12.16% 3.10%
(Data Analysis Premium, 2018).
Cash Flow Statement:
Item 2017 (%) 2016 (%) 2015 (%) 2014 (%) 2013 (%)
Receipts from Customers 6.34% 6.06% 6.93% 6.97% 3.64%
Payments to Suppliers and Employees 7.08% 7.70% 6.52% 6.11% 3.96%
Interest Received -100.00% -100.00% -100.00% -63.43% -17.16%
Interest Paid -40.92% -26.96% -21.66% -12.14% 20.35%
Tax Paid -29.03% -9.87% 12.14% 23.49% 3.81%
Net Operating Cash flows 8.64% -17.97% 16.40% 20.84% -5.36%
FINANCIAL STATEMENT ANALYSIS 5
Payment for Purchase of PPE -10.79% -7.37% 1.49% -12.05% -7.97%
Proceeds From Sale of PPE 40.25% 261.90% 321.30% -2.81% 352.68%
Investments Purchased -100.00% 116.67% 316.67% -100.00% 4566.67%
Payments for Purchase of Subsidiaries -96.14% -84.37% -38.91% 155.85% 62.12%
Proceeds from Sale of Subsidiaries #DIV/0! #DIV/0! #DIV/0! #DIV/0! #DIV/0!
Loans Granted -100.00% -100.00% -100.00% -100.00% -100.00%
Other Investing Cash flows -55.13% -58.97% -41.03% -202.56% 193.59%
Net Investing Cash flows -31.19% -39.11% -35.88% -2.35% -42.23%
Proceeds from Issues -82.87% -62.95% -45.51% -32.36% 29.08%
Proceeds from Borrowings -98.51% -94.92% -59.23% -36.42% -51.67%
Repayment of Borrowings -89.04% -92.25% -59.12% -38.22% -49.33%
Dividends Paid -57.80% -8.67% 17.60% 14.28% 6.30%
Other Financing Cash flows -100.00% -240.70% -262.79% -106.98% -34.88%
Net Financing Cash flows 17.70% 0.39% 9.64% -6.62% 3.48%
Net Increase in Cash -94.27% -43.16% -159.26% -110.27% -99.67%
Cash at Beginning of Period -37.09% -12.25% -39.29% -44.12% -44.38%
Exchange Rate Adj -146.15% 415.38% 700.00% 207.69% 376.92%
Cash at End of Period 8.46% 13.11% 57.76% 9.16% 0.47%
(Data Analysis Premium, 2018).
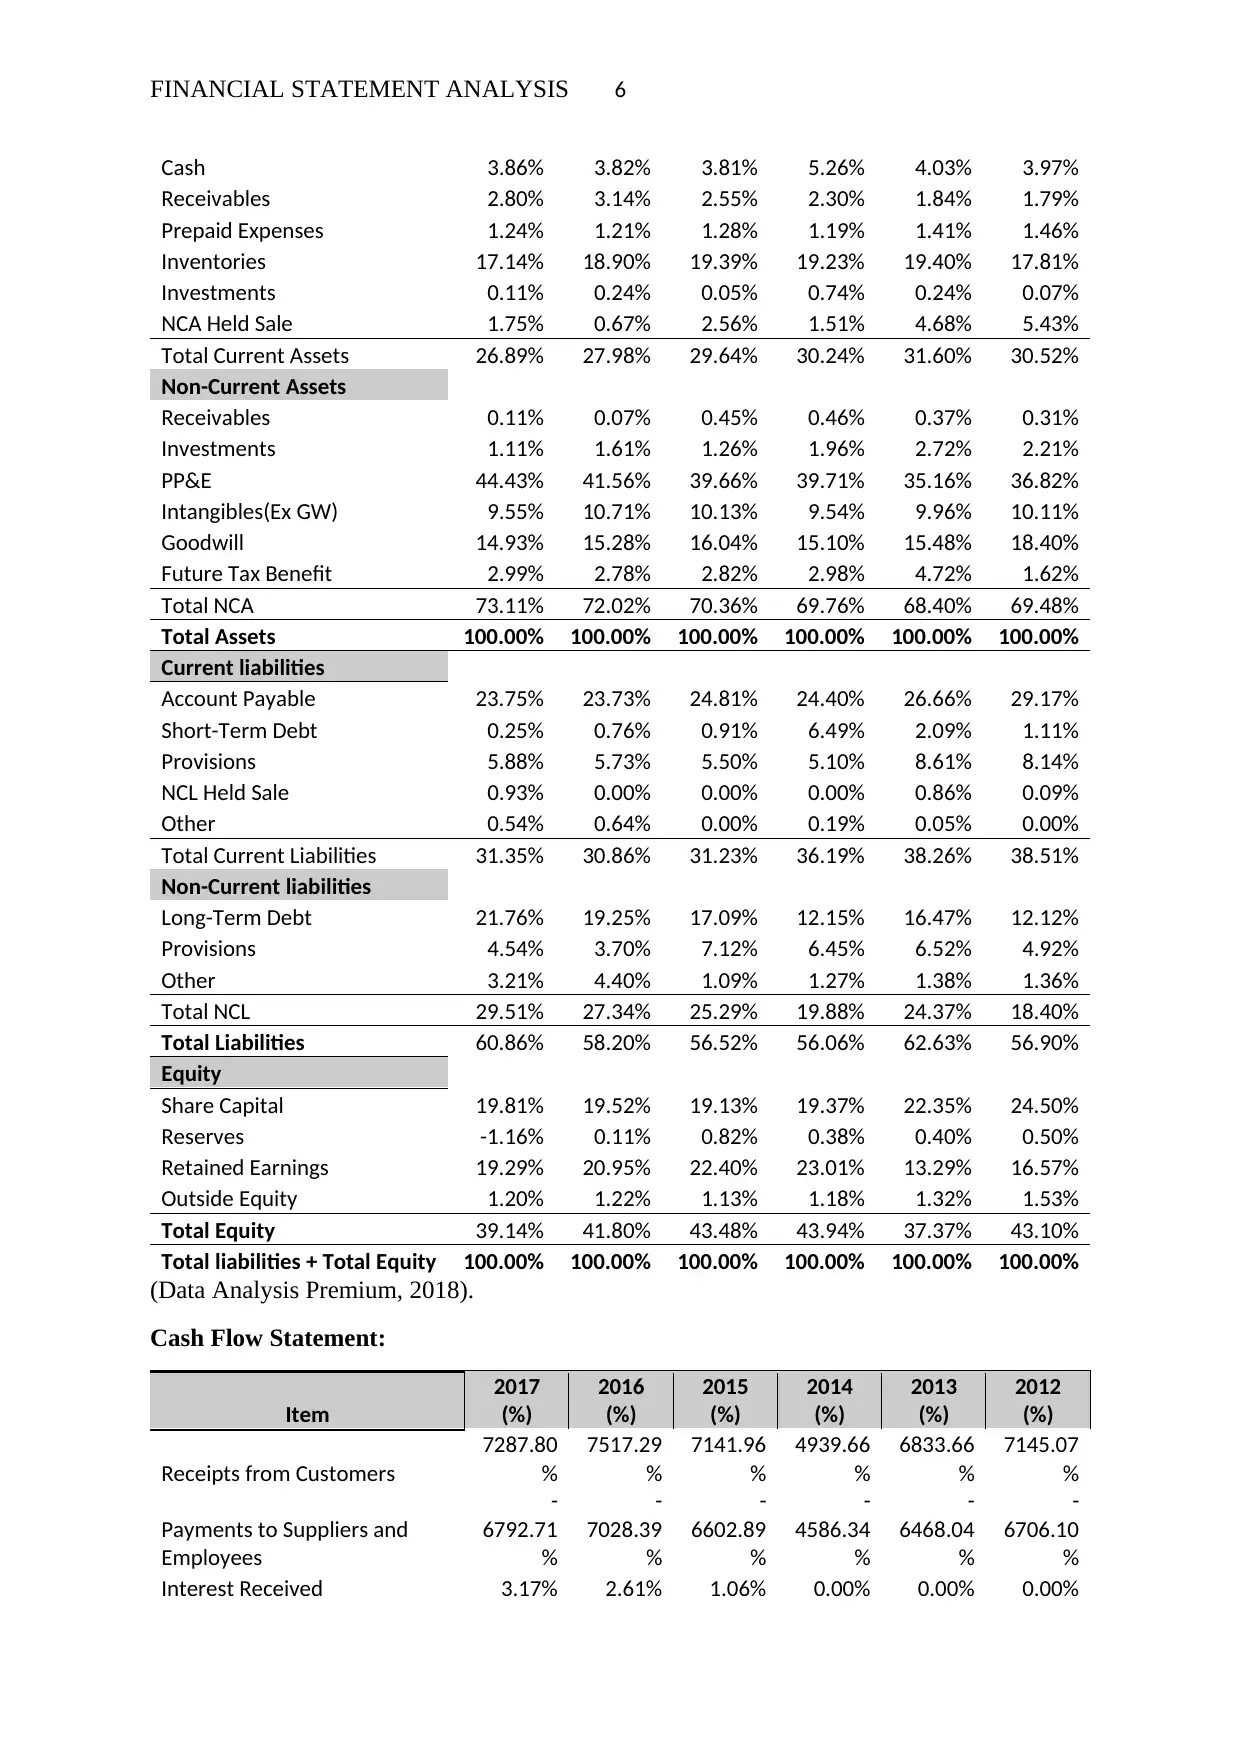
Common Size Analysis:
Profit and loss statement:
Item 2017 (%) 2016 (%) 2015 (%) 2014 (%) 2013 (%)
2012
(%)
Operating Revenue 99.89% 99.57% 99.59% 99.54% 99.53% 99.56%
Other Revenue 0.11% 0.43% 0.41% 0.46% 0.47% 0.44%
Total Revenue Excluding
Interest 100.00% 100.00% 100.00% 100.00% 100.00%
100.00
%
Operating Expenses 91.35% 92.03% 92.19% 92.00% 93.88% 94.03%
EBITDA 8.65% 7.97% 7.81% 8.00% 6.12% 5.97%
Depreciation and
Amortisation 1.59% 1.64% 1.63% 1.87% 1.75% 1.81%
EBIT 7.06% 6.34% 6.18% 6.13% 4.38% 4.16%
Interest Revenue 0.05% 0.04% 0.02% 0.00% 0.00% 0.00%
Interest Expense 0.57% 0.70% 0.45% 0.42% 0.42% 0.35%
Pre-tax Profit 6.54% 5.68% 5.74% 5.71% 3.96% 3.81%
Tax Expense 1.59% 1.69% 1.73% 1.71% 1.22% 1.16%
Net Profit after Tax Before
Abnormals 4.94% 3.99% 4.02% 4.00% 2.74% 2.65%
Abnormals 1.01% 0.22% 0.00% 0.70% 1.64% 0.00%
Abnormals Tax 0.00% 0.06% 0.00% 0.19% 0.33% 0.00%
Reported NPAT After
Abnormals 3.27% 3.84% 4.02% 3.50% 4.01% 2.85%
Balance Sheet:
Item 2017 (%) 2016 (%) 2015 (%) 2014 (%) 2013 (%) 2012 (%)
Current Assets
Payment for Purchase of PPE -10.79% -7.37% 1.49% -12.05% -7.97%
Proceeds From Sale of PPE 40.25% 261.90% 321.30% -2.81% 352.68%
Investments Purchased -100.00% 116.67% 316.67% -100.00% 4566.67%
Payments for Purchase of Subsidiaries -96.14% -84.37% -38.91% 155.85% 62.12%
Proceeds from Sale of Subsidiaries #DIV/0! #DIV/0! #DIV/0! #DIV/0! #DIV/0!
Loans Granted -100.00% -100.00% -100.00% -100.00% -100.00%
Other Investing Cash flows -55.13% -58.97% -41.03% -202.56% 193.59%
Net Investing Cash flows -31.19% -39.11% -35.88% -2.35% -42.23%
Proceeds from Issues -82.87% -62.95% -45.51% -32.36% 29.08%
Proceeds from Borrowings -98.51% -94.92% -59.23% -36.42% -51.67%
Repayment of Borrowings -89.04% -92.25% -59.12% -38.22% -49.33%
Dividends Paid -57.80% -8.67% 17.60% 14.28% 6.30%
Other Financing Cash flows -100.00% -240.70% -262.79% -106.98% -34.88%
Net Financing Cash flows 17.70% 0.39% 9.64% -6.62% 3.48%
Net Increase in Cash -94.27% -43.16% -159.26% -110.27% -99.67%
Cash at Beginning of Period -37.09% -12.25% -39.29% -44.12% -44.38%
Exchange Rate Adj -146.15% 415.38% 700.00% 207.69% 376.92%
Cash at End of Period 8.46% 13.11% 57.76% 9.16% 0.47%
(Data Analysis Premium, 2018).
Common Size Analysis:
Profit and loss statement:
Item 2017 (%) 2016 (%) 2015 (%) 2014 (%) 2013 (%)
2012
(%)
Operating Revenue 99.89% 99.57% 99.59% 99.54% 99.53% 99.56%
Other Revenue 0.11% 0.43% 0.41% 0.46% 0.47% 0.44%
Total Revenue Excluding
Interest 100.00% 100.00% 100.00% 100.00% 100.00%
100.00
%
Operating Expenses 91.35% 92.03% 92.19% 92.00% 93.88% 94.03%
EBITDA 8.65% 7.97% 7.81% 8.00% 6.12% 5.97%
Depreciation and
Amortisation 1.59% 1.64% 1.63% 1.87% 1.75% 1.81%
EBIT 7.06% 6.34% 6.18% 6.13% 4.38% 4.16%
Interest Revenue 0.05% 0.04% 0.02% 0.00% 0.00% 0.00%
Interest Expense 0.57% 0.70% 0.45% 0.42% 0.42% 0.35%
Pre-tax Profit 6.54% 5.68% 5.74% 5.71% 3.96% 3.81%
Tax Expense 1.59% 1.69% 1.73% 1.71% 1.22% 1.16%
Net Profit after Tax Before
Abnormals 4.94% 3.99% 4.02% 4.00% 2.74% 2.65%
Abnormals 1.01% 0.22% 0.00% 0.70% 1.64% 0.00%
Abnormals Tax 0.00% 0.06% 0.00% 0.19% 0.33% 0.00%
Reported NPAT After
Abnormals 3.27% 3.84% 4.02% 3.50% 4.01% 2.85%
Balance Sheet:
Item 2017 (%) 2016 (%) 2015 (%) 2014 (%) 2013 (%) 2012 (%)
Current Assets
⊘ This is a preview!⊘
Do you want full access?
Subscribe today to unlock all pages.
Trusted by 1+ million students worldwide
FINANCIAL STATEMENT ANALYSIS 6
Cash 3.86% 3.82% 3.81% 5.26% 4.03% 3.97%
Receivables 2.80% 3.14% 2.55% 2.30% 1.84% 1.79%
Prepaid Expenses 1.24% 1.21% 1.28% 1.19% 1.41% 1.46%
Inventories 17.14% 18.90% 19.39% 19.23% 19.40% 17.81%
Investments 0.11% 0.24% 0.05% 0.74% 0.24% 0.07%
NCA Held Sale 1.75% 0.67% 2.56% 1.51% 4.68% 5.43%
Total Current Assets 26.89% 27.98% 29.64% 30.24% 31.60% 30.52%
Non-Current Assets
Receivables 0.11% 0.07% 0.45% 0.46% 0.37% 0.31%
Investments 1.11% 1.61% 1.26% 1.96% 2.72% 2.21%
PP&E 44.43% 41.56% 39.66% 39.71% 35.16% 36.82%
Intangibles(Ex GW) 9.55% 10.71% 10.13% 9.54% 9.96% 10.11%
Goodwill 14.93% 15.28% 16.04% 15.10% 15.48% 18.40%
Future Tax Benefit 2.99% 2.78% 2.82% 2.98% 4.72% 1.62%
Total NCA 73.11% 72.02% 70.36% 69.76% 68.40% 69.48%
Total Assets 100.00% 100.00% 100.00% 100.00% 100.00% 100.00%
Current liabilities
Account Payable 23.75% 23.73% 24.81% 24.40% 26.66% 29.17%
Short-Term Debt 0.25% 0.76% 0.91% 6.49% 2.09% 1.11%
Provisions 5.88% 5.73% 5.50% 5.10% 8.61% 8.14%
NCL Held Sale 0.93% 0.00% 0.00% 0.00% 0.86% 0.09%
Other 0.54% 0.64% 0.00% 0.19% 0.05% 0.00%
Total Current Liabilities 31.35% 30.86% 31.23% 36.19% 38.26% 38.51%
Non-Current liabilities
Long-Term Debt 21.76% 19.25% 17.09% 12.15% 16.47% 12.12%
Provisions 4.54% 3.70% 7.12% 6.45% 6.52% 4.92%
Other 3.21% 4.40% 1.09% 1.27% 1.38% 1.36%
Total NCL 29.51% 27.34% 25.29% 19.88% 24.37% 18.40%
Total Liabilities 60.86% 58.20% 56.52% 56.06% 62.63% 56.90%
Equity
Share Capital 19.81% 19.52% 19.13% 19.37% 22.35% 24.50%
Reserves -1.16% 0.11% 0.82% 0.38% 0.40% 0.50%
Retained Earnings 19.29% 20.95% 22.40% 23.01% 13.29% 16.57%
Outside Equity 1.20% 1.22% 1.13% 1.18% 1.32% 1.53%
Total Equity 39.14% 41.80% 43.48% 43.94% 37.37% 43.10%
Total liabilities + Total Equity 100.00% 100.00% 100.00% 100.00% 100.00% 100.00%
(Data Analysis Premium, 2018).
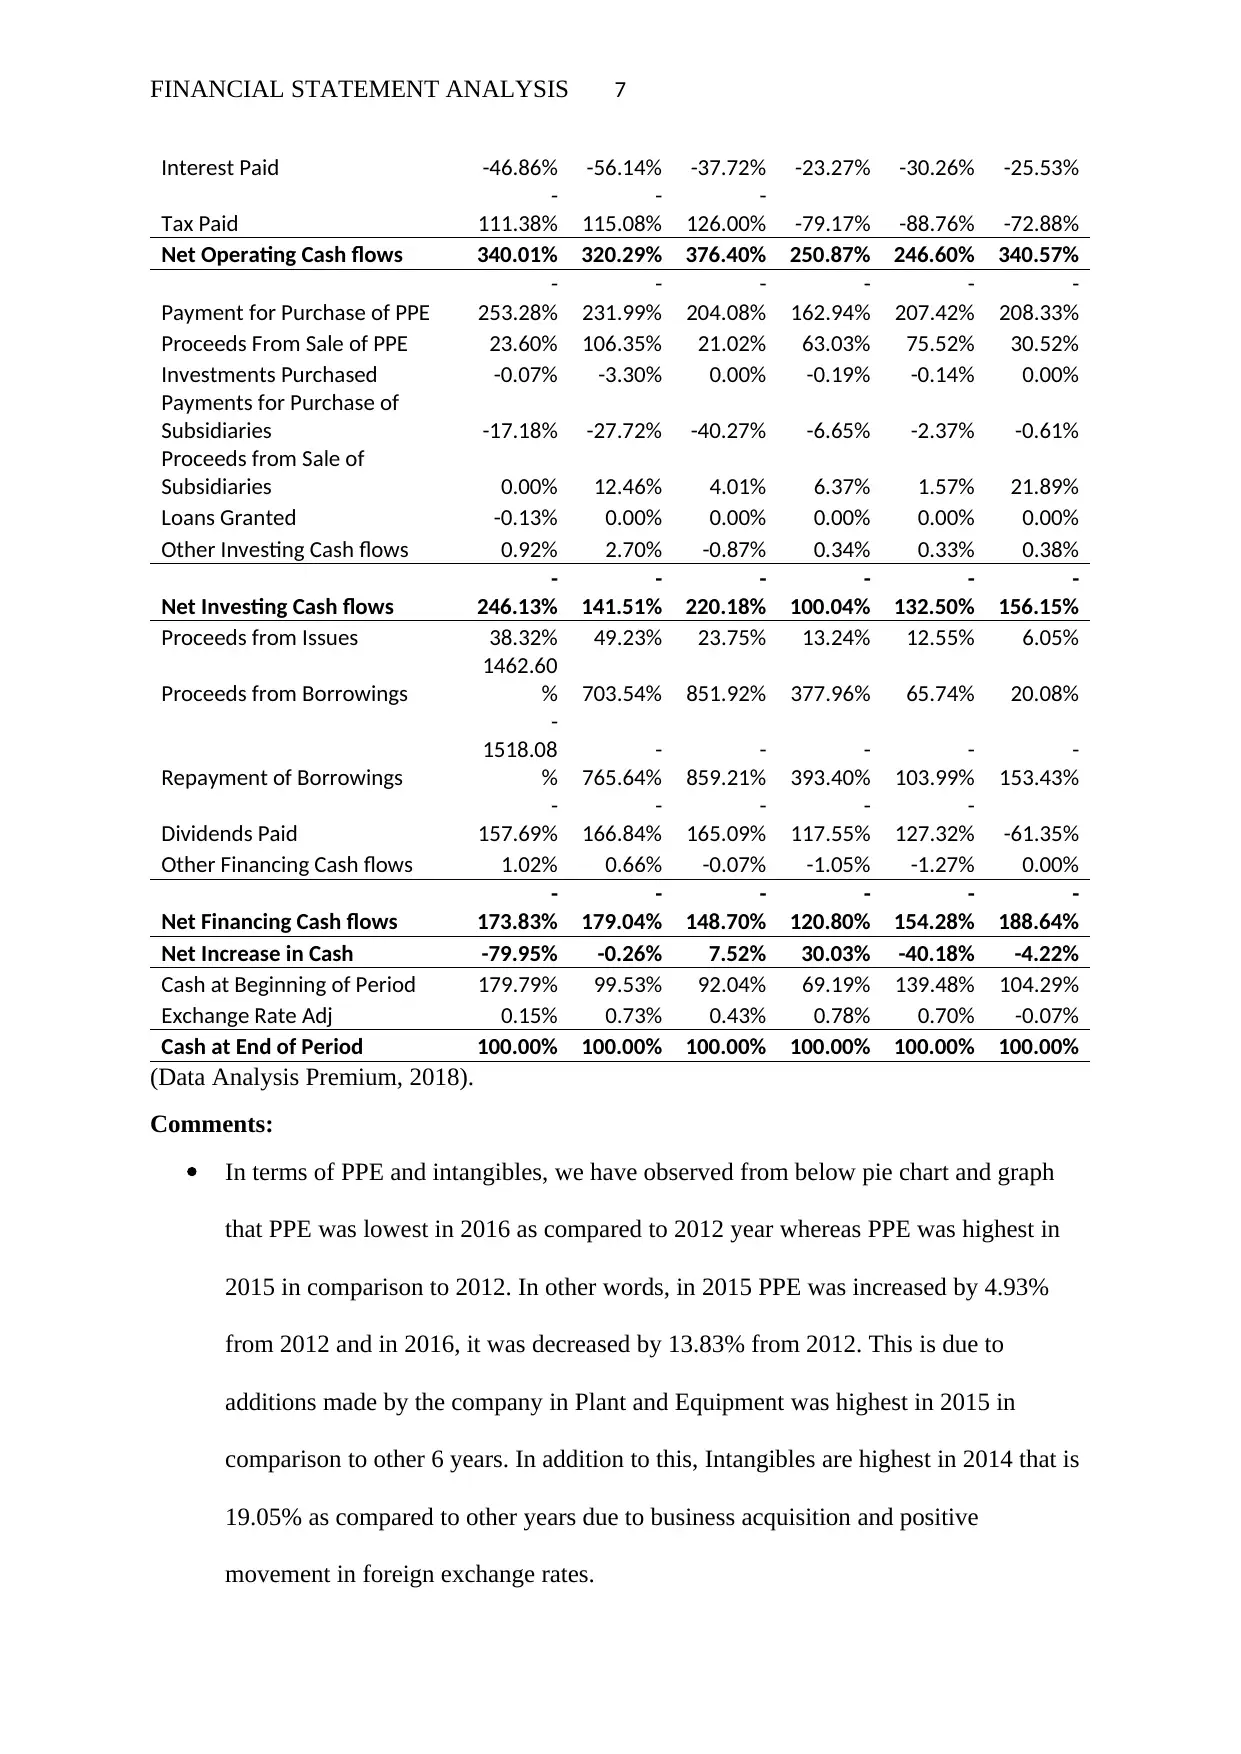
Cash Flow Statement:
Item
2017
(%)
2016
(%)
2015
(%)
2014
(%)
2013
(%)
2012
(%)
Receipts from Customers
7287.80
%
7517.29
%
7141.96
%
4939.66
%
6833.66
%
7145.07
%
Payments to Suppliers and
Employees
-
6792.71
%
-
7028.39
%
-
6602.89
%
-
4586.34
%
-
6468.04
%
-
6706.10
%
Interest Received 3.17% 2.61% 1.06% 0.00% 0.00% 0.00%
Cash 3.86% 3.82% 3.81% 5.26% 4.03% 3.97%
Receivables 2.80% 3.14% 2.55% 2.30% 1.84% 1.79%
Prepaid Expenses 1.24% 1.21% 1.28% 1.19% 1.41% 1.46%
Inventories 17.14% 18.90% 19.39% 19.23% 19.40% 17.81%
Investments 0.11% 0.24% 0.05% 0.74% 0.24% 0.07%
NCA Held Sale 1.75% 0.67% 2.56% 1.51% 4.68% 5.43%
Total Current Assets 26.89% 27.98% 29.64% 30.24% 31.60% 30.52%
Non-Current Assets
Receivables 0.11% 0.07% 0.45% 0.46% 0.37% 0.31%
Investments 1.11% 1.61% 1.26% 1.96% 2.72% 2.21%
PP&E 44.43% 41.56% 39.66% 39.71% 35.16% 36.82%
Intangibles(Ex GW) 9.55% 10.71% 10.13% 9.54% 9.96% 10.11%
Goodwill 14.93% 15.28% 16.04% 15.10% 15.48% 18.40%
Future Tax Benefit 2.99% 2.78% 2.82% 2.98% 4.72% 1.62%
Total NCA 73.11% 72.02% 70.36% 69.76% 68.40% 69.48%
Total Assets 100.00% 100.00% 100.00% 100.00% 100.00% 100.00%
Current liabilities
Account Payable 23.75% 23.73% 24.81% 24.40% 26.66% 29.17%
Short-Term Debt 0.25% 0.76% 0.91% 6.49% 2.09% 1.11%
Provisions 5.88% 5.73% 5.50% 5.10% 8.61% 8.14%
NCL Held Sale 0.93% 0.00% 0.00% 0.00% 0.86% 0.09%
Other 0.54% 0.64% 0.00% 0.19% 0.05% 0.00%
Total Current Liabilities 31.35% 30.86% 31.23% 36.19% 38.26% 38.51%
Non-Current liabilities
Long-Term Debt 21.76% 19.25% 17.09% 12.15% 16.47% 12.12%
Provisions 4.54% 3.70% 7.12% 6.45% 6.52% 4.92%
Other 3.21% 4.40% 1.09% 1.27% 1.38% 1.36%
Total NCL 29.51% 27.34% 25.29% 19.88% 24.37% 18.40%
Total Liabilities 60.86% 58.20% 56.52% 56.06% 62.63% 56.90%
Equity
Share Capital 19.81% 19.52% 19.13% 19.37% 22.35% 24.50%
Reserves -1.16% 0.11% 0.82% 0.38% 0.40% 0.50%
Retained Earnings 19.29% 20.95% 22.40% 23.01% 13.29% 16.57%
Outside Equity 1.20% 1.22% 1.13% 1.18% 1.32% 1.53%
Total Equity 39.14% 41.80% 43.48% 43.94% 37.37% 43.10%
Total liabilities + Total Equity 100.00% 100.00% 100.00% 100.00% 100.00% 100.00%
(Data Analysis Premium, 2018).
Cash Flow Statement:
Item
2017
(%)
2016
(%)
2015
(%)
2014
(%)
2013
(%)
2012
(%)
Receipts from Customers
7287.80
%
7517.29
%
7141.96
%
4939.66
%
6833.66
%
7145.07
%
Payments to Suppliers and
Employees
-
6792.71
%
-
7028.39
%
-
6602.89
%
-
4586.34
%
-
6468.04
%
-
6706.10
%
Interest Received 3.17% 2.61% 1.06% 0.00% 0.00% 0.00%
Paraphrase This Document
Need a fresh take? Get an instant paraphrase of this document with our AI Paraphraser
FINANCIAL STATEMENT ANALYSIS 7
Interest Paid -46.86% -56.14% -37.72% -23.27% -30.26% -25.53%
Tax Paid
-
111.38%
-
115.08%
-
126.00% -79.17% -88.76% -72.88%
Net Operating Cash flows 340.01% 320.29% 376.40% 250.87% 246.60% 340.57%
Payment for Purchase of PPE
-
253.28%
-
231.99%
-
204.08%
-
162.94%
-
207.42%
-
208.33%
Proceeds From Sale of PPE 23.60% 106.35% 21.02% 63.03% 75.52% 30.52%
Investments Purchased -0.07% -3.30% 0.00% -0.19% -0.14% 0.00%
Payments for Purchase of
Subsidiaries -17.18% -27.72% -40.27% -6.65% -2.37% -0.61%
Proceeds from Sale of
Subsidiaries 0.00% 12.46% 4.01% 6.37% 1.57% 21.89%
Loans Granted -0.13% 0.00% 0.00% 0.00% 0.00% 0.00%
Other Investing Cash flows 0.92% 2.70% -0.87% 0.34% 0.33% 0.38%
Net Investing Cash flows
-
246.13%
-
141.51%
-
220.18%
-
100.04%
-
132.50%
-
156.15%
Proceeds from Issues 38.32% 49.23% 23.75% 13.24% 12.55% 6.05%
Proceeds from Borrowings
1462.60
% 703.54% 851.92% 377.96% 65.74% 20.08%
Repayment of Borrowings
-
1518.08
%
-
765.64%
-
859.21%
-
393.40%
-
103.99%
-
153.43%
Dividends Paid
-
157.69%
-
166.84%
-
165.09%
-
117.55%
-
127.32% -61.35%
Other Financing Cash flows 1.02% 0.66% -0.07% -1.05% -1.27% 0.00%
Net Financing Cash flows
-
173.83%
-
179.04%
-
148.70%
-
120.80%
-
154.28%
-
188.64%
Net Increase in Cash -79.95% -0.26% 7.52% 30.03% -40.18% -4.22%
Cash at Beginning of Period 179.79% 99.53% 92.04% 69.19% 139.48% 104.29%
Exchange Rate Adj 0.15% 0.73% 0.43% 0.78% 0.70% -0.07%
Cash at End of Period 100.00% 100.00% 100.00% 100.00% 100.00% 100.00%
(Data Analysis Premium, 2018).
Comments:
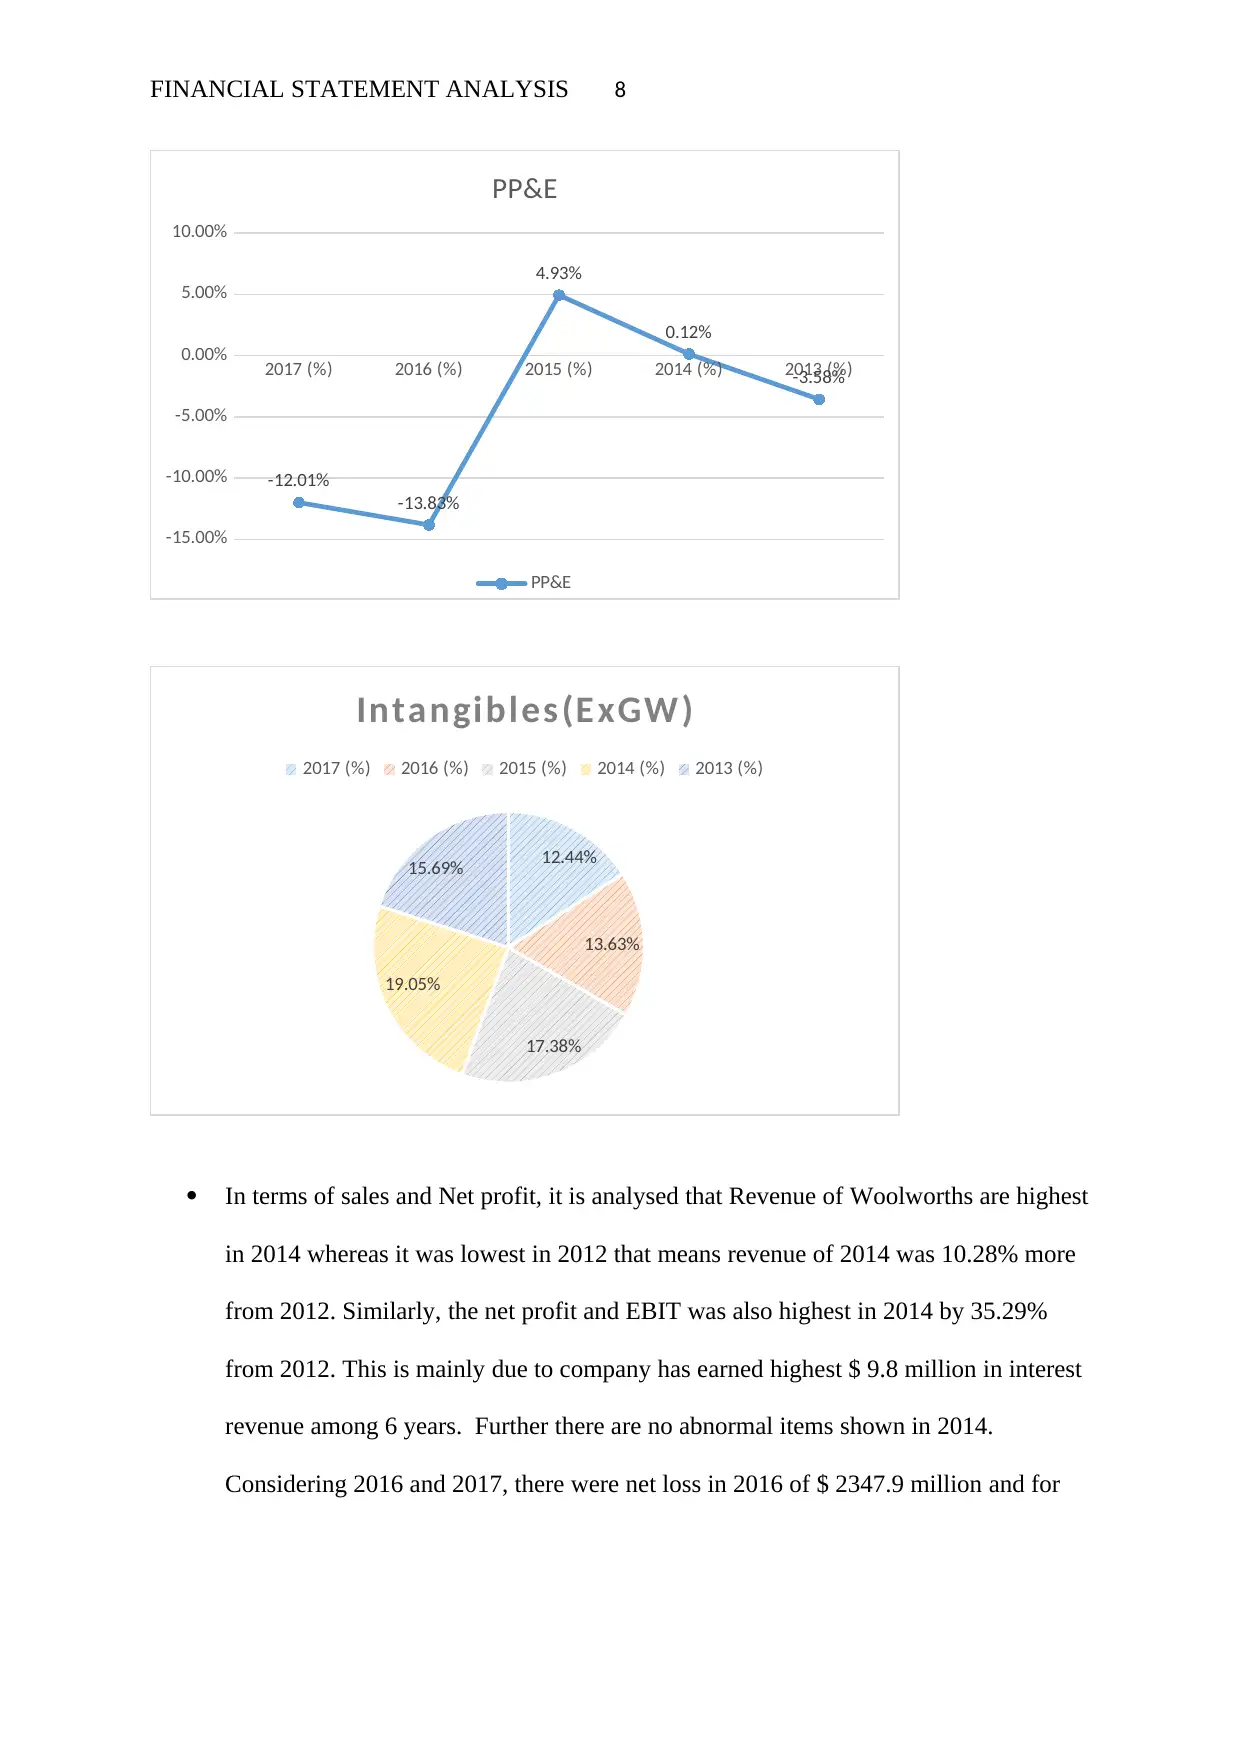
In terms of PPE and intangibles, we have observed from below pie chart and graph
that PPE was lowest in 2016 as compared to 2012 year whereas PPE was highest in
2015 in comparison to 2012. In other words, in 2015 PPE was increased by 4.93%
from 2012 and in 2016, it was decreased by 13.83% from 2012. This is due to
additions made by the company in Plant and Equipment was highest in 2015 in
comparison to other 6 years. In addition to this, Intangibles are highest in 2014 that is
19.05% as compared to other years due to business acquisition and positive
movement in foreign exchange rates.
Interest Paid -46.86% -56.14% -37.72% -23.27% -30.26% -25.53%
Tax Paid
-
111.38%
-
115.08%
-
126.00% -79.17% -88.76% -72.88%
Net Operating Cash flows 340.01% 320.29% 376.40% 250.87% 246.60% 340.57%
Payment for Purchase of PPE
-
253.28%
-
231.99%
-
204.08%
-
162.94%
-
207.42%
-
208.33%
Proceeds From Sale of PPE 23.60% 106.35% 21.02% 63.03% 75.52% 30.52%
Investments Purchased -0.07% -3.30% 0.00% -0.19% -0.14% 0.00%
Payments for Purchase of
Subsidiaries -17.18% -27.72% -40.27% -6.65% -2.37% -0.61%
Proceeds from Sale of
Subsidiaries 0.00% 12.46% 4.01% 6.37% 1.57% 21.89%
Loans Granted -0.13% 0.00% 0.00% 0.00% 0.00% 0.00%
Other Investing Cash flows 0.92% 2.70% -0.87% 0.34% 0.33% 0.38%
Net Investing Cash flows
-
246.13%
-
141.51%
-
220.18%
-
100.04%
-
132.50%
-
156.15%
Proceeds from Issues 38.32% 49.23% 23.75% 13.24% 12.55% 6.05%
Proceeds from Borrowings
1462.60
% 703.54% 851.92% 377.96% 65.74% 20.08%
Repayment of Borrowings
-
1518.08
%
-
765.64%
-
859.21%
-
393.40%
-
103.99%
-
153.43%
Dividends Paid
-
157.69%
-
166.84%
-
165.09%
-
117.55%
-
127.32% -61.35%
Other Financing Cash flows 1.02% 0.66% -0.07% -1.05% -1.27% 0.00%
Net Financing Cash flows
-
173.83%
-
179.04%
-
148.70%
-
120.80%
-
154.28%
-
188.64%
Net Increase in Cash -79.95% -0.26% 7.52% 30.03% -40.18% -4.22%
Cash at Beginning of Period 179.79% 99.53% 92.04% 69.19% 139.48% 104.29%
Exchange Rate Adj 0.15% 0.73% 0.43% 0.78% 0.70% -0.07%
Cash at End of Period 100.00% 100.00% 100.00% 100.00% 100.00% 100.00%
(Data Analysis Premium, 2018).
Comments:
In terms of PPE and intangibles, we have observed from below pie chart and graph
that PPE was lowest in 2016 as compared to 2012 year whereas PPE was highest in
2015 in comparison to 2012. In other words, in 2015 PPE was increased by 4.93%
from 2012 and in 2016, it was decreased by 13.83% from 2012. This is due to
additions made by the company in Plant and Equipment was highest in 2015 in
comparison to other 6 years. In addition to this, Intangibles are highest in 2014 that is
19.05% as compared to other years due to business acquisition and positive
movement in foreign exchange rates.
FINANCIAL STATEMENT ANALYSIS 8
2017 (%) 2016 (%) 2015 (%) 2014 (%) 2013 (%)
-15.00%
-10.00%
-5.00%
0.00%
5.00%
10.00%
-12.01%
-13.83%
4.93%
0.12%
-3.58%
PP&E
PP&E
12.44%
13.63%
17.38%
19.05%
15.69%
Intangibles(ExGW)
2017 (%) 2016 (%) 2015 (%) 2014 (%) 2013 (%)
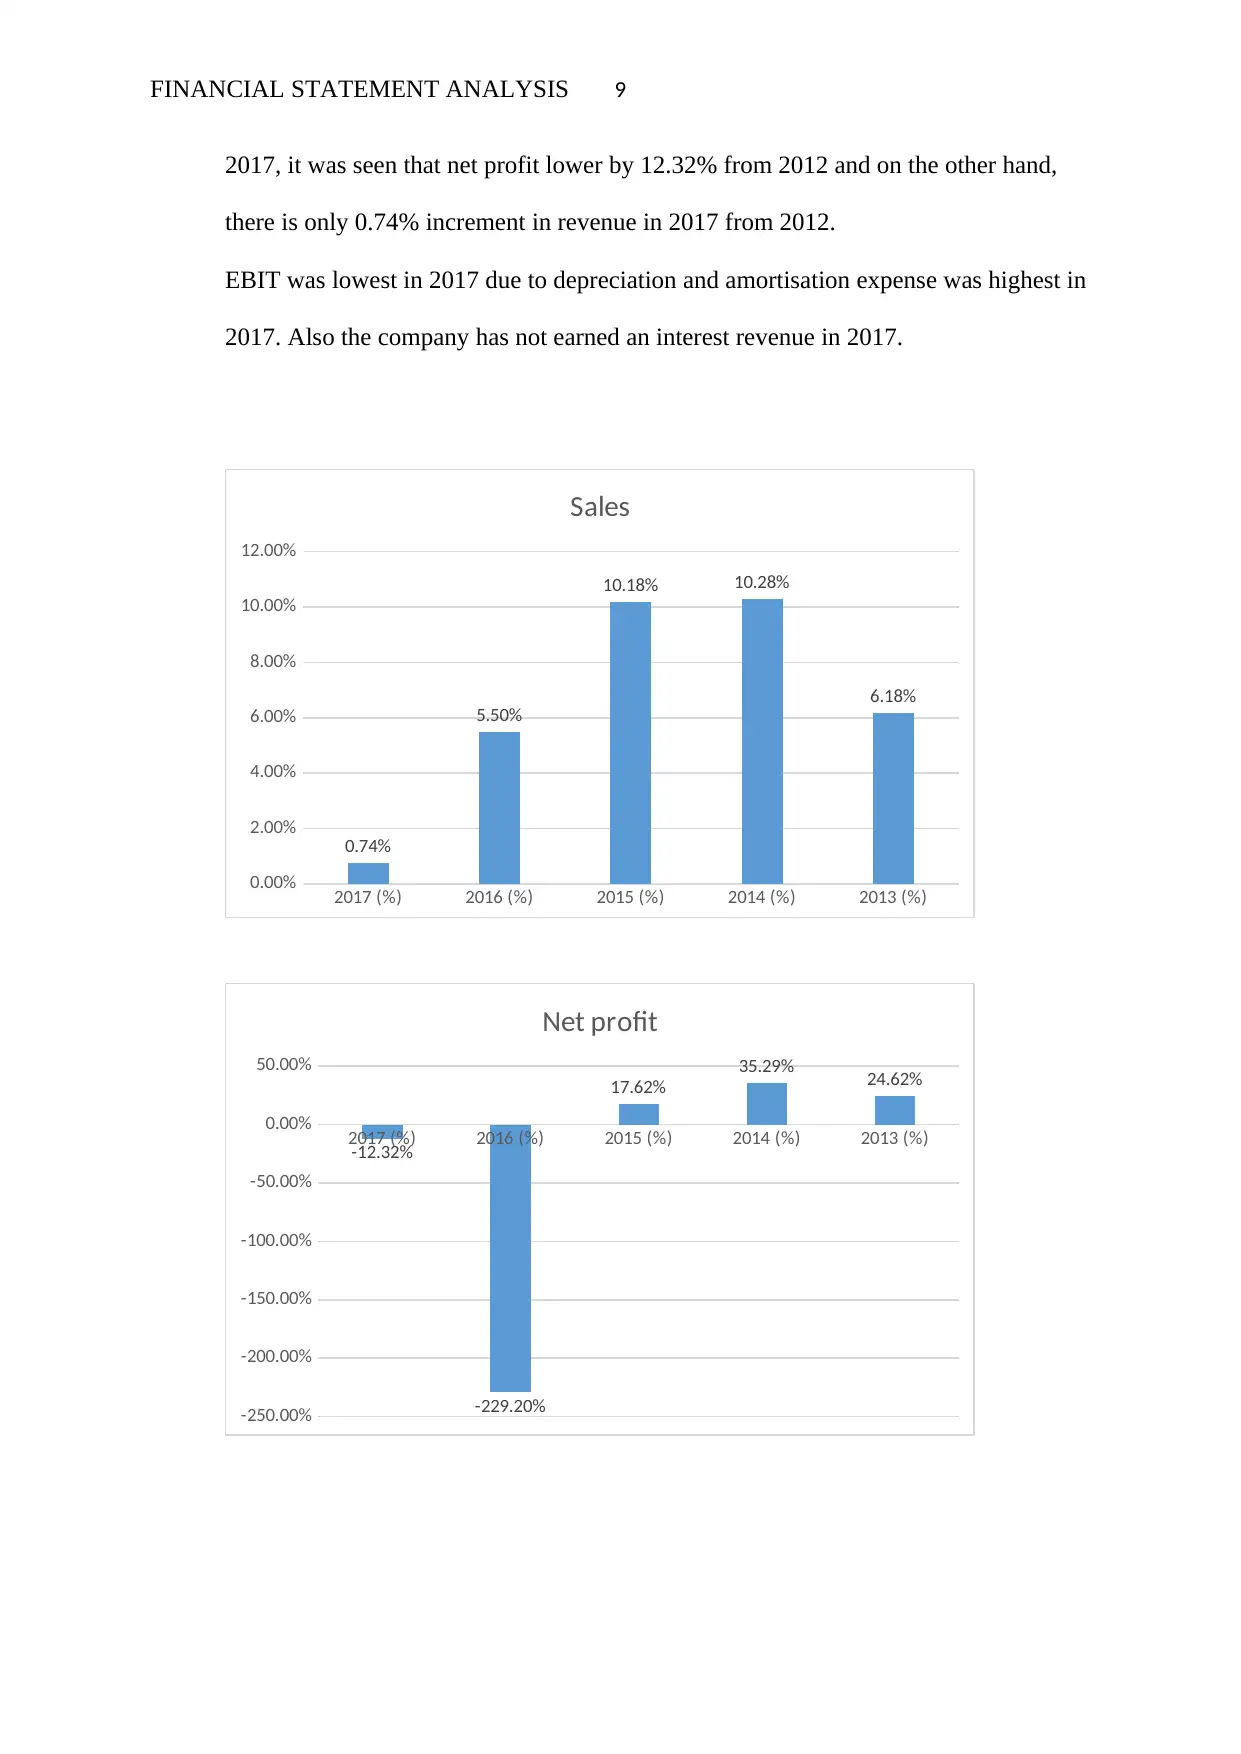
In terms of sales and Net profit, it is analysed that Revenue of Woolworths are highest
in 2014 whereas it was lowest in 2012 that means revenue of 2014 was 10.28% more
from 2012. Similarly, the net profit and EBIT was also highest in 2014 by 35.29%
from 2012. This is mainly due to company has earned highest $ 9.8 million in interest
revenue among 6 years. Further there are no abnormal items shown in 2014.
Considering 2016 and 2017, there were net loss in 2016 of $ 2347.9 million and for
2017 (%) 2016 (%) 2015 (%) 2014 (%) 2013 (%)
-15.00%
-10.00%
-5.00%
0.00%
5.00%
10.00%
-12.01%
-13.83%
4.93%
0.12%
-3.58%
PP&E
PP&E
12.44%
13.63%
17.38%
19.05%
15.69%
Intangibles(ExGW)
2017 (%) 2016 (%) 2015 (%) 2014 (%) 2013 (%)
In terms of sales and Net profit, it is analysed that Revenue of Woolworths are highest
in 2014 whereas it was lowest in 2012 that means revenue of 2014 was 10.28% more
from 2012. Similarly, the net profit and EBIT was also highest in 2014 by 35.29%
from 2012. This is mainly due to company has earned highest $ 9.8 million in interest
revenue among 6 years. Further there are no abnormal items shown in 2014.
Considering 2016 and 2017, there were net loss in 2016 of $ 2347.9 million and for
⊘ This is a preview!⊘
Do you want full access?
Subscribe today to unlock all pages.
Trusted by 1+ million students worldwide
FINANCIAL STATEMENT ANALYSIS 9
2017, it was seen that net profit lower by 12.32% from 2012 and on the other hand,
there is only 0.74% increment in revenue in 2017 from 2012.
EBIT was lowest in 2017 due to depreciation and amortisation expense was highest in
2017. Also the company has not earned an interest revenue in 2017.
2017 (%) 2016 (%) 2015 (%) 2014 (%) 2013 (%)
0.00%
2.00%
4.00%
6.00%
8.00%
10.00%
12.00%
0.74%
5.50%
10.18% 10.28%
6.18%
Sales
2017 (%) 2016 (%) 2015 (%) 2014 (%) 2013 (%)
-250.00%
-200.00%
-150.00%
-100.00%
-50.00%
0.00%
50.00%
-12.32%
-229.20%
17.62%
35.29% 24.62%
Net profit
Paraphrase This Document
Need a fresh take? Get an instant paraphrase of this document with our AI Paraphraser
FINANCIAL STATEMENT ANALYSIS 10
2017 (%) 2016 (%) 2015 (%) 2014 (%) 2013 (%)
-45.00%
-40.00%
-35.00%
-30.00%
-25.00%
-20.00%
-15.00%
-10.00%
-5.00%
0.00%
-40.66%
-34.59%
-4.37% -3.48% -4.74%
EBIT
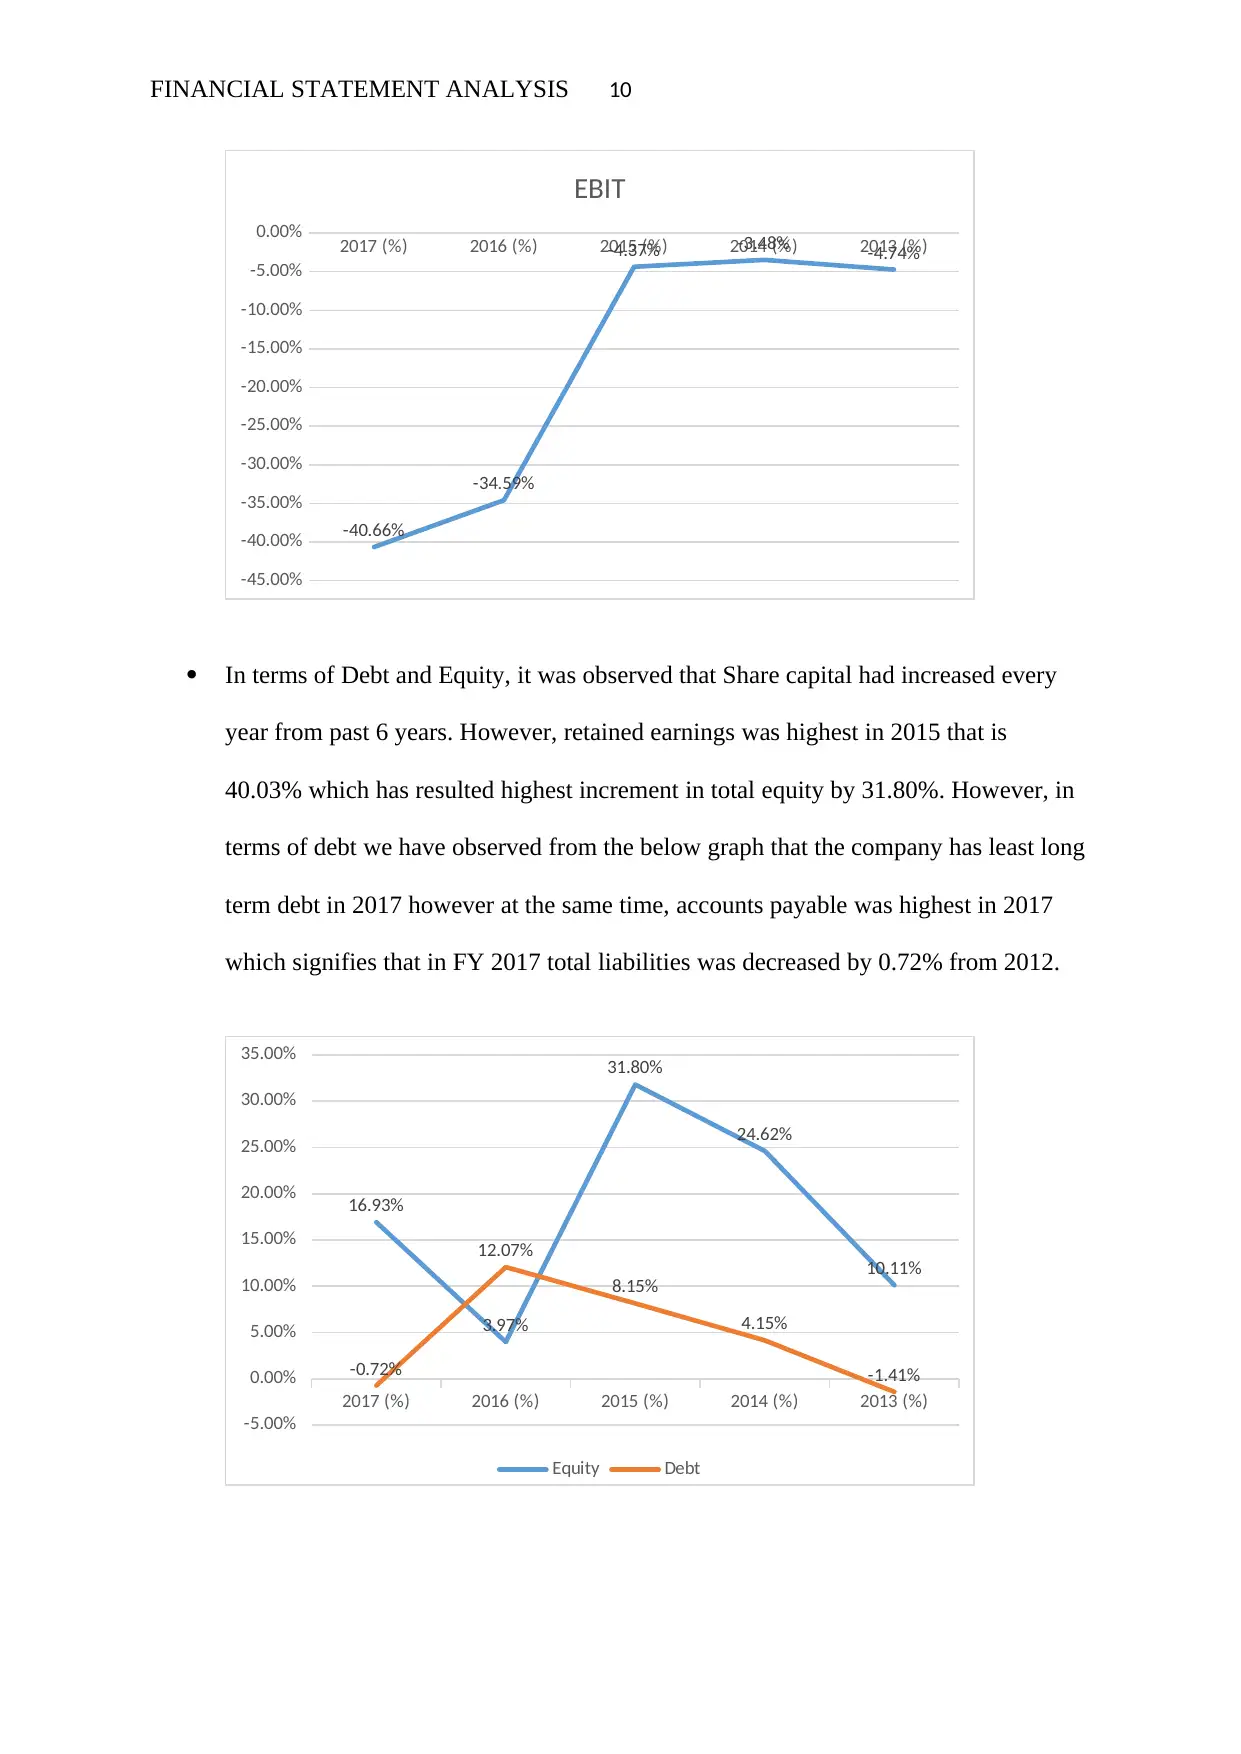
In terms of Debt and Equity, it was observed that Share capital had increased every
year from past 6 years. However, retained earnings was highest in 2015 that is
40.03% which has resulted highest increment in total equity by 31.80%. However, in
terms of debt we have observed from the below graph that the company has least long
term debt in 2017 however at the same time, accounts payable was highest in 2017
which signifies that in FY 2017 total liabilities was decreased by 0.72% from 2012.
2017 (%) 2016 (%) 2015 (%) 2014 (%) 2013 (%)
-5.00%
0.00%
5.00%
10.00%
15.00%
20.00%
25.00%
30.00%
35.00%
16.93%
3.97%
31.80%
24.62%
10.11%
-0.72%
12.07%
8.15%
4.15%
-1.41%
Equity Debt
2017 (%) 2016 (%) 2015 (%) 2014 (%) 2013 (%)
-45.00%
-40.00%
-35.00%
-30.00%
-25.00%
-20.00%
-15.00%
-10.00%
-5.00%
0.00%
-40.66%
-34.59%
-4.37% -3.48% -4.74%
EBIT
In terms of Debt and Equity, it was observed that Share capital had increased every
year from past 6 years. However, retained earnings was highest in 2015 that is
40.03% which has resulted highest increment in total equity by 31.80%. However, in
terms of debt we have observed from the below graph that the company has least long
term debt in 2017 however at the same time, accounts payable was highest in 2017
which signifies that in FY 2017 total liabilities was decreased by 0.72% from 2012.
2017 (%) 2016 (%) 2015 (%) 2014 (%) 2013 (%)
-5.00%
0.00%
5.00%
10.00%
15.00%
20.00%
25.00%
30.00%
35.00%
16.93%
3.97%
31.80%
24.62%
10.11%
-0.72%
12.07%
8.15%
4.15%
-1.41%
Equity Debt
FINANCIAL STATEMENT ANALYSIS 11
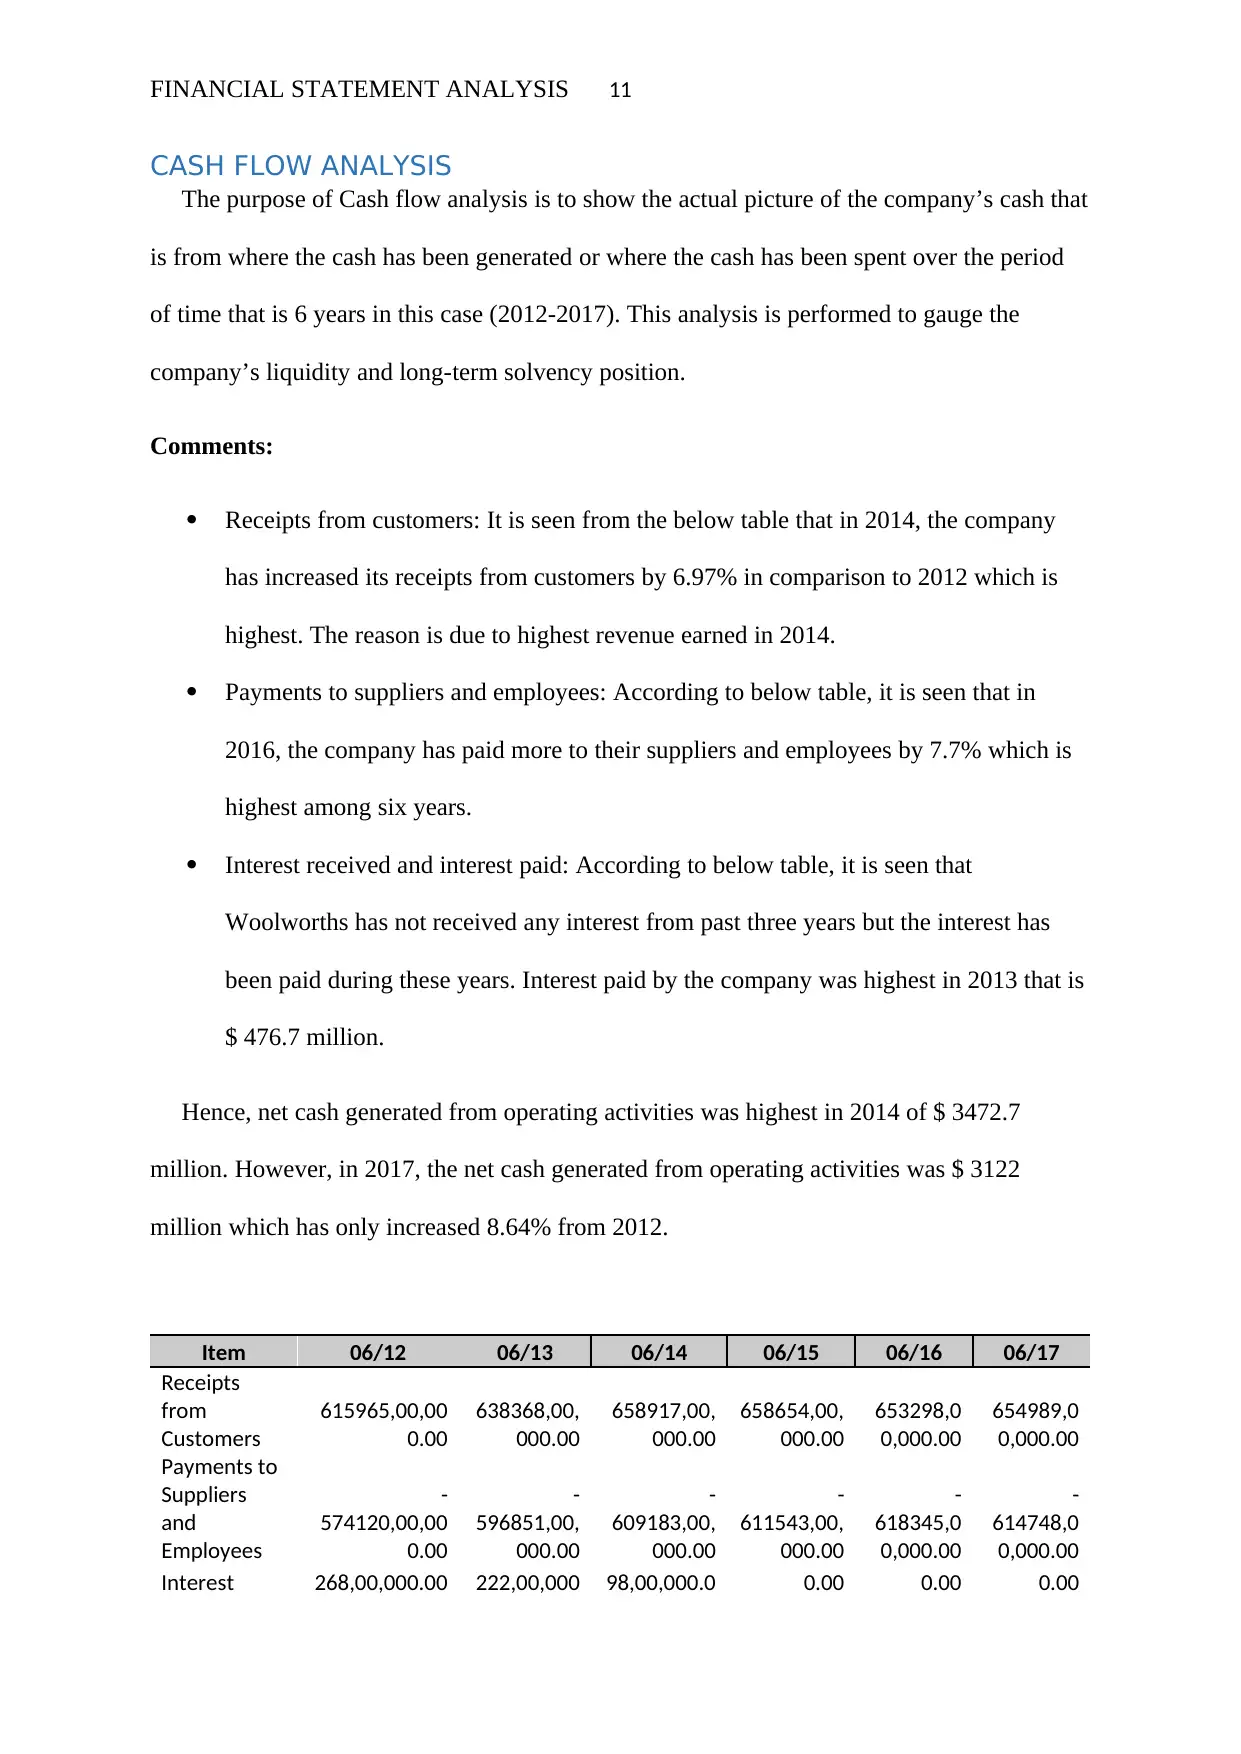
CASH FLOW ANALYSIS
The purpose of Cash flow analysis is to show the actual picture of the company’s cash that
is from where the cash has been generated or where the cash has been spent over the period
of time that is 6 years in this case (2012-2017). This analysis is performed to gauge the
company’s liquidity and long-term solvency position.
Comments:
Receipts from customers: It is seen from the below table that in 2014, the company
has increased its receipts from customers by 6.97% in comparison to 2012 which is
highest. The reason is due to highest revenue earned in 2014.
Payments to suppliers and employees: According to below table, it is seen that in
2016, the company has paid more to their suppliers and employees by 7.7% which is
highest among six years.
Interest received and interest paid: According to below table, it is seen that
Woolworths has not received any interest from past three years but the interest has
been paid during these years. Interest paid by the company was highest in 2013 that is
$ 476.7 million.
Hence, net cash generated from operating activities was highest in 2014 of $ 3472.7
million. However, in 2017, the net cash generated from operating activities was $ 3122
million which has only increased 8.64% from 2012.
Item 06/12 06/13 06/14 06/15 06/16 06/17
Receipts
from
Customers
615965,00,00
0.00
638368,00,
000.00
658917,00,
000.00
658654,00,
000.00
653298,0
0,000.00
654989,0
0,000.00
Payments to
Suppliers
and
Employees
-
574120,00,00
0.00
-
596851,00,
000.00
-
609183,00,
000.00
-
611543,00,
000.00
-
618345,0
0,000.00
-
614748,0
0,000.00
Interest 268,00,000.00 222,00,000 98,00,000.0 0.00 0.00 0.00
⊘ This is a preview!⊘
Do you want full access?
Subscribe today to unlock all pages.
Trusted by 1+ million students worldwide
1 out of 20
Related Documents


Your All-in-One AI-Powered Toolkit for Academic Success.
+13062052269
info@desklib.com
Available 24*7 on WhatsApp / Email
![[object Object]](/_next/static/media/star-bottom.7253800d.svg)
Unlock your academic potential
Copyright © 2020–2026 A2Z Services. All Rights Reserved. Developed and managed by ZUCOL.