MBA403 Financial Analysis Report: Woolworths Group Analysis

Verified

Added on  2022/08/15

|11
|1471
|17
Report
AI Summary
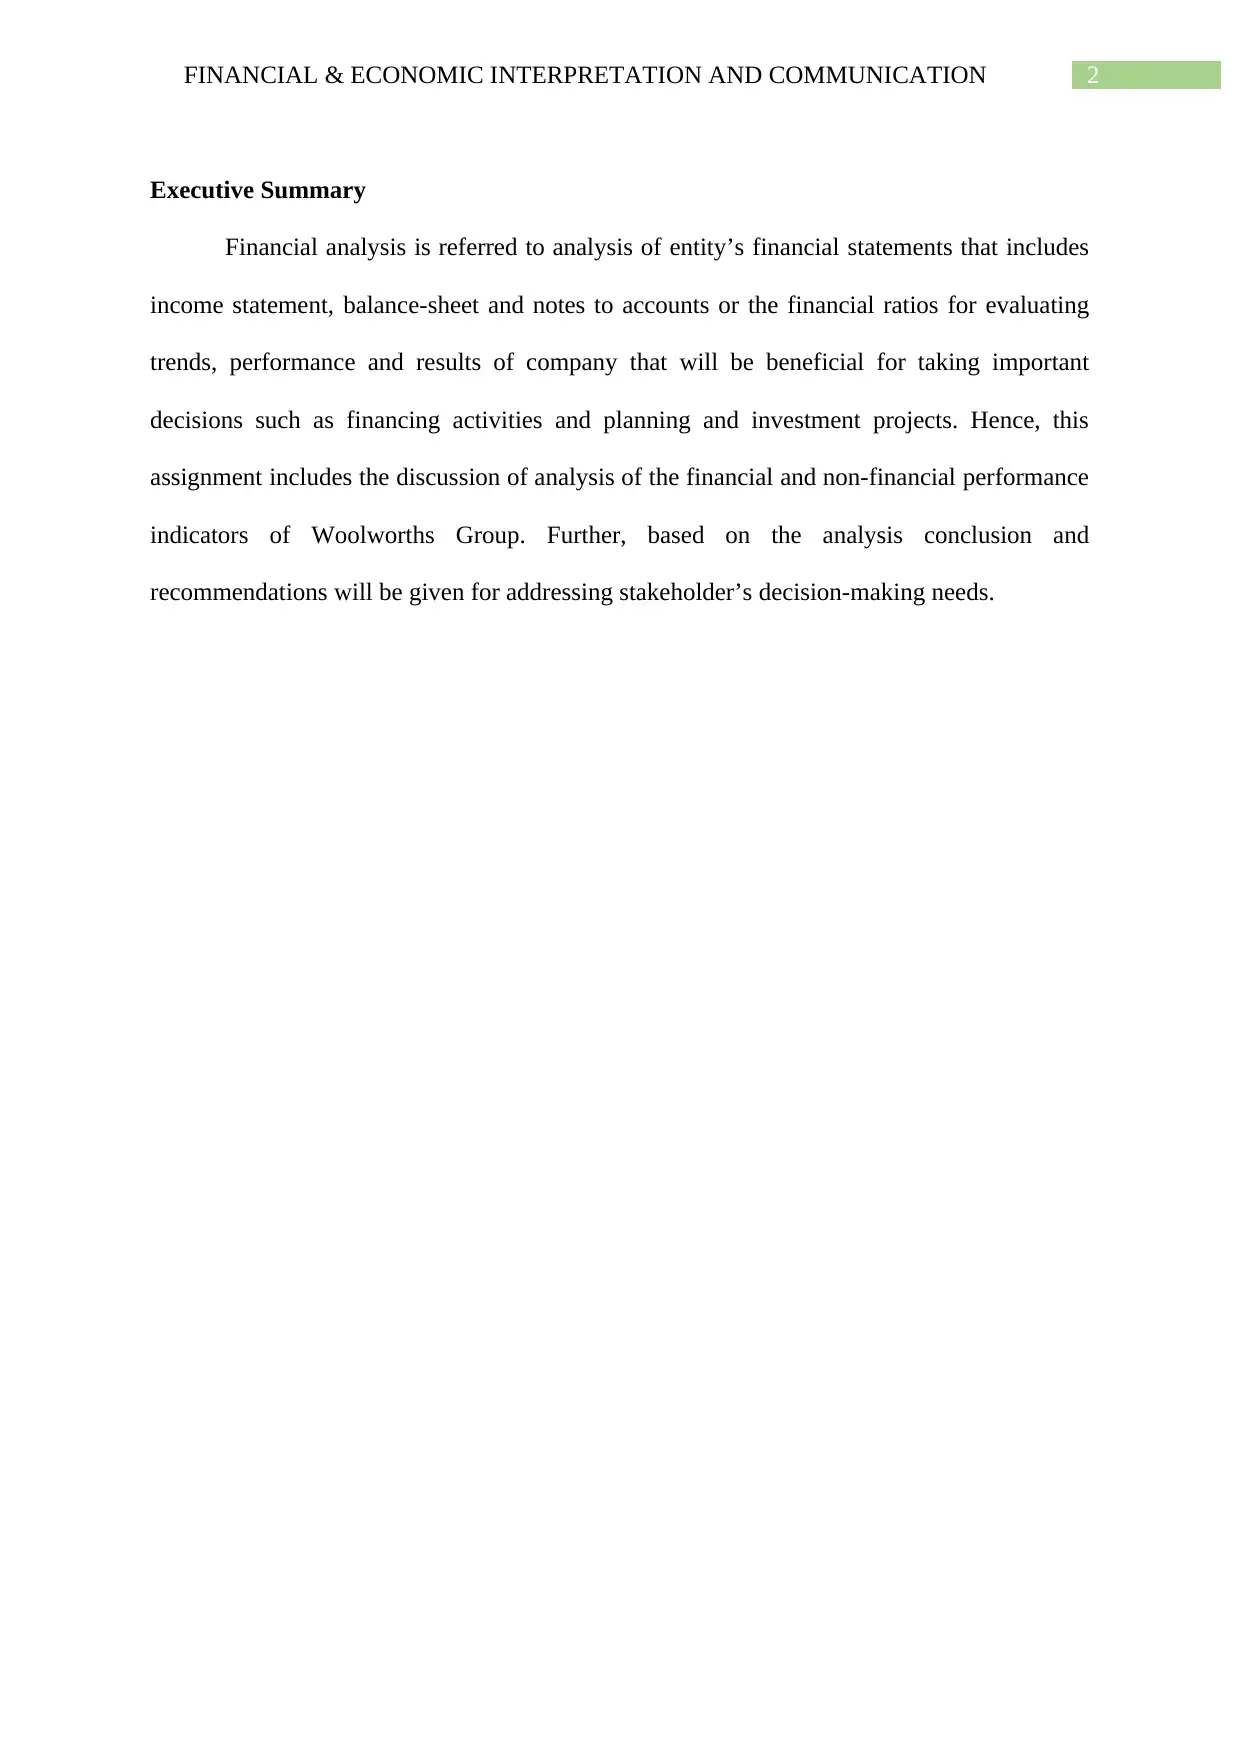
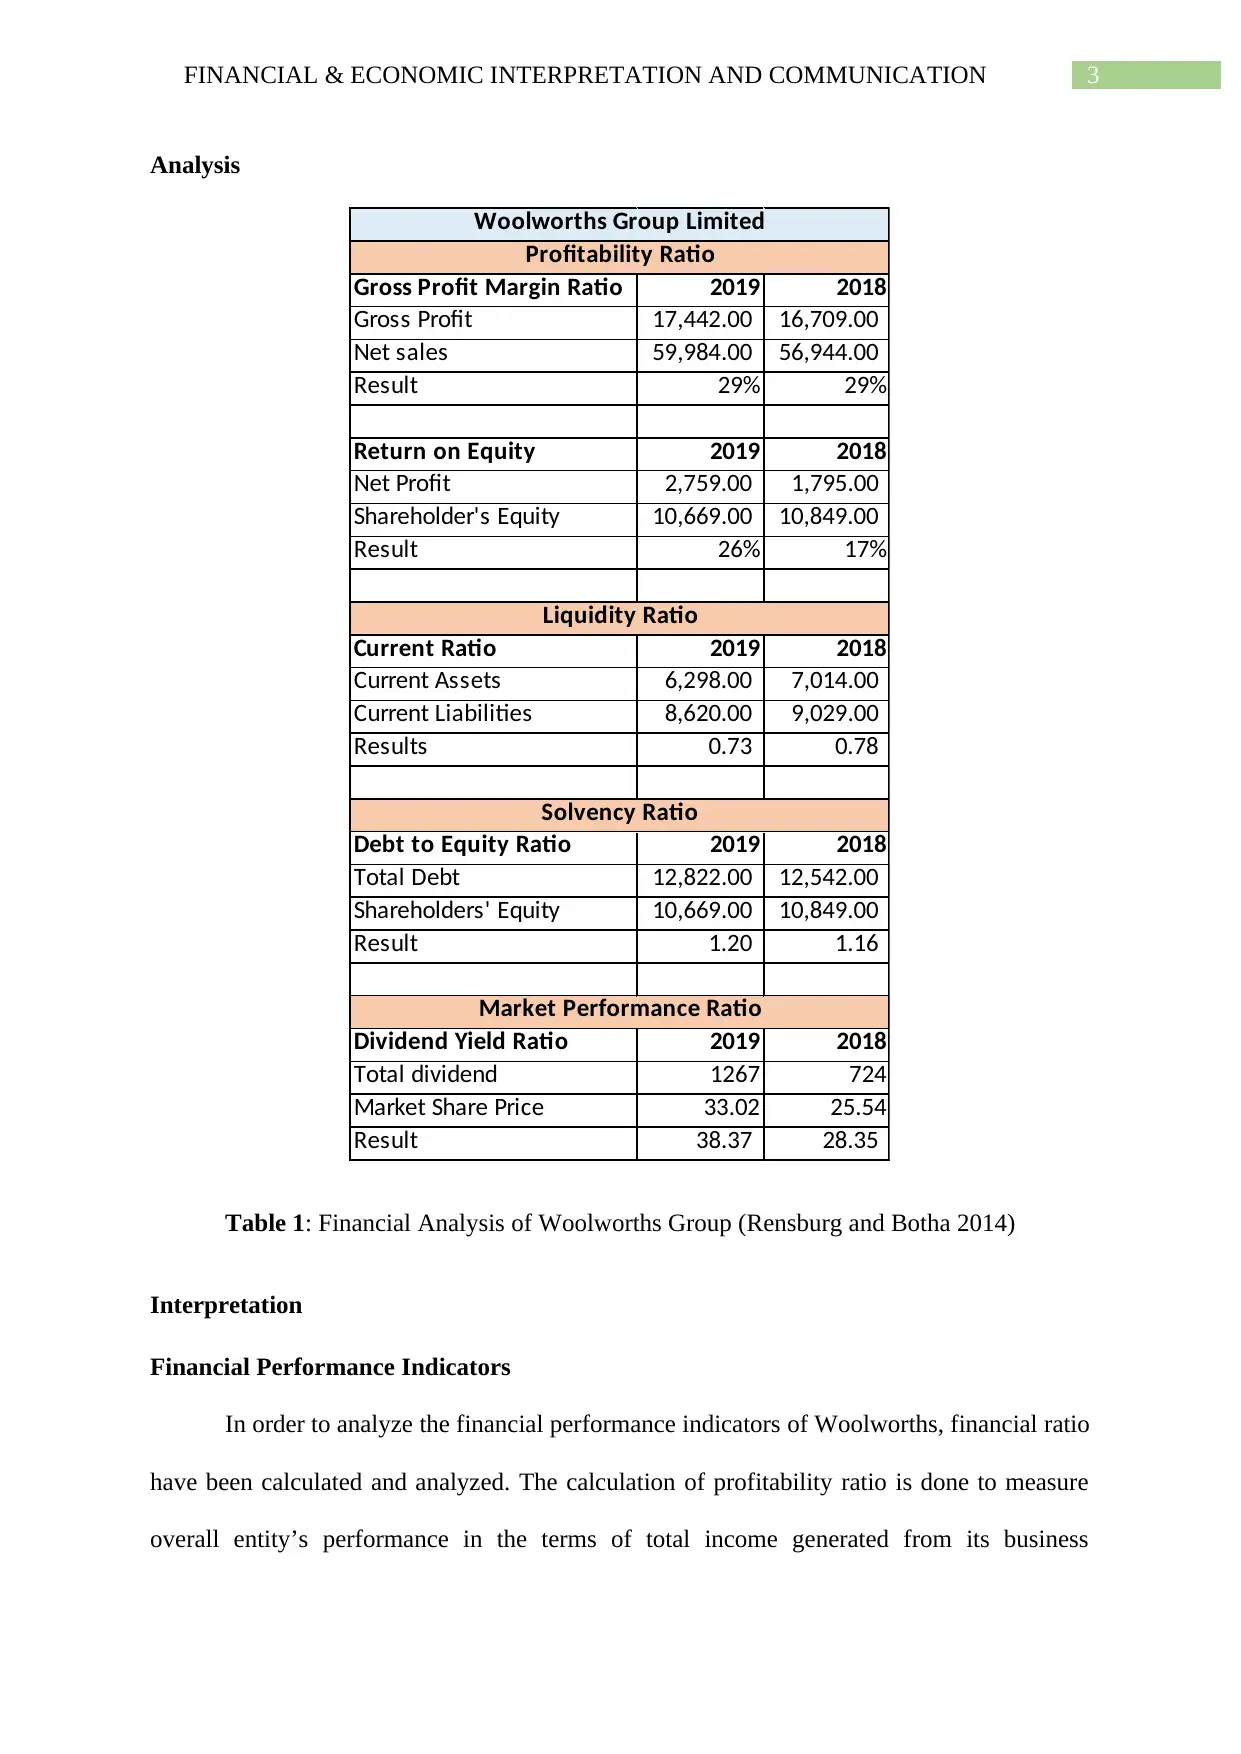
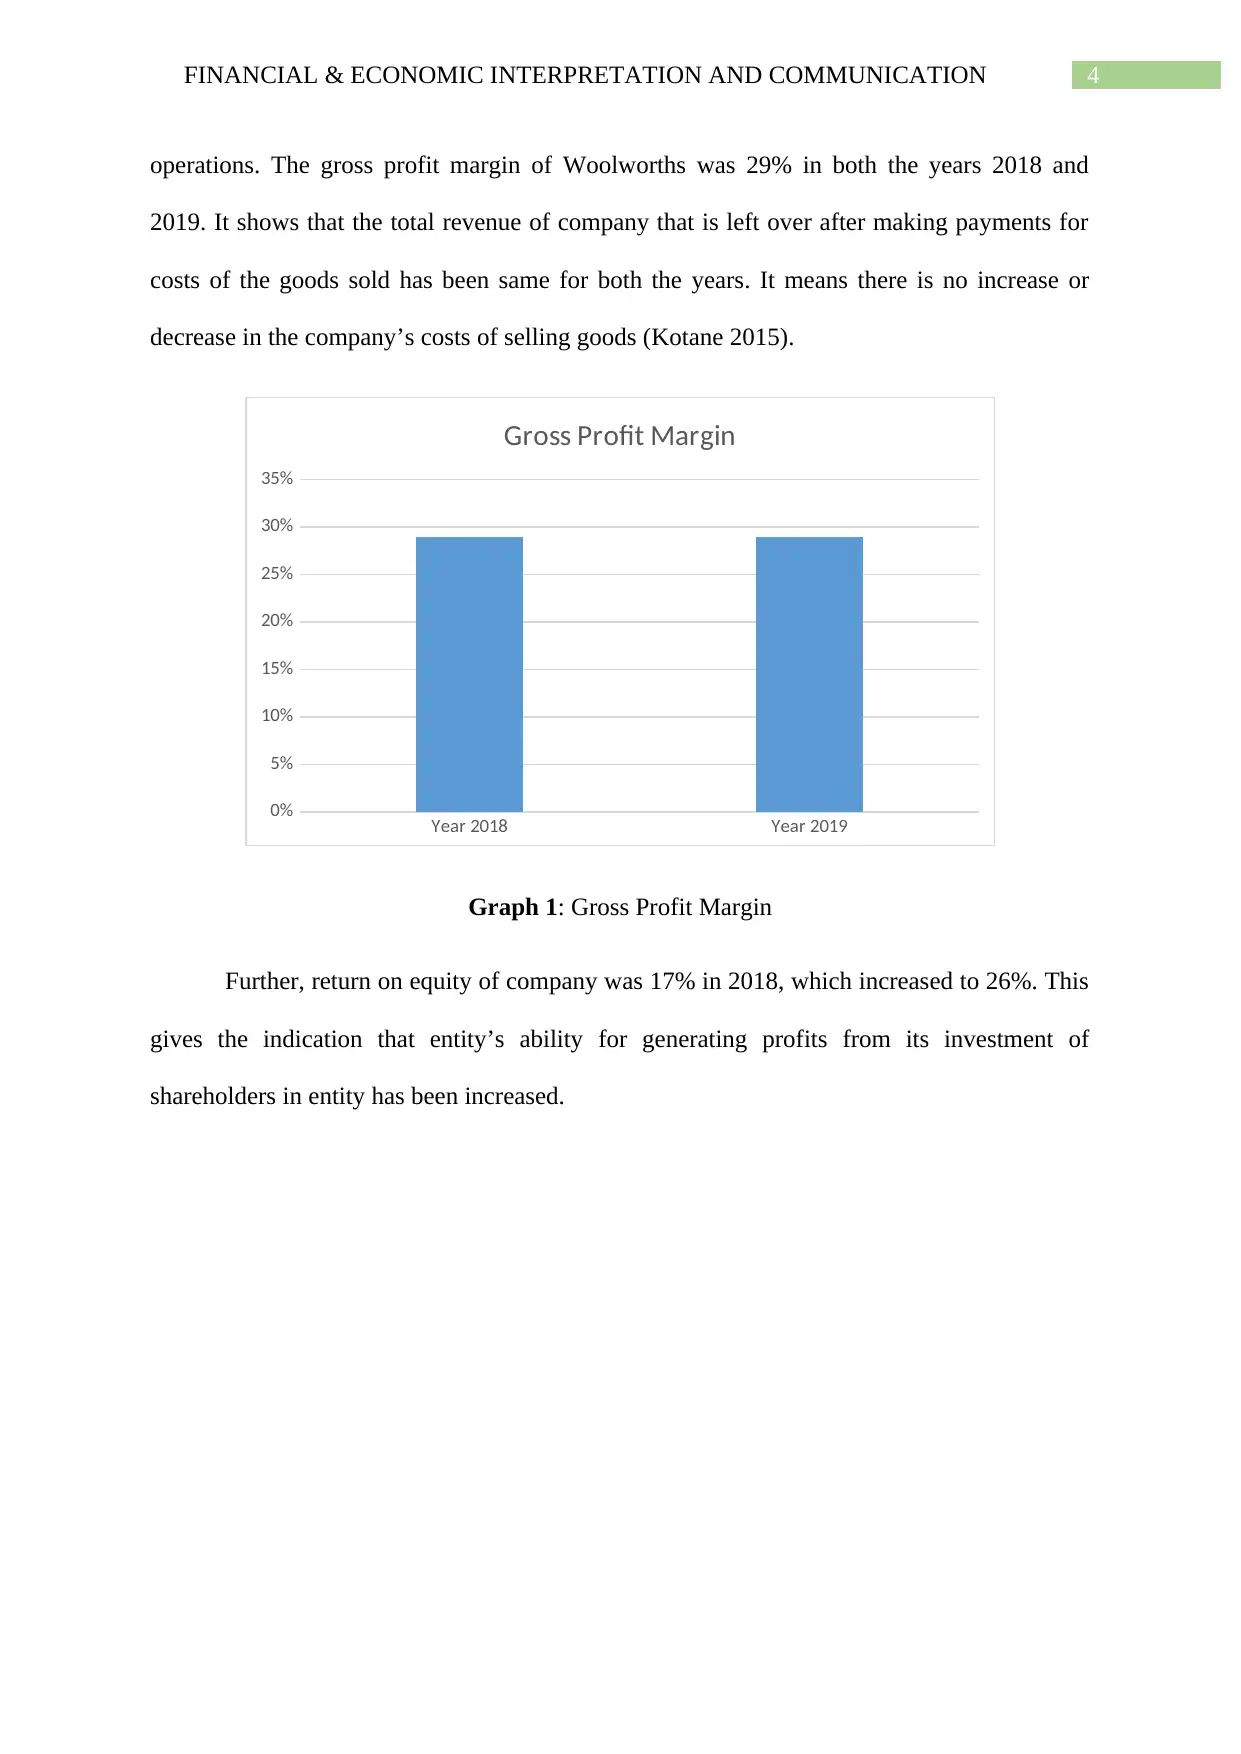
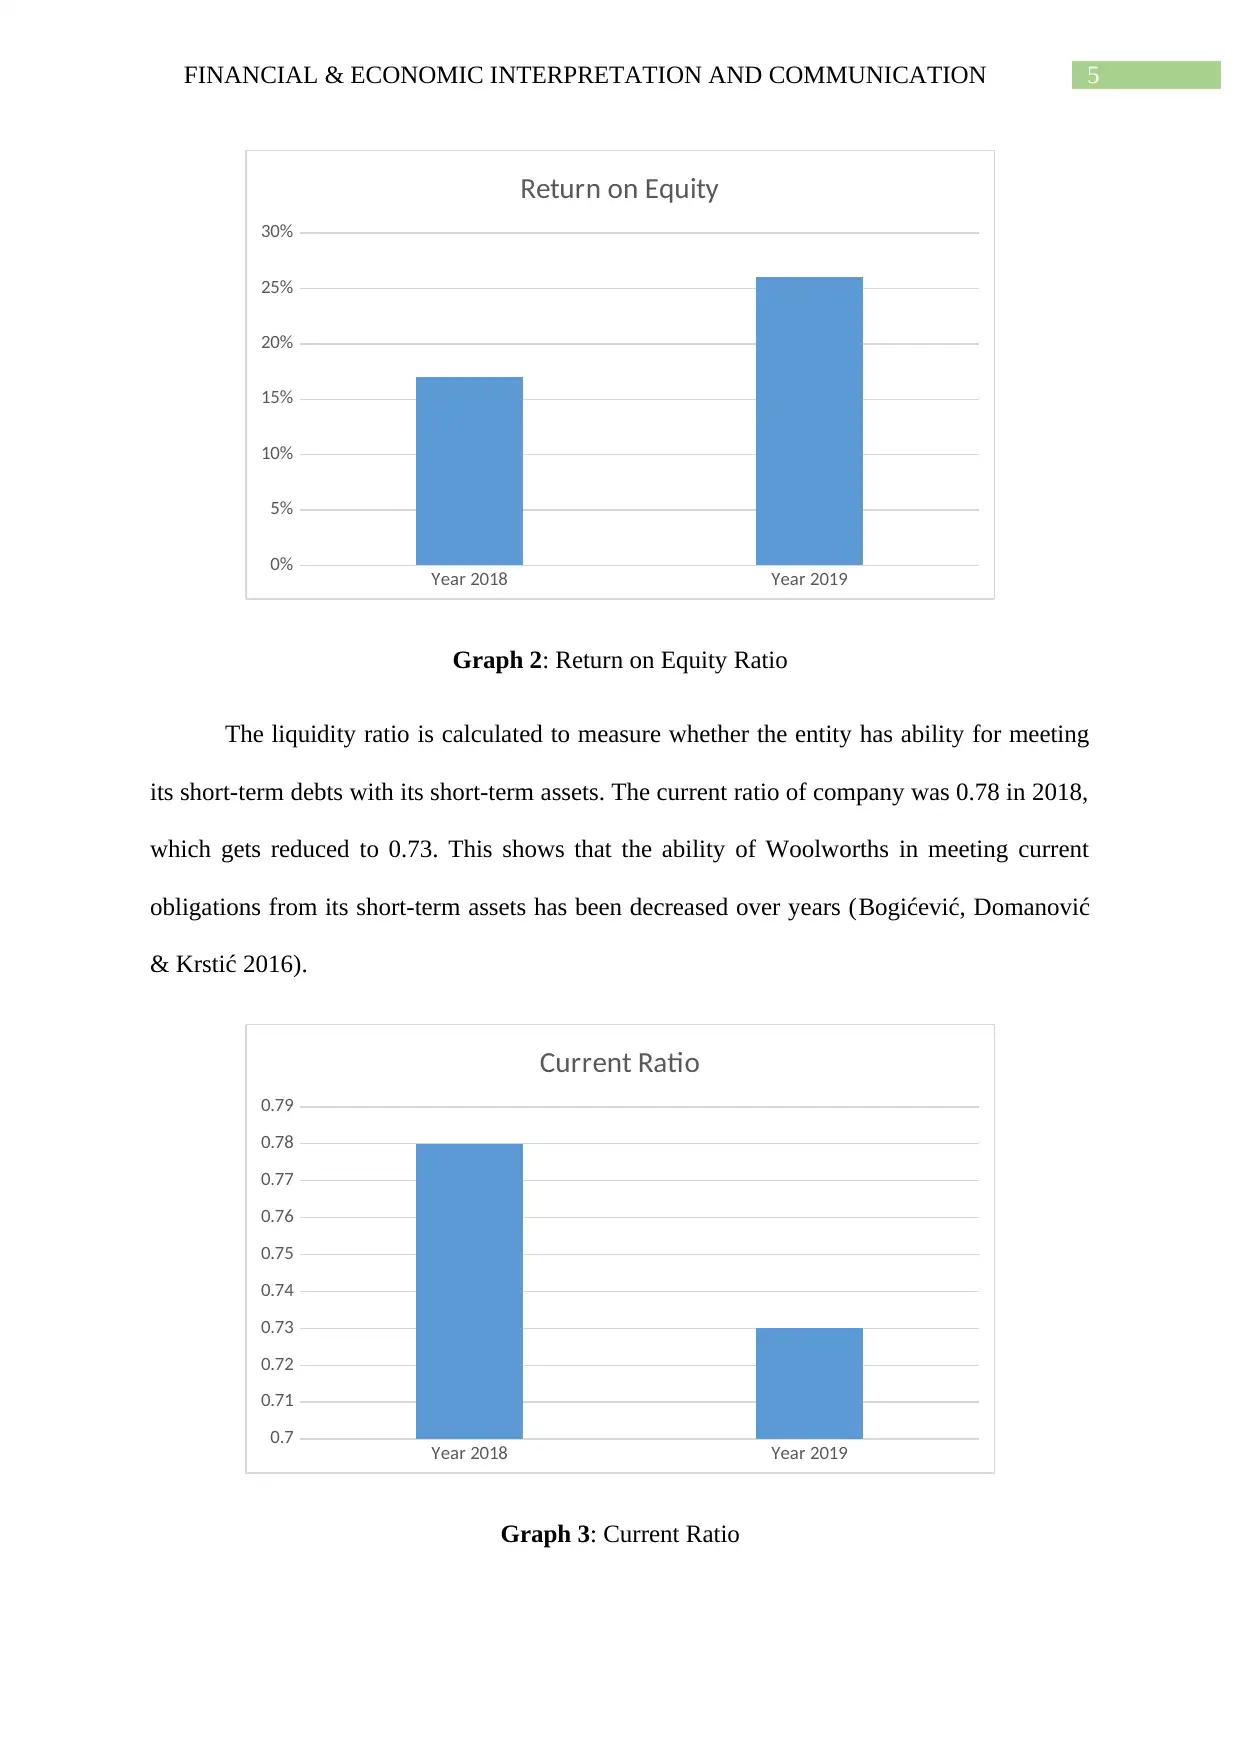
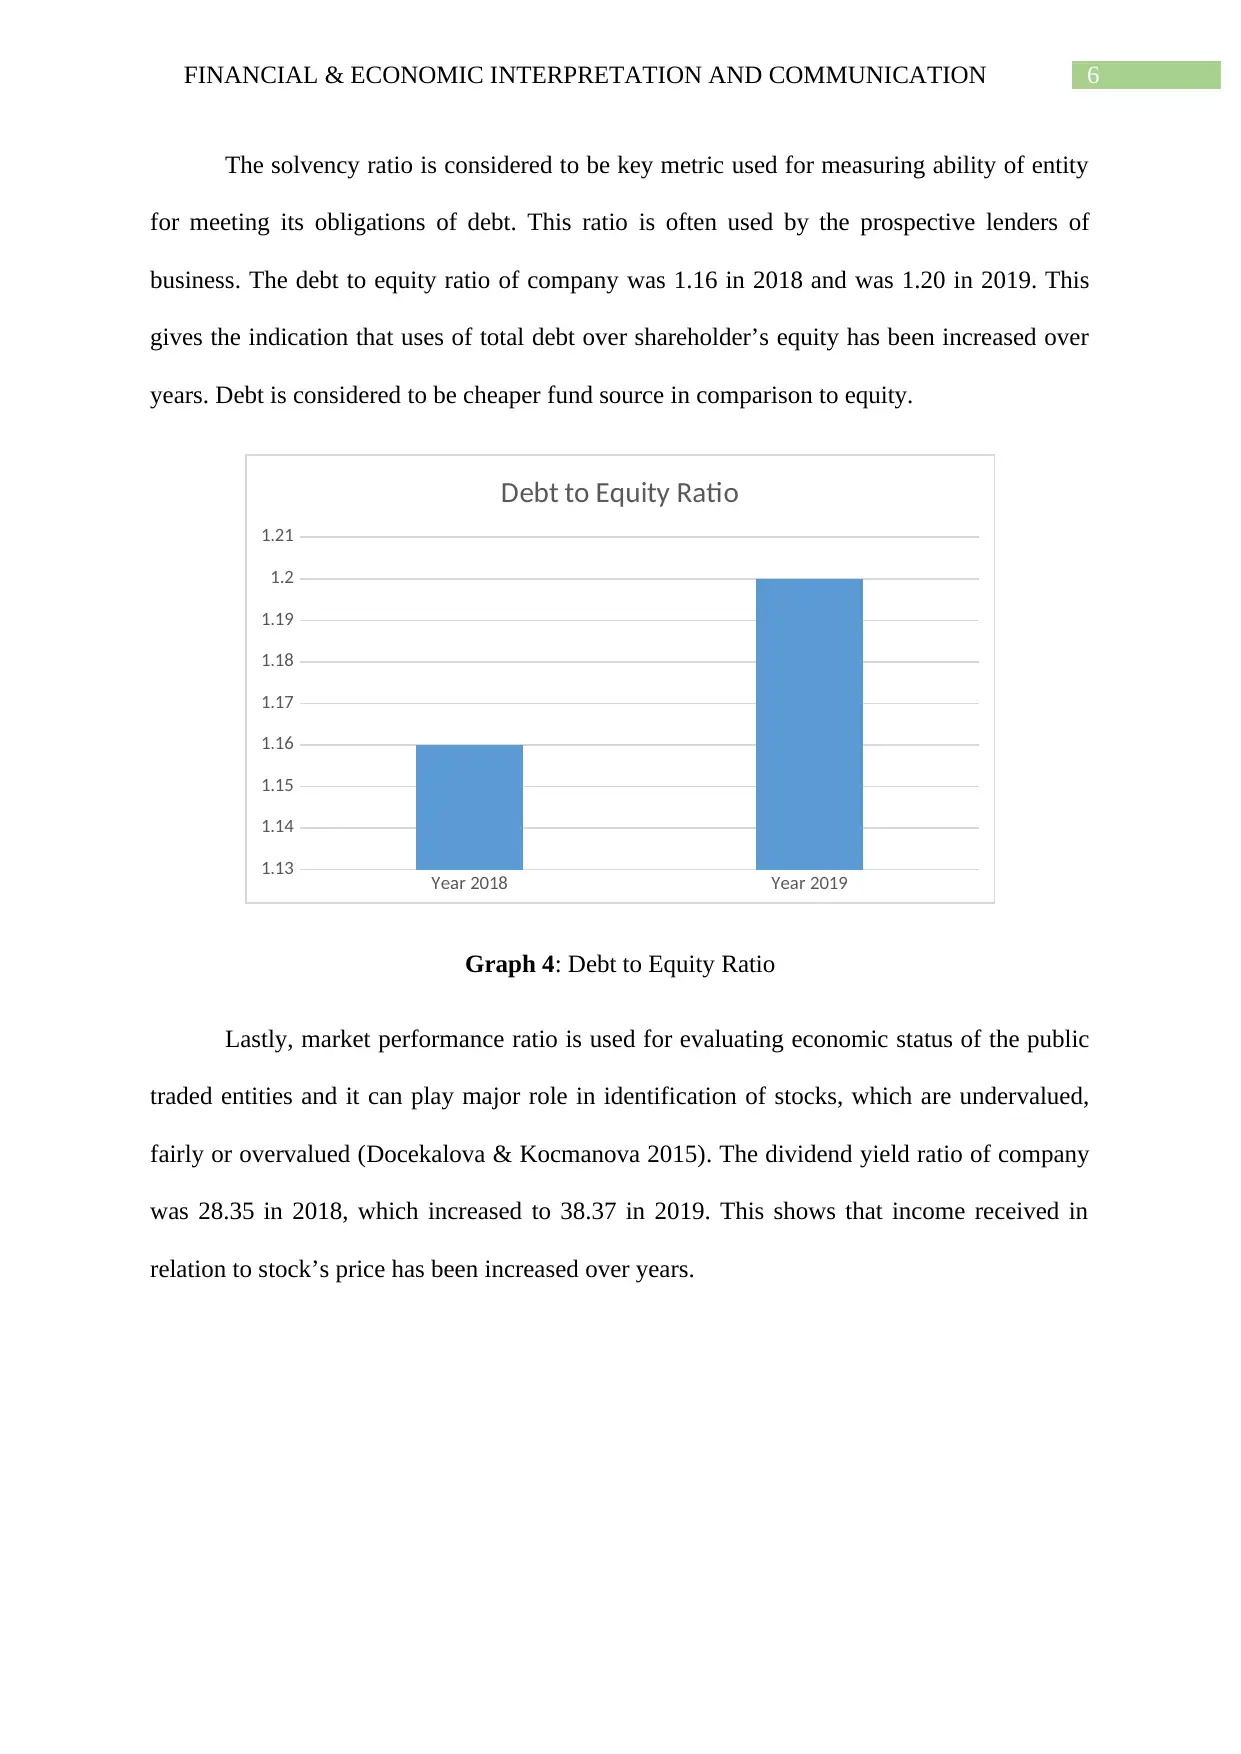
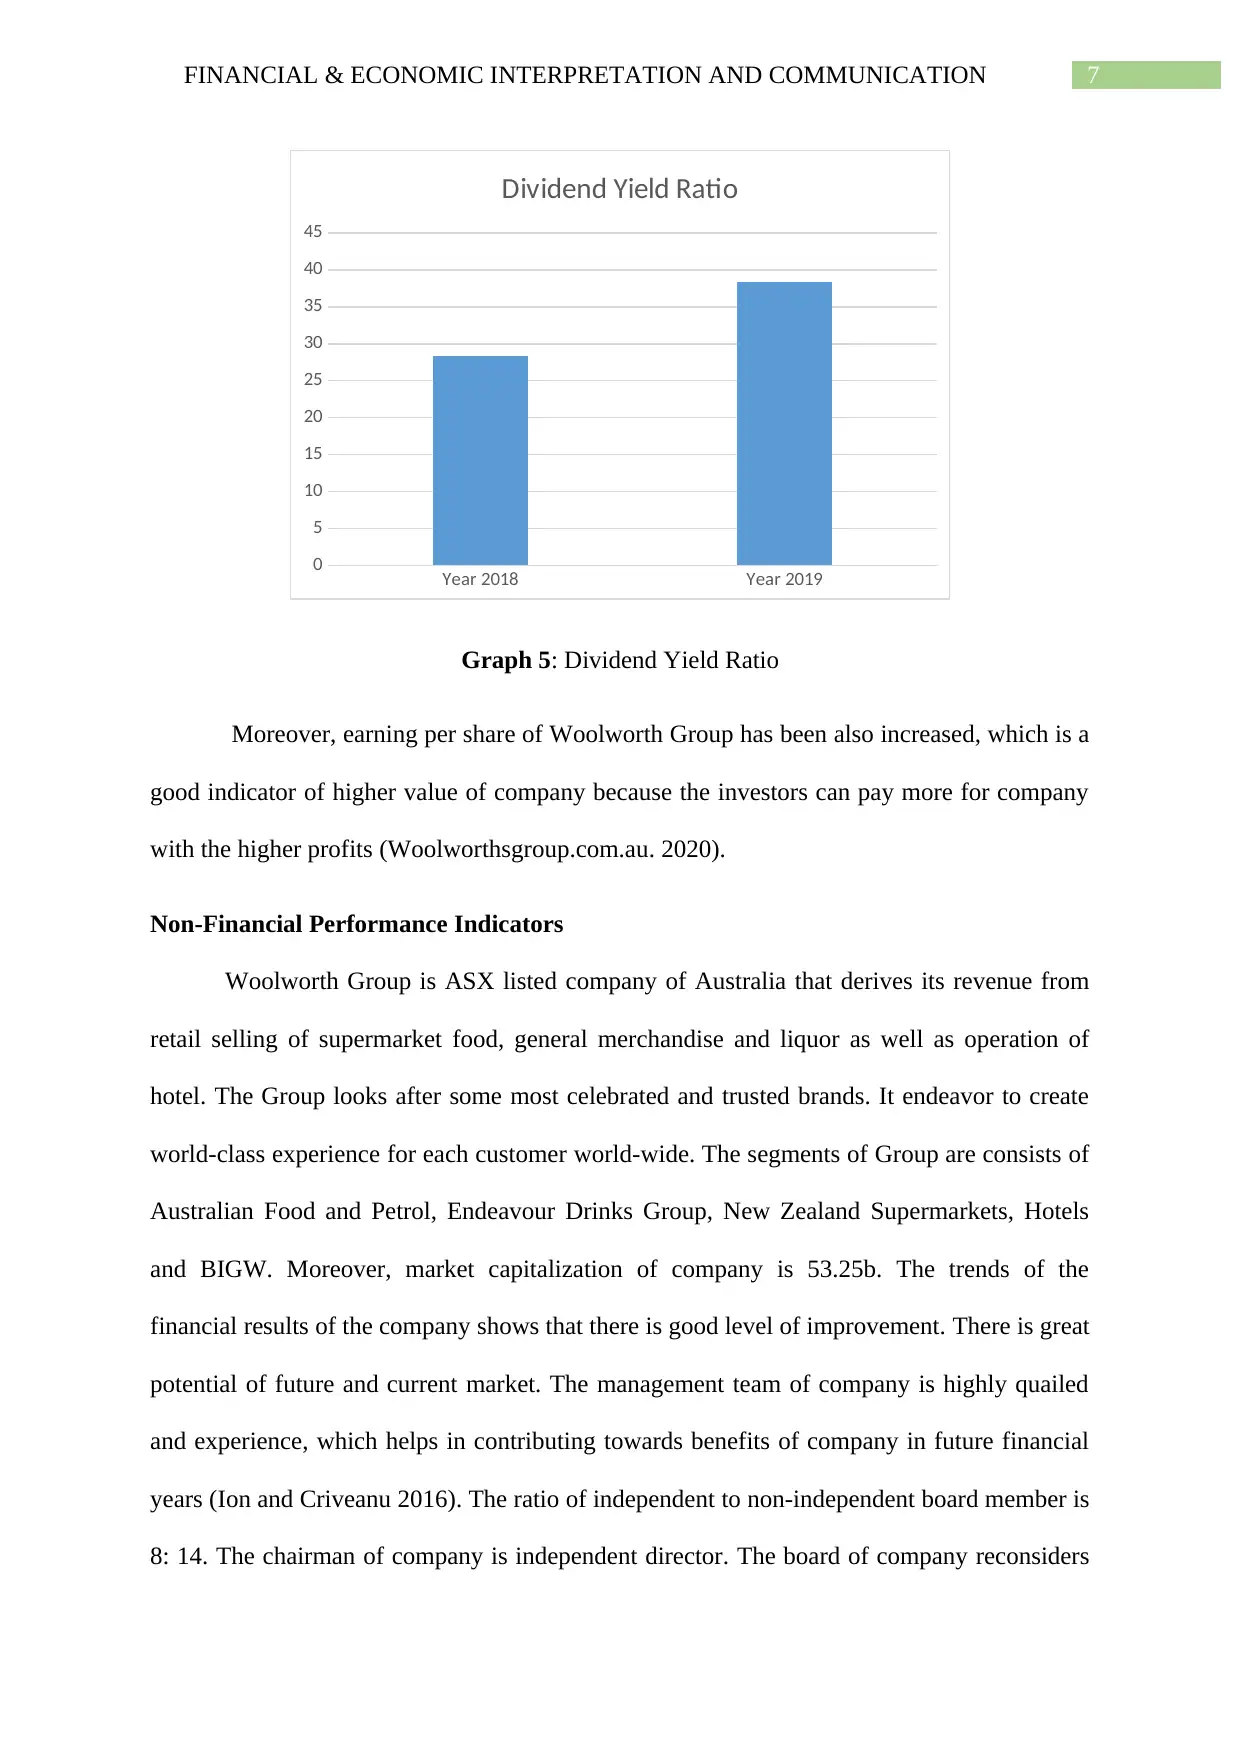
This report presents a financial analysis of Woolworths Group, examining its financial and non-financial performance indicators based on its annual report. The analysis includes calculations and interpretations of profitability, liquidity, solvency, and market performance ratios, such as gross profit margin, return on equity, current ratio, debt-to-equity ratio, and dividend yield. The report also considers non-financial aspects, including the company's market capitalization, corporate governance, and sustainability initiatives. The conclusion highlights the company's improved profitability and provides recommendations for potential shareholders, considering the company's financial stability, debt management, and market performance. The report suggests that investors should consider investing in Woolworths Group because of its increased profitability, stabilized costs, and favorable market performance.
Document Page
Running Head: FINANCIAL & ECONOMIC INTERPRETATION AND
COMMUNICATION
FINANCIAL & ECONOMIC INTERPRETATION AND COMMUNICATION
Name of the Student
Name of the University
Author Note
tabler-icon-diamond-filled.svg

Paraphrase This Document

Need a fresh take? Get an instant paraphrase of this document with our AI Paraphraser
Document Page
1FINANCIAL & ECONOMIC INTERPRETATION AND COMMUNICATION
Table of Contents
Executive Summary...................................................................................................................2
Analysis......................................................................................................................................3
Interpretation..............................................................................................................................3
Financial Performance Indicators..........................................................................................3
Non-Financial Performance Indicators..................................................................................7
Conclusion & Recommendations...............................................................................................8
Reference..................................................................................................................................10
Document Page
2FINANCIAL & ECONOMIC INTERPRETATION AND COMMUNICATION
Executive Summary
Financial analysis is referred to analysis of entity’s financial statements that includes
income statement, balance-sheet and notes to accounts or the financial ratios for evaluating
trends, performance and results of company that will be beneficial for taking important
decisions such as financing activities and planning and investment projects. Hence, this
assignment includes the discussion of analysis of the financial and non-financial performance
indicators of Woolworths Group. Further, based on the analysis conclusion and
recommendations will be given for addressing stakeholder’s decision-making needs.
Document Page
3FINANCIAL & ECONOMIC INTERPRETATION AND COMMUNICATION
Analysis
Gross Profit Margin Ratio 2019 2018
Gross Profit 17,442.00 16,709.00
Net sales 59,984.00 56,944.00
Result 29% 29%
Return on Equity 2019 2018
Net Profit 2,759.00 1,795.00
Shareholder's Equity 10,669.00 10,849.00
Result 26% 17%
Current Ratio 2019 2018
Current Assets 6,298.00 7,014.00
Current Liabilities 8,620.00 9,029.00
Results 0.73 0.78
Debt to Equity Ratio 2019 2018
Total Debt 12,822.00 12,542.00
Shareholders' Equity 10,669.00 10,849.00
Result 1.20 1.16
Dividend Yield Ratio 2019 2018
Total dividend 1267 724
Market Share Price 33.02 25.54
Result 38.37 28.35
Woolworths Group Limited
Liquidity Ratio
Profitability Ratio
Solvency Ratio
Market Performance Ratio
Table 1: Financial Analysis of Woolworths Group (Rensburg and Botha 2014)
Interpretation
Financial Performance Indicators
In order to analyze the financial performance indicators of Woolworths, financial ratio
have been calculated and analyzed. The calculation of profitability ratio is done to measure
overall entity’s performance in the terms of total income generated from its business
tabler-icon-diamond-filled.svg

Paraphrase This Document

Need a fresh take? Get an instant paraphrase of this document with our AI Paraphraser
Document Page
4FINANCIAL & ECONOMIC INTERPRETATION AND COMMUNICATION
operations. The gross profit margin of Woolworths was 29% in both the years 2018 and
2019. It shows that the total revenue of company that is left over after making payments for
costs of the goods sold has been same for both the years. It means there is no increase or
decrease in the company’s costs of selling goods (Kotane 2015).
Year 2018 Year 2019
0%
5%
10%
15%
20%
25%
30%
35%
Gross Profit Margin
Graph 1: Gross Profit Margin
Further, return on equity of company was 17% in 2018, which increased to 26%. This
gives the indication that entity’s ability for generating profits from its investment of
shareholders in entity has been increased.
Document Page
5FINANCIAL & ECONOMIC INTERPRETATION AND COMMUNICATION
Year 2018 Year 2019
0%
5%
10%
15%
20%
25%
30%
Return on Equity
Graph 2: Return on Equity Ratio
The liquidity ratio is calculated to measure whether the entity has ability for meeting
its short-term debts with its short-term assets. The current ratio of company was 0.78 in 2018,
which gets reduced to 0.73. This shows that the ability of Woolworths in meeting current
obligations from its short-term assets has been decreased over years (Bogićević, Domanović
& Krstić 2016).
Year 2018 Year 2019
0.7
0.71
0.72
0.73
0.74
0.75
0.76
0.77
0.78
0.79
Current Ratio
Graph 3: Current Ratio
Document Page
6FINANCIAL & ECONOMIC INTERPRETATION AND COMMUNICATION
The solvency ratio is considered to be key metric used for measuring ability of entity
for meeting its obligations of debt. This ratio is often used by the prospective lenders of
business. The debt to equity ratio of company was 1.16 in 2018 and was 1.20 in 2019. This
gives the indication that uses of total debt over shareholder’s equity has been increased over
years. Debt is considered to be cheaper fund source in comparison to equity.
Year 2018 Year 2019
1.13
1.14
1.15
1.16
1.17
1.18
1.19
1.2
1.21
Debt to Equity Ratio
Graph 4: Debt to Equity Ratio
Lastly, market performance ratio is used for evaluating economic status of the public
traded entities and it can play major role in identification of stocks, which are undervalued,
fairly or overvalued (Docekalova & Kocmanova 2015). The dividend yield ratio of company
was 28.35 in 2018, which increased to 38.37 in 2019. This shows that income received in
relation to stock’s price has been increased over years.
tabler-icon-diamond-filled.svg

Paraphrase This Document

Need a fresh take? Get an instant paraphrase of this document with our AI Paraphraser
Document Page
7FINANCIAL & ECONOMIC INTERPRETATION AND COMMUNICATION
Year 2018 Year 2019
0
5
10
15
20
25
30
35
40
45
Dividend Yield Ratio
Graph 5: Dividend Yield Ratio
Moreover, earning per share of Woolworth Group has been also increased, which is a
good indicator of higher value of company because the investors can pay more for company
with the higher profits (Woolworthsgroup.com.au. 2020).
Non-Financial Performance Indicators
Woolworth Group is ASX listed company of Australia that derives its revenue from
retail selling of supermarket food, general merchandise and liquor as well as operation of
hotel. The Group looks after some most celebrated and trusted brands. It endeavor to create
world-class experience for each customer world-wide. The segments of Group are consists of
Australian Food and Petrol, Endeavour Drinks Group, New Zealand Supermarkets, Hotels
and BIGW. Moreover, market capitalization of company is 53.25b. The trends of the
financial results of the company shows that there is good level of improvement. There is great
potential of future and current market. The management team of company is highly quailed
and experience, which helps in contributing towards benefits of company in future financial
years (Ion and Criveanu 2016). The ratio of independent to non-independent board member is
8: 14. The chairman of company is independent director. The board of company reconsiders
Document Page
8FINANCIAL & ECONOMIC INTERPRETATION AND COMMUNICATION
measures used for rewarding long and short-term performance, so that it reflects most
relevant value drivers in the business. However, company has made certain changes in their
measures of STI for the financial year 20. The framework of remunerations are designed for
supporting strategic priorities of Group, as it is aligned to the business objective and
expectations of market (Mĺkva 2014).
Good level of corporate governance is crucial to approach of Woolworths Group for
creating sustainable growth as well as enhancing long-term value of the shareholders. The
company follows recommendations of the third edition of “ASX Corporate Governance
Council’s Corporate Governance Principles and Recommendations” all through reporting
period. Further, company works together with team members, customers, suppliers and
community partners. It has made achievement across the sustainability agenda in financial
year 2019, including the work on risk associated with the change in climate and progress for
further improving responsible sourcing practices (Elzahar et al. 2015).
Conclusion & Recommendations
Therefore, this report concludes that the profitability ratio of Woolworths indicates
that ability of company in generating income out of its costs and investment has been
enhanced. The liquidity position of company shows that it has not enough short-term assets to
pay for short-term debts. The entity’s solvency ratio shows that the uses of debt is more in
comparison to shareholder’s equity. It is good because debt is cheaper source of fund. Lastly,
investors can buy the shares of company as there is higher dividend yield of company.
Woolworths pays dividend regularly and EPS is higher, which indicates greater value of
company and is good for the investors.
The potential shareholders of Woolworths Group are recommended to invest in
company because financial results of the company gives clear image that company’s
Document Page
9FINANCIAL & ECONOMIC INTERPRETATION AND COMMUNICATION
profitability has been increased. The company is able to stabilize the costs of its operations.
Moreover, the short-term assets of Woolworths Group has reduced and because of this it has
affected its liquidity position. In addition, the uses of debt by company is good indicator as it
is cheaper compared to other sources. Lastly, market performance of company is good
because of its increased value.
tabler-icon-diamond-filled.svg

Paraphrase This Document

Need a fresh take? Get an instant paraphrase of this document with our AI Paraphraser
Document Page
10FINANCIAL & ECONOMIC INTERPRETATION AND COMMUNICATION
Reference
Bogićević, J., Domanović, V., & Krstić, B. (2016). The role of financial and non-financial
performance indicators in enterprise sustainability evaluation. Ekonomika, 62(3), 1-13.
Docekalova, M., & Kocmanova, A. (2015). Evaluation of the effectiveness of manufacturing
companies by financial and non-financial indicators. Procedia-Social and Behavioral
Sciences, 213(1), 491-496.
Elzahar, H., Hussainey, K., Mazzi, F. and Tsalavoutas, I., 2015. Economic consequences of
key performance indicators' disclosure quality. International Review of Financial
Analysis, 39, pp.96-112.
Ion, E. I. and Criveanu, M., 2016. FINANCIAL AND NON-FINANCIAL INDICATORS
FOR ORGANIZATIONAL PERFORMANCE MEASUREMENT. Annals of the University
of Craiova, Economic Sciences Series, 1(44).
Kotane, I. (2015). Evaluating the importance of financial and non-financial indicators for the
evaluation of company’s performance. Management Theory and Studies for Rural Business
and Infrastructure Development, 37(1), 80-94.
Mĺkva, M., 2014. Introducing the non-financial indicators into the enterprise
evaluation. Journal of US-China Public Administration, 11(3), 287-292.
Rensburg, R. and Botha, E., 2014. Is integrated reporting the silver bullet of financial
communication? A stakeholder perspective from South Africa. Public Relations
Review, 40(2), pp.144-152.
Woolworthsgroup.com.au. 2020. Retrieved 5 February 2020, from
https://www.woolworthsgroup.com.au/icms_docs/195582_annual-report-2019.pdf
chevron_up_icon
1 out of 11
circle_padding
hide_on_mobile
zoom_out_icon
[object Object]