Woolworths Group Limited Financial Performance Report 2013-2017
VerifiedAdded on 2023/06/07
|22
|3972
|70
Report
AI Summary
This report presents a comprehensive financial analysis of Woolworths Group Limited for the period 2013 to 2017. It utilizes ratio analysis, including profitability, liquidity, and efficiency ratios, to assess the company's financial performance and position. The analysis covers key aspects such as return on assets, net profit margin, gross profit margin, current ratio, and quick ratio. The report identifies trends, compares the company's performance against industry benchmarks, and provides recommendations for improvement, focusing on enhancing profitability, managing liquidity, and improving operational efficiency. The analysis also considers the company's compliance with corporate governance principles and the roles of its various committees.
FINANCIAL ANALYSIS
REPORT
WOOLWORTHS GROUP LIMITED.
REPORT
WOOLWORTHS GROUP LIMITED.
Paraphrase This Document
Need a fresh take? Get an instant paraphrase of this document with our AI Paraphraser
Executive Summary
This is an independent analysis of the financial performance and position of Woolworths Group
Limited for the five year period 2013 to 2017 as requested by the board of directors. It is a report
on the findings achieved after the analysis of the company’s financial statements including the
statement of financial position, Income statement and the cash flow statement. The study of the
various elements in the individual statements will gave insight on how well the company was
performing i.e. whether the company improved, dropped or stagnated in its performance in a
particular area as far as performance is concerned and the best explanation for any of the
performance pattern that might have been noted. The trend analysis had focus on 2017 the base
and most current year as this is the year that indicated the final trend from the review of the rest
of the period. Ratio analysis played a vital role in the analysis as it helped to specifically identify
relationship between various elements in the financial statements that projected the company’s
performance. The report further gives recommendations after evaluation of the various critical
performance indicators that helped correct deviations and also appraised elements that enhanced
performance.
Table of Contents
1. Introduction.............................................................................................................................................4
1.1 Authorization.....................................................................................................................................4
1.2 Limitations.........................................................................................................................................4
1.3 Report Objective and scope...............................................................................................................4
2. Company Profile......................................................................................................................................5
3. Ratio analysis..........................................................................................................................................6
3.1 Profitability analysis..........................................................................................................................6
3.1.1 Return on Assets..................................................................................................................6
3.1.2 Net Profit Margin........................................................................................................................7
3.1.3 Gross Profit Margin....................................................................................................................9
3.3 Efficiency Ratios.............................................................................................................................13
3.3.1 Inventory Turnover...................................................................................................................13
4. Overall Industry Analysis.....................................................................................................................17
Recommendations.....................................................................................................................................18
References.................................................................................................................................................19
⊘ This is a preview!⊘
Do you want full access?
Subscribe today to unlock all pages.
Trusted by 1+ million students worldwide
1. Introduction
1.1 Authorization
This report has been prepared as requested and authorized by the board of directors of
Woolworths Group Limited. The report is thus addressed to them for the corrective action to be
undertaken.
1.2 Limitations
This report specifically gives analysis from the study of the financial statements for the 5 year as
given in the company’s website.
1.3 Report Objective and scope
The report compares the financial performance of Woolworths Group Limited with focus on the;
Profitability indicators of the company.
The company’s Liquidity i.e. how well the company is set to repay its debt.
The company’s efficiency in its operations.
The company’s financial structure that determine its leverage level.
The report interprets the elements of the financial statement using ratio analysisthrough
evaluation of critical elements in the statements that affect performance in one way or another.
The financial statements include:
The income statement.
This financial statement is an important element as it shows how the revenue generated by
the company over the 5 year period as well as enlisting the expenses that was incurred and
ultimately states the profit that was made from operations.
Balance sheet.
This financial statement stated the assets (What the company owns) and the liabilities (What
the company owes others) as well as the shareholders stake or equity in the company. In brief
it indicates the company’s financing structure.
Cash flow statement.
This statement broke down the Company’s receipts (Money Received) and company’s
payments made over given period of time. It indicates important financing, operating and
investing activities incurred by a company for a given financial period.
Although evaluation of performance of a company for a number of periods is essential, the
findings make more sense if the results are compared by another company in the same industry
to determine whether it is operating profitably as far as the overall industry is concerned. The
reports will thus asses the competitors in the industry that the industry belongs to (the retailing
industry) and gives recommendations from the finding.
Paraphrase This Document
Need a fresh take? Get an instant paraphrase of this document with our AI Paraphraser
2. Company Profile
Woolworths Group Limited formerly known as Woolworths Limited is an Australian Company
listed the Australian Securities Exchange and was founded in 1924. Woolworths Limited
operates retail stores and thus falls in the category of retailing industry.
It is the second largest company in Australia in terms of revenue and the second largest in New
Zealand. It operates more than 3200 stores in both New Zealand and Australia and is involved in
the following businesses:
Liquor stores such as BWS and Dan Murphy’s.
Supermarkets under numerous banners such as Food town, Thomas Dux and
Woolworths.
Sale of gasoline.
Runs consumer electronic shops under the brand names of Dick Smith and Tandy.
It runs 165 odd general merchandise that operates the name of Big W.
Operates nearly 300 hotels. Among others.
Woolworth’s group limited has Coles Supermarket, The distributors and ALDI Einkauf as some
of its top competitors.
Woolworths Group Limited complies with ASX corporate governance principles which help
them to achieve long term shareholder value.
It is governed by a board of directors which has a function to provide the strategic direction to be
followed in the achievement of company goals. The board has the following committees that
help them in carrying out there responsibility as well as gaining advice from them. This are:
The Audit, Risk and Compliance Committee.
The People Performance Committee.
The Sustainability committee.
The Nomination Committee.
These committees have specific set responsibility which they carry out and in the end contribute
to the overall success of the board.
3. Ratio analysis.
The financial statements were interpreted in the following classes of ratios.
3.1 Profitability analysis
Profitability analysis was done by the use of the following profitability ratios;
Return on assets (ROA)
Net profit margin
Gross profit margin
These ratios attempted to show how efficient the company has been in the utilization of the
resources at its disposal to generate income relative to the expenses incurred (Balogh 2017).
3.1.1 Return on Assets.
This indicated the profits generated from the assets the company had.
ROA= Net Profit
Average Assets.
Average assets = Current years assets value + Previous Years Assets
2
ROA Calculations
2017= 1482000* 100 = 6.39%
23209000
2016= 840100 * 100 = 3.44%
24419500
2015= 2137400 * 100 = 8.63%
24771000
2014 = 2458400 * 100 = 10.58%
23227700
2013 = 2254900 * 100 = 10.29%
21915650
⊘ This is a preview!⊘
Do you want full access?
Subscribe today to unlock all pages.
Trusted by 1+ million students worldwide
2017 2016 2015 2014 2013
0.00%
2.00%
4.00%
6.00%
8.00%
10.00%
12.00%
ROA
ROA
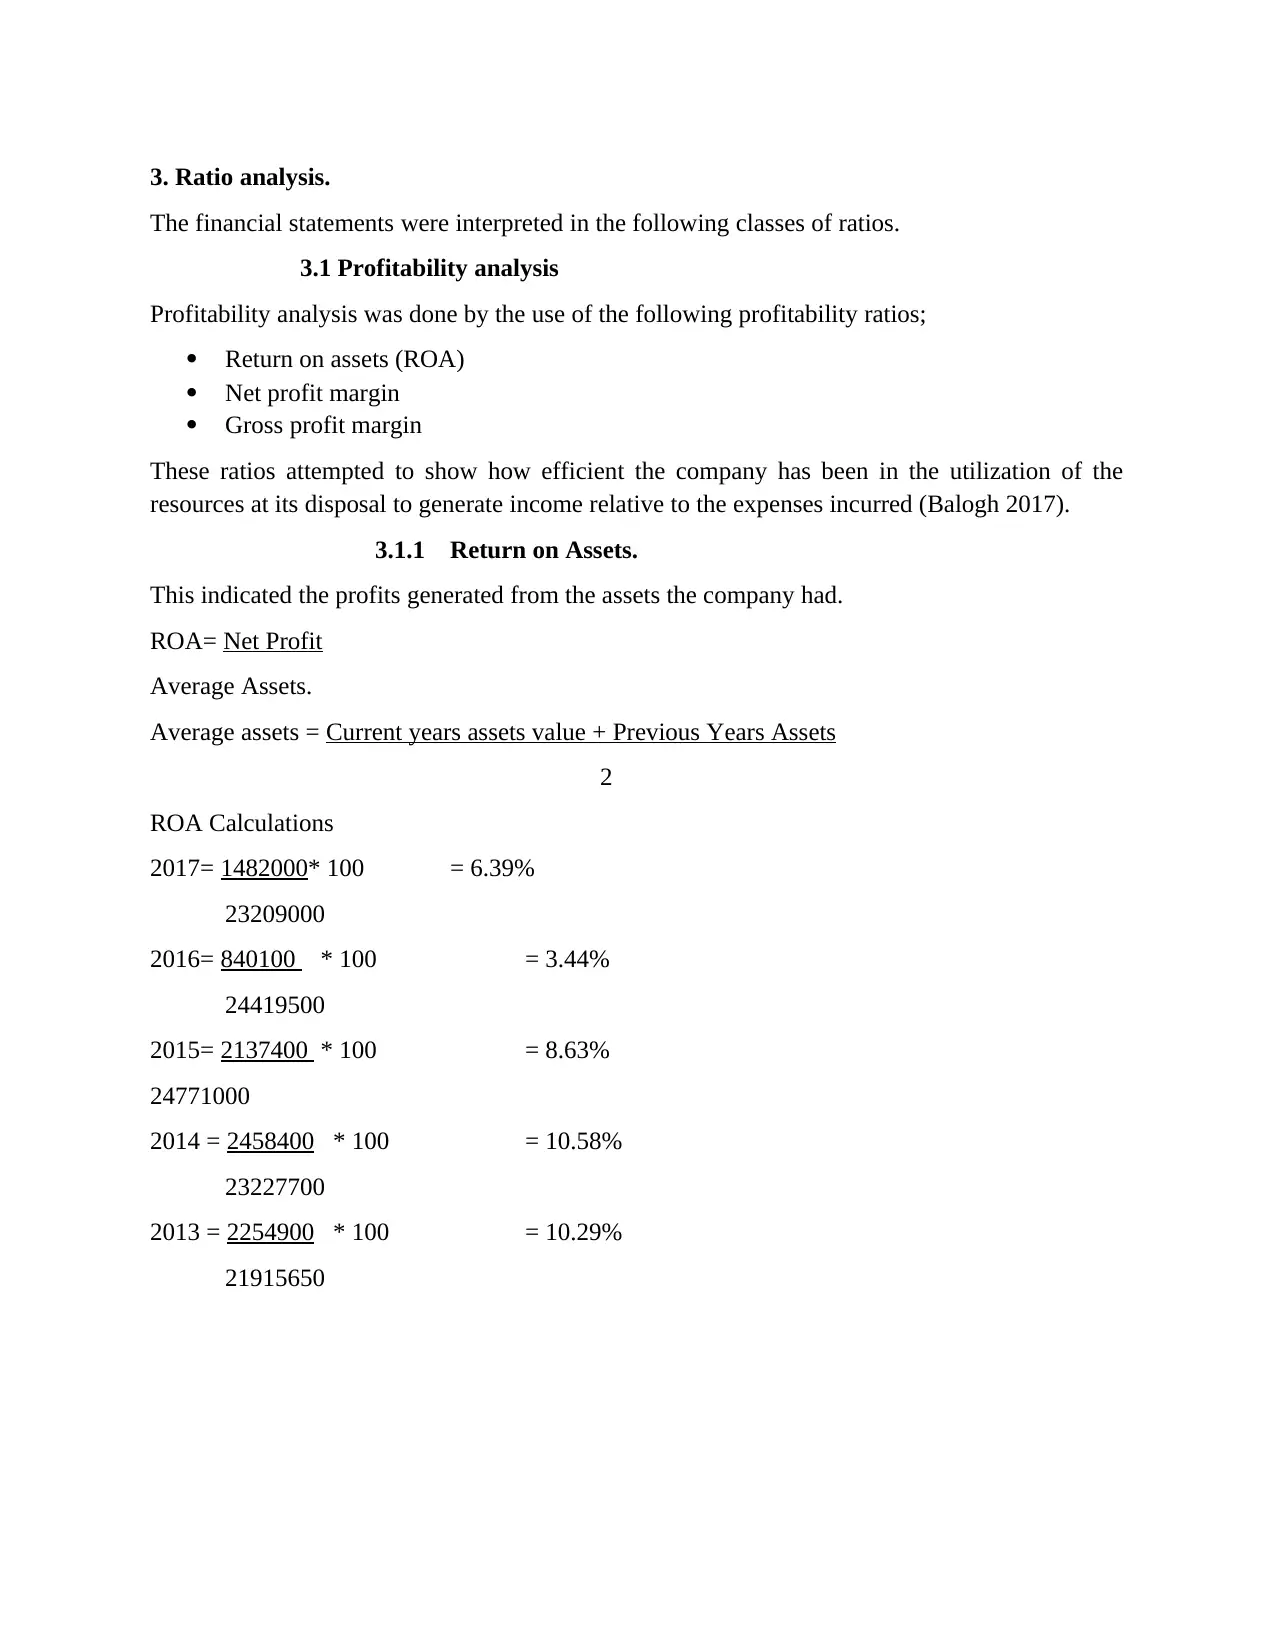
The return on assets was highest in 2014 with a percentage of 10.58%. For the remaining 4 years
the ROA went down meaning the company’s operations went down as far as ROA is concerned.
It can be said that the set ROA for the company for the 5year period as per the trend analysis was
10.58% and the company is at its best performance if it is operating at this value.
The average ROA for the company for the 5 year period was 7.866% and thus in years 2017,
2016 and 2014 the company was operating below its average and thus low performance.
To maintain and achieve this level of ROA the company should do an assessment on the
productivity of its assets and do away with obsolete assets that do not aid in income generation
(Collier 2015). It should also aim to generate more revenue and cut down on variable expenses
as they directly affect the profits and result to low ROA levels.
3.1.2 Net Profit Margin
This indicated what the company generated from its sales after deduction of its expenses.
Net Profit Margin = Net Profit
Sales (Revenue)
Calculations:
2017 = 1482000 * 100 = 2.66 %
55668600
2016 = 840100 * 100 = 1.44 %
58275500
0.00%
2.00%
4.00%
6.00%
8.00%
10.00%
12.00%
ROA
ROA
The return on assets was highest in 2014 with a percentage of 10.58%. For the remaining 4 years
the ROA went down meaning the company’s operations went down as far as ROA is concerned.
It can be said that the set ROA for the company for the 5year period as per the trend analysis was
10.58% and the company is at its best performance if it is operating at this value.
The average ROA for the company for the 5 year period was 7.866% and thus in years 2017,
2016 and 2014 the company was operating below its average and thus low performance.
To maintain and achieve this level of ROA the company should do an assessment on the
productivity of its assets and do away with obsolete assets that do not aid in income generation
(Collier 2015). It should also aim to generate more revenue and cut down on variable expenses
as they directly affect the profits and result to low ROA levels.
3.1.2 Net Profit Margin
This indicated what the company generated from its sales after deduction of its expenses.
Net Profit Margin = Net Profit
Sales (Revenue)
Calculations:
2017 = 1482000 * 100 = 2.66 %
55668600
2016 = 840100 * 100 = 1.44 %
58275500
Paraphrase This Document
Need a fresh take? Get an instant paraphrase of this document with our AI Paraphraser
2015 = 2137400 *100 = 3.51%
60868400
2014 = 2458400 * 100 = 4.03%
60952200
2013 = 2254900 * 100 = 3.84 %
58674100
2017 2016 2015 2014 2013
0.00%
0.50%
1.00%
1.50%
2.00%
2.50%
3.00%
3.50%
4.00%
4.50%
Profit Margin
Profit Margin
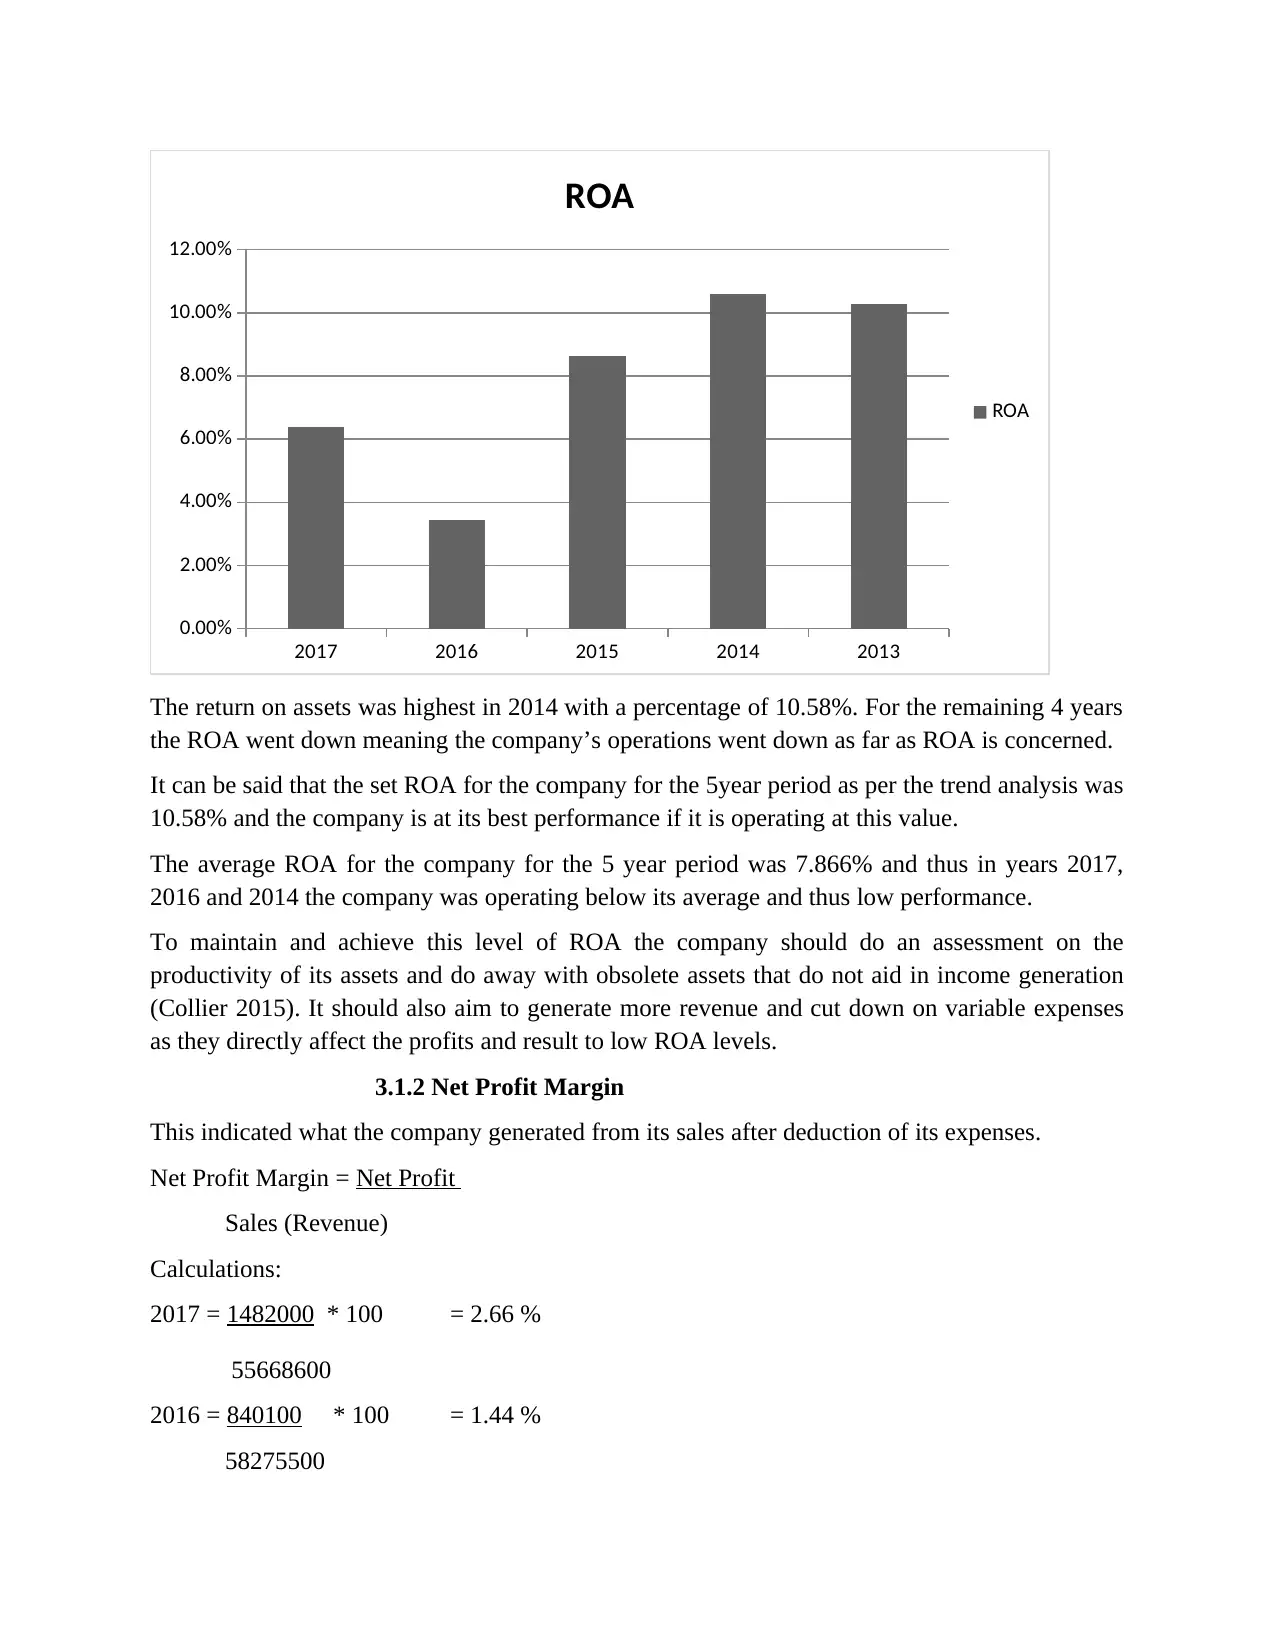
The average profit margin for the 5 year period was 3.096%.
Thus it can be said that the Company’s operation went down in 2017 and 2016 which was below
the Company’s average.
The Company’s best performance was in 2014 with 4.03% profit margin and the company
should strive to achieve this set margin to be at its best performance.
The company will maintain a high profit margin by increasing revenue value. This may achieved
through review of prices to be at per with competitors, provide better quality goods as opposed to
competitors so as to attract more customers. Expenses directly reduce the profit margin level and
thus should be maintained at the lowest favorable level(Maynard 2017).
60868400
2014 = 2458400 * 100 = 4.03%
60952200
2013 = 2254900 * 100 = 3.84 %
58674100
2017 2016 2015 2014 2013
0.00%
0.50%
1.00%
1.50%
2.00%
2.50%
3.00%
3.50%
4.00%
4.50%
Profit Margin
Profit Margin
The average profit margin for the 5 year period was 3.096%.
Thus it can be said that the Company’s operation went down in 2017 and 2016 which was below
the Company’s average.
The Company’s best performance was in 2014 with 4.03% profit margin and the company
should strive to achieve this set margin to be at its best performance.
The company will maintain a high profit margin by increasing revenue value. This may achieved
through review of prices to be at per with competitors, provide better quality goods as opposed to
competitors so as to attract more customers. Expenses directly reduce the profit margin level and
thus should be maintained at the lowest favorable level(Maynard 2017).
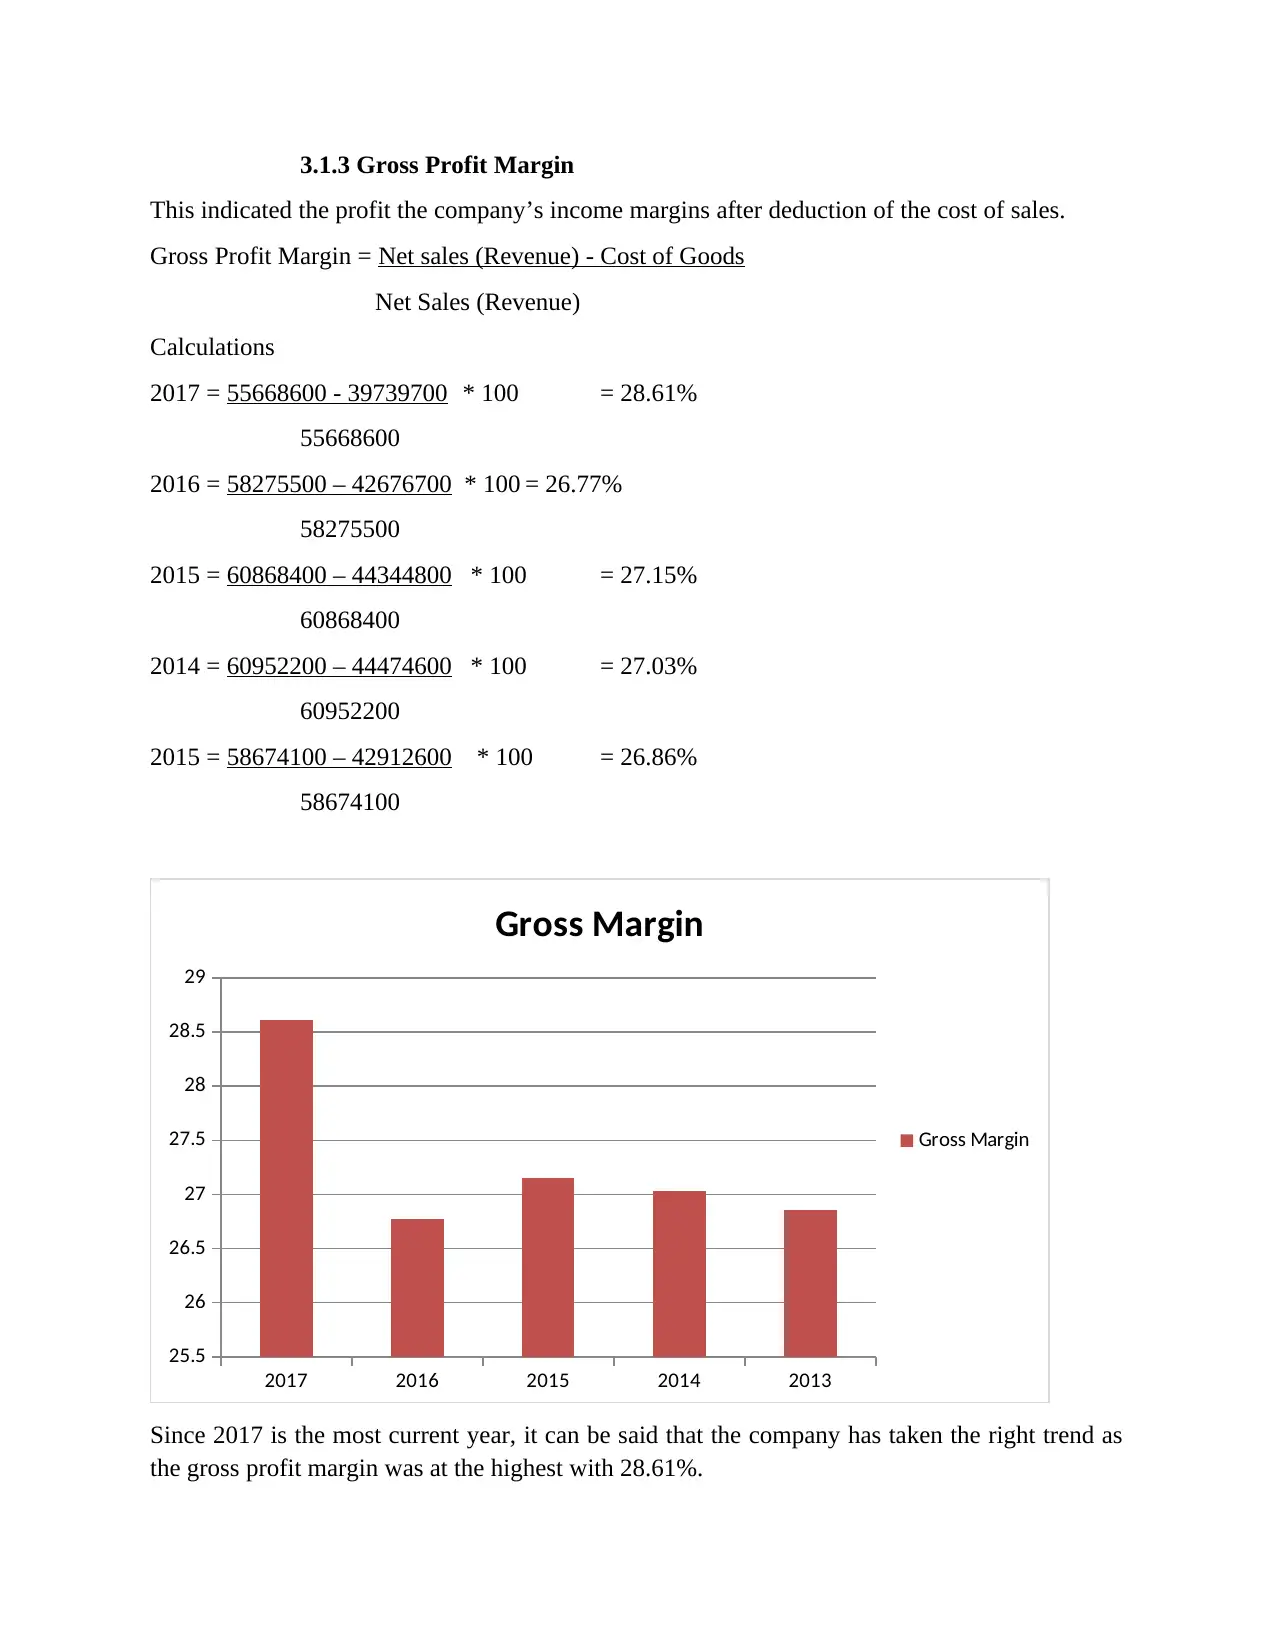
3.1.3 Gross Profit Margin
This indicated the profit the company’s income margins after deduction of the cost of sales.
Gross Profit Margin = Net sales (Revenue) - Cost of Goods
Net Sales (Revenue)
Calculations
2017 = 55668600 - 39739700 * 100 = 28.61%
55668600
2016 = 58275500 – 42676700 * 100 = 26.77%
58275500
2015 = 60868400 – 44344800 * 100 = 27.15%
60868400
2014 = 60952200 – 44474600 * 100 = 27.03%
60952200
2015 = 58674100 – 42912600 * 100 = 26.86%
58674100
2017 2016 2015 2014 2013
25.5
26
26.5
27
27.5
28
28.5
29
Gross Margin
Gross Margin
Since 2017 is the most current year, it can be said that the company has taken the right trend as
the gross profit margin was at the highest with 28.61%.
⊘ This is a preview!⊘
Do you want full access?
Subscribe today to unlock all pages.
Trusted by 1+ million students worldwide
The average profit margin for the five year period is 27.28%. The company thus operated below
its average in the years 2015 and 2014.
The company can maintain the set Gross margin through sourcing for cheaper but better quality
raw materials and labor as these components directly increase the cost of sales. It should also aim
to achieve high revenue values (Immorlica et al 2017).
3.2 Liquidity Ratios
These ratios indicated the ability of the company to repay both its short term debts using its
liquid assets (Michael & Albert 2015). Ratios used to analyze included:
Current Ratio
Quick Ratio
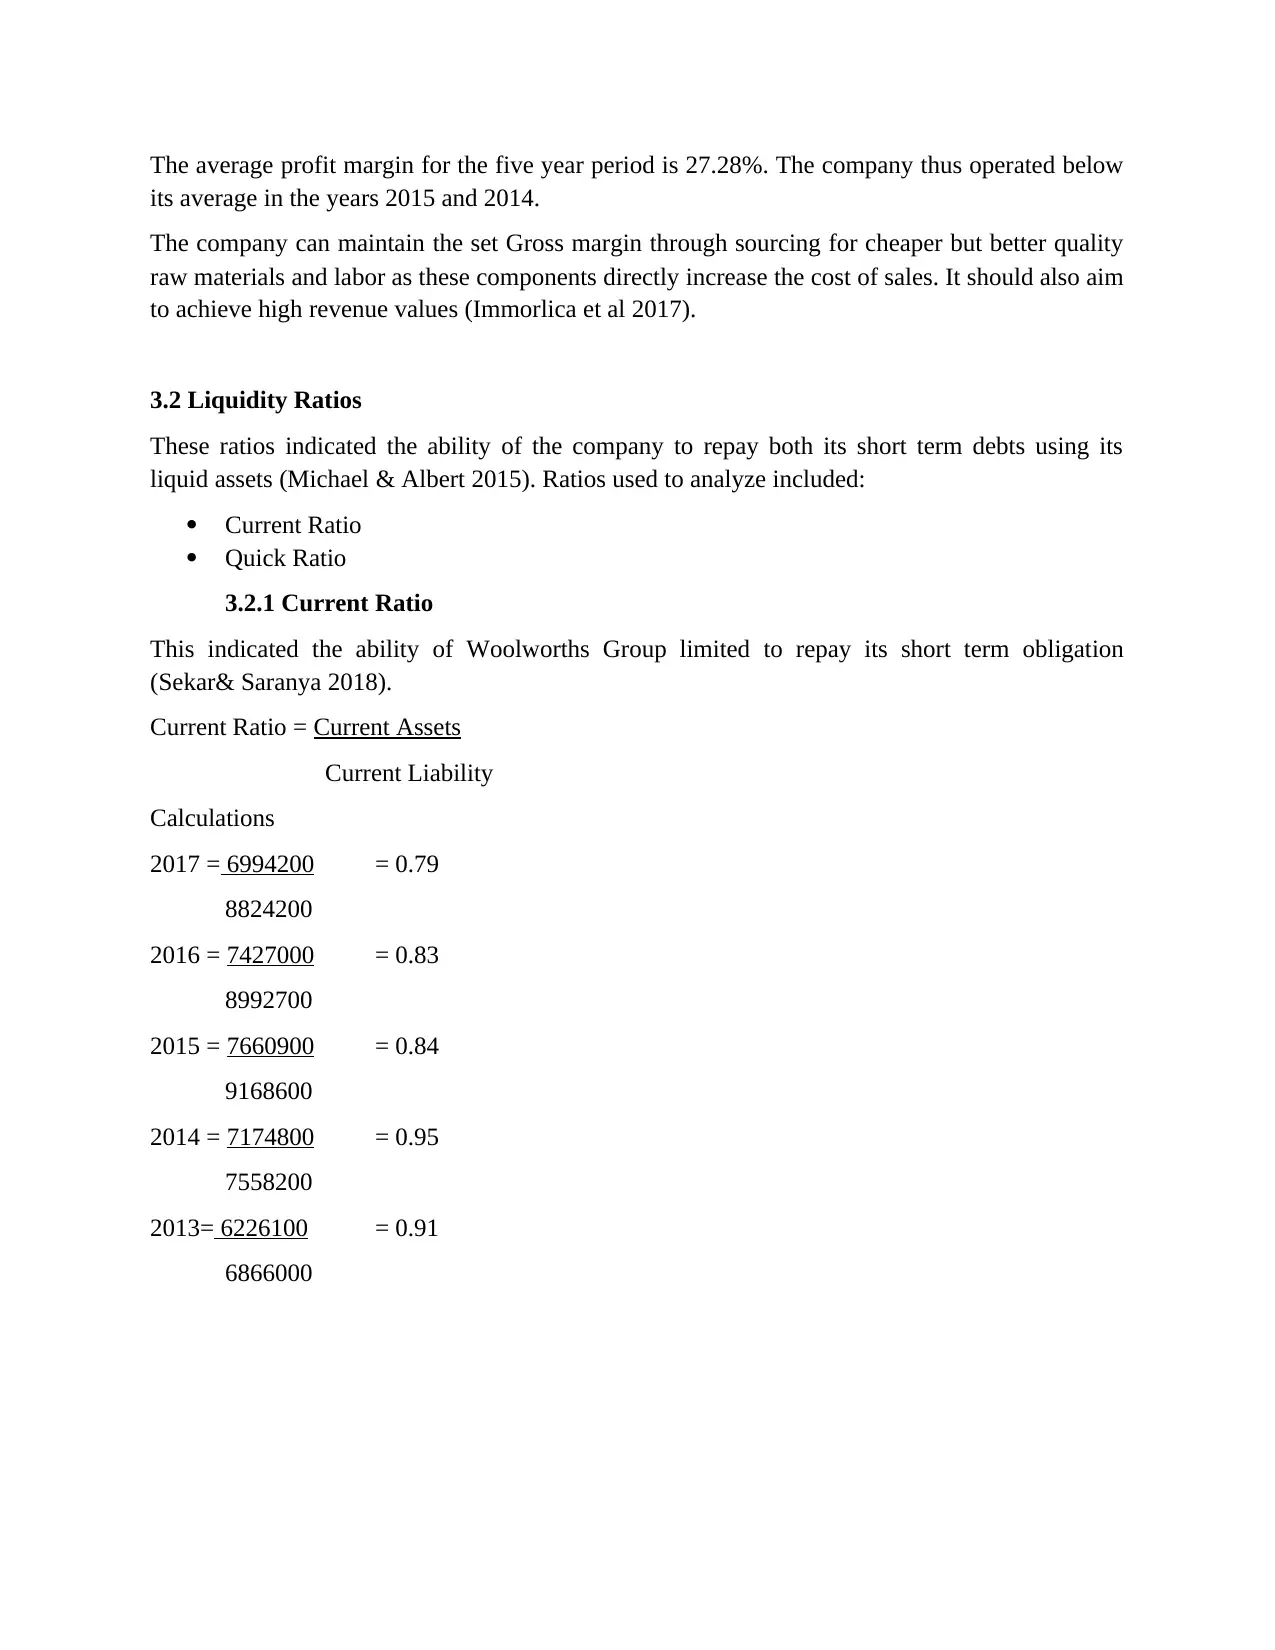
3.2.1 Current Ratio
This indicated the ability of Woolworths Group limited to repay its short term obligation
(Sekar& Saranya 2018).
Current Ratio = Current Assets
Current Liability
Calculations
2017 = 6994200 = 0.79
8824200
2016 = 7427000 = 0.83
8992700
2015 = 7660900 = 0.84
9168600
2014 = 7174800 = 0.95
7558200
2013= 6226100 = 0.91
6866000
its average in the years 2015 and 2014.
The company can maintain the set Gross margin through sourcing for cheaper but better quality
raw materials and labor as these components directly increase the cost of sales. It should also aim
to achieve high revenue values (Immorlica et al 2017).
3.2 Liquidity Ratios
These ratios indicated the ability of the company to repay both its short term debts using its
liquid assets (Michael & Albert 2015). Ratios used to analyze included:
Current Ratio
Quick Ratio
3.2.1 Current Ratio
This indicated the ability of Woolworths Group limited to repay its short term obligation
(Sekar& Saranya 2018).
Current Ratio = Current Assets
Current Liability
Calculations
2017 = 6994200 = 0.79
8824200
2016 = 7427000 = 0.83
8992700
2015 = 7660900 = 0.84
9168600
2014 = 7174800 = 0.95
7558200
2013= 6226100 = 0.91
6866000
Paraphrase This Document
Need a fresh take? Get an instant paraphrase of this document with our AI Paraphraser
2017 2016 2015 2014 2013
0
0.1
0.2
0.3
0.4
0.5
0.6
0.7
0.8
0.9
1
Current Ratio
Current Ratio
The average current ratio for the company for the 5 year period was 0.87%. As a general rule
current ratios should be greater than 1 to ensure that a company is in a position to discharge its
liability as and when they arise.
According to the analysis of this ratio it is evident that the ratios for the 5 years were below the
expected minimum and thus the default rate for short term liability payment was high.
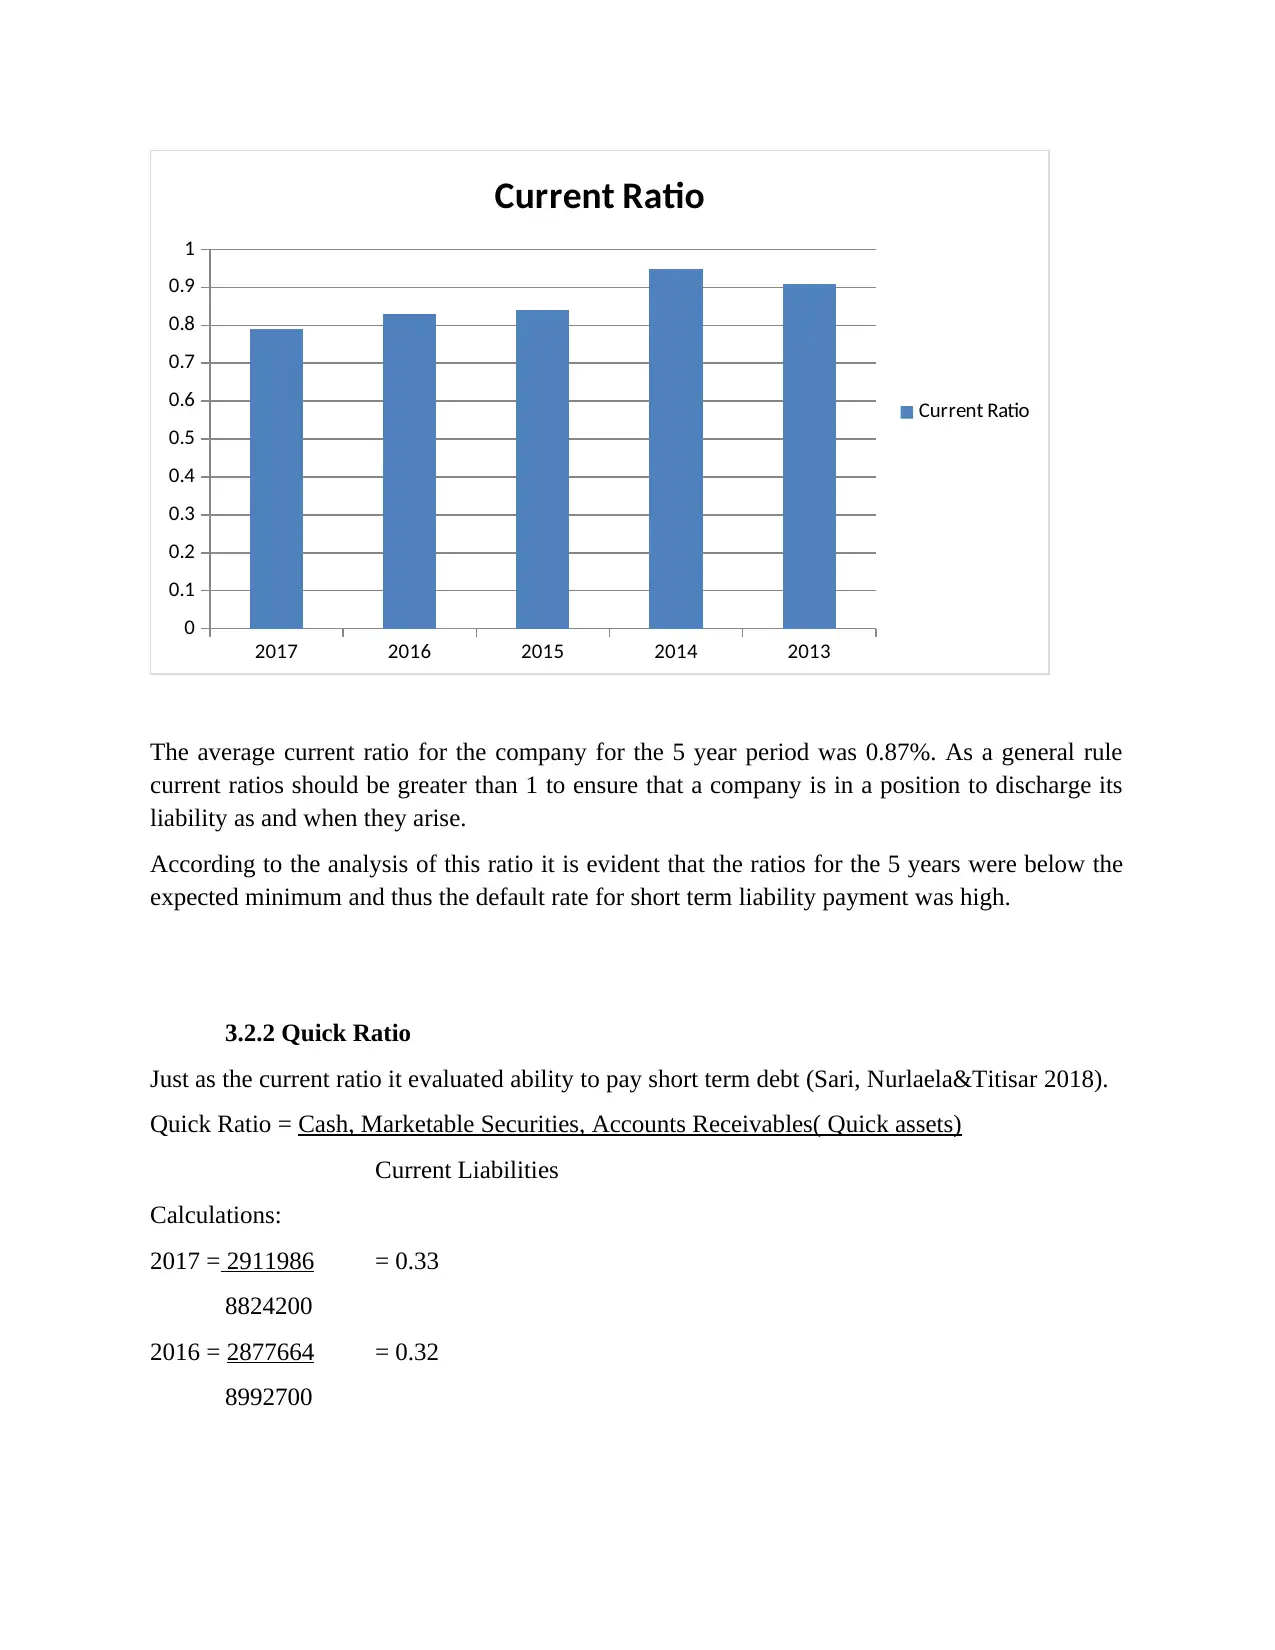
3.2.2 Quick Ratio
Just as the current ratio it evaluated ability to pay short term debt (Sari, Nurlaela&Titisar 2018).
Quick Ratio = Cash, Marketable Securities, Accounts Receivables( Quick assets)
Current Liabilities
Calculations:
2017 = 2911986 = 0.33
8824200
2016 = 2877664 = 0.32
8992700
0
0.1
0.2
0.3
0.4
0.5
0.6
0.7
0.8
0.9
1
Current Ratio
Current Ratio
The average current ratio for the company for the 5 year period was 0.87%. As a general rule
current ratios should be greater than 1 to ensure that a company is in a position to discharge its
liability as and when they arise.
According to the analysis of this ratio it is evident that the ratios for the 5 years were below the
expected minimum and thus the default rate for short term liability payment was high.
3.2.2 Quick Ratio
Just as the current ratio it evaluated ability to pay short term debt (Sari, Nurlaela&Titisar 2018).
Quick Ratio = Cash, Marketable Securities, Accounts Receivables( Quick assets)
Current Liabilities
Calculations:
2017 = 2911986 = 0.33
8824200
2016 = 2877664 = 0.32
8992700
2015 = 2750580 = 0.3
9168600
2014 = 2494206 = 0.33
7558200
2013 = 1991140 = 0.29
6866000
2017 2016 2015 2014 2013
0.26
0.27
0.28
0.29
0.3
0.31
0.32
0.33
0.34
Quick Ratio
Quick Ratio
The quick ratio is relatively low and just as indicated by the current ratio the default rate is very
high.
The company is thus advised to the following to enhance both its current and quick ratio.
Dispose idle assets that don’t generate revenue to the company.
Maintain an efficient system that ensures prompt and continuous collection of
amount owed by the company by debtors.
Negotiating long credit periods by suppliers to ensure that the company has
enough time to prepare for payments to reduce defaults rates (Tomczak 2014).
Maintaining overheads at the lowest manageable level to reduce cash wastage on
daily routine expenses.
3.3 Efficiency Ratios.
⊘ This is a preview!⊘
Do you want full access?
Subscribe today to unlock all pages.
Trusted by 1+ million students worldwide
1 out of 22
Related Documents


Your All-in-One AI-Powered Toolkit for Academic Success.
+13062052269
info@desklib.com
Available 24*7 on WhatsApp / Email
![[object Object]](/_next/static/media/star-bottom.7253800d.svg)
Unlock your academic potential
Copyright © 2020–2026 A2Z Services. All Rights Reserved. Developed and managed by ZUCOL.