HC1010 Accounting for Business - Woolworths Limited Financial Analysis
VerifiedAdded on 2023/06/12
|20
|4191
|209
Report
AI Summary
This report provides an analysis of Woolworths Limited's organizational performance, evaluating its financial standing through profitability comparisons, cash flow analysis, and balance sheet reviews. Financial ratios such as return on assets, inventory turnover, and quick ratio are calculated and analyzed. The report also examines the company's corporate governance statements and ethical practices, focusing on risk management, financial reporting, and business operations. By comparing Woolworths' performance against competitor Wesfarmers and analyzing key financial indicators over several years, the report offers a comprehensive assessment of the company's financial health and ethical standards. Desklib offers a platform for students to access this and similar solved assignments and past papers.
Accounting for Business
1
1
Paraphrase This Document
Need a fresh take? Get an instant paraphrase of this document with our AI Paraphraser
Executive Summary
The report has been carried out for depicting an analysis of the organizational
performance of Woolworths Limited. This has been carried out by examination of its cash flow
statement, balance sheet and performance ratios. The analysis of the ethical standards maintained
by the company is evaluated on the basis of examination of its corporate governance statement.
2
Contents
Introduction......................................................................................................................................4
Section 1: Evaluation of the financial standing of the company.....................................................4
Profitability of Woolworth in current year (2017) as compared to previous year (2016)...........4
Comparison of profitability performance of Woolworth with its competitor Wesfarmers.........6
Analysis of cash flow statement of Woolworth Group................................................................6
Analyses of financial position of the company (Balance Sheet).................................................7
Section 2: Analyzing the firm performance using the financial ratios..........................................10
Return on Assets........................................................................................................................11
Inventory Turnover ratio............................................................................................................12
Quick Ratio:...............................................................................................................................13
Section 3: Corporate Governance Statements & the Practice of Integrity Policy.........................14
Management Approach for:.......................................................................................................14
Management of Business Risks..............................................................................................14
Attitudes & Actions towards Financial Reporting.................................................................15
Attitudes toward information processing and accounting functions and personnel...............15
Business Operations...................................................................................................................15
Investment and Investment Activities........................................................................................16
Financing and Financing Activities...........................................................................................16
Industry Size..............................................................................................................................16
Major Players/Competitors........................................................................................................16
Market Shares of Industry Players.............................................................................................16
Conclusion.....................................................................................................................................17
References......................................................................................................................................18
3
⊘ This is a preview!⊘
Do you want full access?
Subscribe today to unlock all pages.
Trusted by 1+ million students worldwide

4
Paraphrase This Document
Need a fresh take? Get an instant paraphrase of this document with our AI Paraphraser
Introduction
The report is developed to provide an analysis of the organizational performance of a
selected company listed on ASX. It provides an evaluation of the financial performance of the
selected company with analyzing its profitability position. This is carried out by providing
comparison of the current year financial figure of the company against the previous years and
also from its competitors taken from the same industry. In addition to this, the evaluation of the
cash flow and balance sheet of the company is undertaken to examine its financial position. This
is followed by calculation of the financial ratios of the company for the last three years on the
basis of information provided in the annual report. The financial performance of the selected
company is mainly analyzed on the basis of the performance ratios of rerun on assets, inventory
turnover, quick ratio, and price-earnings ratio. Also, the ethical standards implemented by the
management for carrying out the business operations are analyzed in the report by examining its
corporate governance framework. The selected company in this context is Woolworths Limited,
a supermarket giant in Australia that is regarded as one of the top most retail company within the
country.
Section 1: Evaluation of the financial standing of the company
In order to evaluate the financial standing of the company there is need to evaluate the
financial strength through use of financial ratios, trends in the financial statements and through
analyzing the variances in the financial items (Papadopoulos, 2011). In this segment of the report
there is need to evaluate the financial standing of Woolworth for last two years and its
performance has been compared with the financial performance of Wesfarmers. Wesfarmers also
belong to the same industry and it is the main competitor of Woolworth.
Profitability of Woolworth in current year (2017) as compared to previous year (2016)
Income Statement
Woolworth Group
AUD in millions except per share data.
Financial Items 2016 2017 Increase/Decrease
In amount in %
5
Revenue $ 58,276.00 $ 55,669.00 $ (2,607.00) -4.47%
Cost of revenue $ 42,677.00 $ 39,740.00 $ (2,937.00) -6.88%
Gross profit $ 15,599.00 $ 15,929.00 $ 330.00 2.12%
Operating expenses
Sales, General and administrative $ 12,964.00 $ 13,134.00 $ 170.00 1.31%
Other operating expenses $ 12,033.00 $ 11,686.00 $ (347.00) -2.88%
Total operating expenses $ 24,997.00 $ 24,820.00 $ (177.00) -0.71%
Operating income $ (9,398.00) $ (8,891.00) $ 507.00 -5.39%
Interest Expense $ 246.00 $ 194.00 $ (52.00) -21.14%
Other income (expense) $ 11,004.00 $ 11,217.00 $ 213.00 1.94%
Income before income taxes $ 1,360.00 $ 2,132.00 $ 772.00 56.76%
Provision for income taxes $ 520.00 $ 650.00 $ 130.00 25.00%
Minority interest $ (1,113.00) $ 60.00 $ 1,173.00
-
105.39%
Other income $ (1,113.00) $ 60.00 $ 1,173.00
-
105.39%
Net income from continuing
operations $ 840.00 $ 1,482.00 $ 642.00 76.43%
Net income from discontinuing
ops $ (3,188.00) $ 111.00 $ 3,299.00 103.48%
Other $ 1,113.00 $ (60.00) $ (1,173.00)
-
105.39%
Net income $ (1,235.00) $ 1,534.00 $ 2,769.00 224.21%
Net income available to
common shareholders $ (1,235.00) $ 1,534.00 $ 2,769.00 224.21%
Earnings per share
Basic $ (0.98) $ 1.19 $ 2.17 221.43%
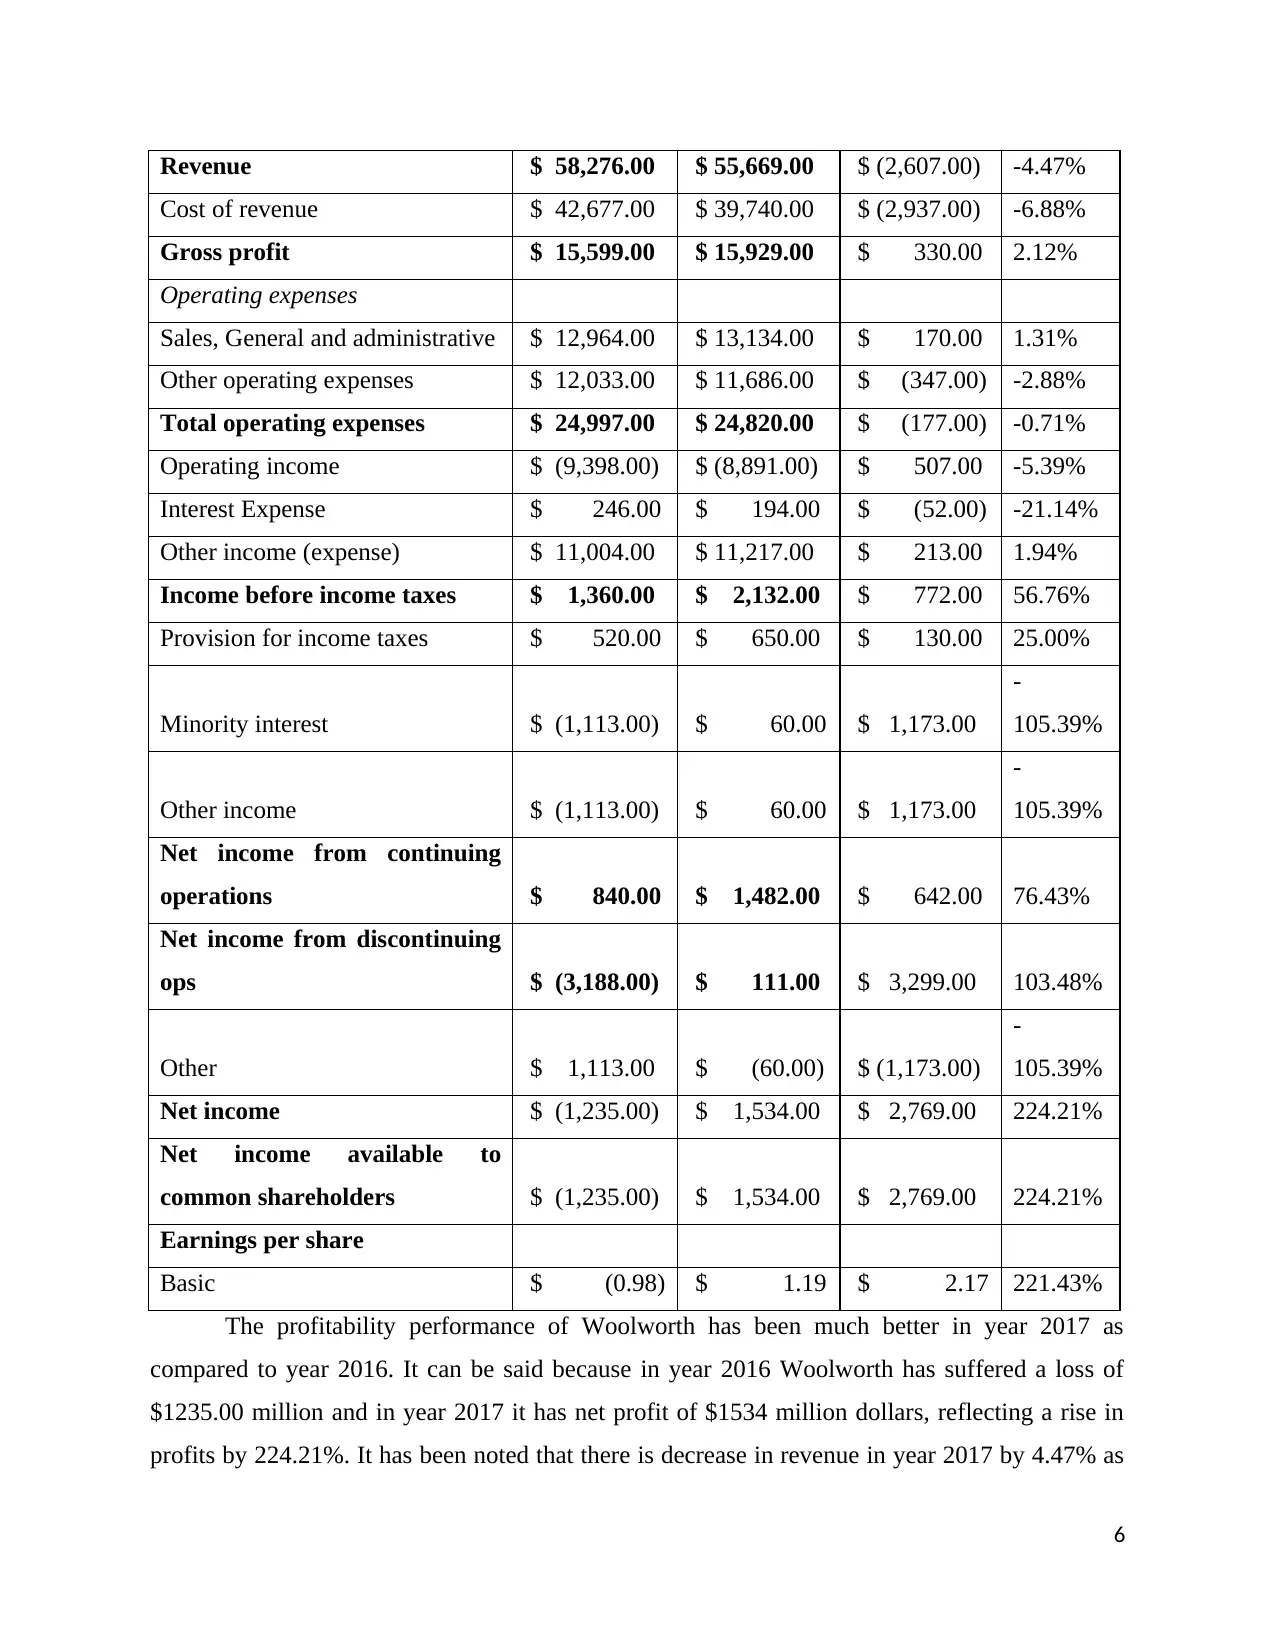
The profitability performance of Woolworth has been much better in year 2017 as
compared to year 2016. It can be said because in year 2016 Woolworth has suffered a loss of
$1235.00 million and in year 2017 it has net profit of $1534 million dollars, reflecting a rise in
profits by 224.21%. It has been noted that there is decrease in revenue in year 2017 by 4.47% as
6
Cost of revenue $ 42,677.00 $ 39,740.00 $ (2,937.00) -6.88%
Gross profit $ 15,599.00 $ 15,929.00 $ 330.00 2.12%
Operating expenses
Sales, General and administrative $ 12,964.00 $ 13,134.00 $ 170.00 1.31%
Other operating expenses $ 12,033.00 $ 11,686.00 $ (347.00) -2.88%
Total operating expenses $ 24,997.00 $ 24,820.00 $ (177.00) -0.71%
Operating income $ (9,398.00) $ (8,891.00) $ 507.00 -5.39%
Interest Expense $ 246.00 $ 194.00 $ (52.00) -21.14%
Other income (expense) $ 11,004.00 $ 11,217.00 $ 213.00 1.94%
Income before income taxes $ 1,360.00 $ 2,132.00 $ 772.00 56.76%
Provision for income taxes $ 520.00 $ 650.00 $ 130.00 25.00%
Minority interest $ (1,113.00) $ 60.00 $ 1,173.00
-
105.39%
Other income $ (1,113.00) $ 60.00 $ 1,173.00
-
105.39%
Net income from continuing
operations $ 840.00 $ 1,482.00 $ 642.00 76.43%
Net income from discontinuing
ops $ (3,188.00) $ 111.00 $ 3,299.00 103.48%
Other $ 1,113.00 $ (60.00) $ (1,173.00)
-
105.39%
Net income $ (1,235.00) $ 1,534.00 $ 2,769.00 224.21%
Net income available to
common shareholders $ (1,235.00) $ 1,534.00 $ 2,769.00 224.21%
Earnings per share
Basic $ (0.98) $ 1.19 $ 2.17 221.43%
The profitability performance of Woolworth has been much better in year 2017 as
compared to year 2016. It can be said because in year 2016 Woolworth has suffered a loss of
$1235.00 million and in year 2017 it has net profit of $1534 million dollars, reflecting a rise in
profits by 224.21%. It has been noted that there is decrease in revenue in year 2017 by 4.47% as
6
⊘ This is a preview!⊘
Do you want full access?
Subscribe today to unlock all pages.
Trusted by 1+ million students worldwide
compared to previous year 2016. The decrease in revenue has been marked with decrease in cost
of goods sold by 6.88%. The actual rise in gross profit of company was 2.12% in year 2017 as
compared to year 2016. It has been noted that there was major leap in the income before income
taxes by 56.76% that has increase to the EBT to $2132 dollars in year 2017 as compared to
$1360 dollars in year 2016. With the rise in income before taxes, the taxes have also increased
by 25%. The EPS of the Woolworth was negative $ 0.98 in year 2016 and it was increased by
221.43% to $1.19. So, overall profitability of the Woolworth was much better in year 2017 as
compared to 2016 (Woolworths Limited: Annual Report, 2017).
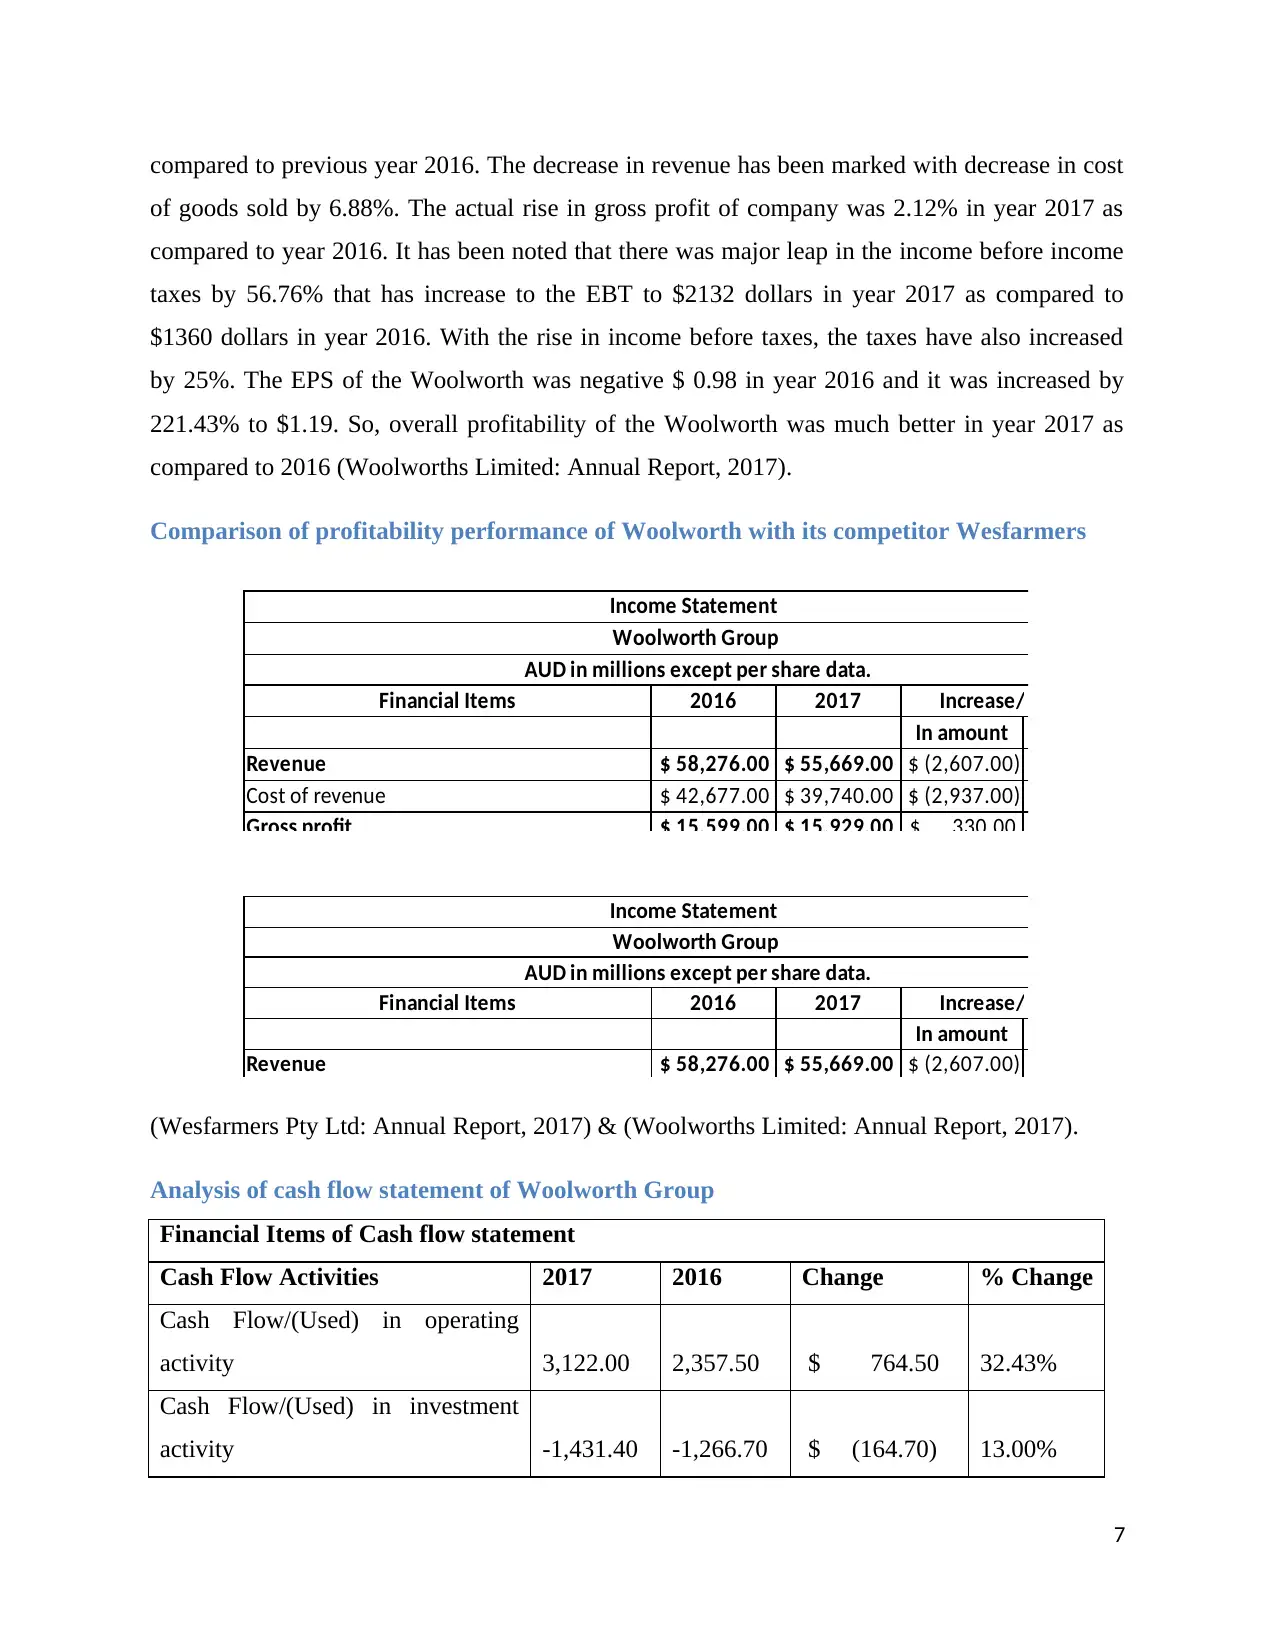
Comparison of profitability performance of Woolworth with its competitor Wesfarmers
Income Statement
Woolworth Group
AUD in millions except per share data.
Financial Items 2016 2017 Increase/Decrease
In amount
Revenue $ 58,276.00 $ 55,669.00 $ (2,607.00)
Cost of revenue $ 42,677.00 $ 39,740.00 $ (2,937.00)
Gross profit $ 15,599.00 $ 15,929.00 $ 330.00
Income Statement
Woolworth Group
AUD in millions except per share data.
Financial Items 2016 2017 Increase/Decrease
In amount
Revenue $ 58,276.00 $ 55,669.00 $ (2,607.00)
(Wesfarmers Pty Ltd: Annual Report, 2017) & (Woolworths Limited: Annual Report, 2017).
Analysis of cash flow statement of Woolworth Group
Financial Items of Cash flow statement
Cash Flow Activities 2017 2016 Change % Change
Cash Flow/(Used) in operating
activity 3,122.00 2,357.50 $ 764.50 32.43%
Cash Flow/(Used) in investment
activity -1,431.40 -1,266.70 $ (164.70) 13.00%
7
of goods sold by 6.88%. The actual rise in gross profit of company was 2.12% in year 2017 as
compared to year 2016. It has been noted that there was major leap in the income before income
taxes by 56.76% that has increase to the EBT to $2132 dollars in year 2017 as compared to
$1360 dollars in year 2016. With the rise in income before taxes, the taxes have also increased
by 25%. The EPS of the Woolworth was negative $ 0.98 in year 2016 and it was increased by
221.43% to $1.19. So, overall profitability of the Woolworth was much better in year 2017 as
compared to 2016 (Woolworths Limited: Annual Report, 2017).
Comparison of profitability performance of Woolworth with its competitor Wesfarmers
Income Statement
Woolworth Group
AUD in millions except per share data.
Financial Items 2016 2017 Increase/Decrease
In amount
Revenue $ 58,276.00 $ 55,669.00 $ (2,607.00)
Cost of revenue $ 42,677.00 $ 39,740.00 $ (2,937.00)
Gross profit $ 15,599.00 $ 15,929.00 $ 330.00
Income Statement
Woolworth Group
AUD in millions except per share data.
Financial Items 2016 2017 Increase/Decrease
In amount
Revenue $ 58,276.00 $ 55,669.00 $ (2,607.00)
(Wesfarmers Pty Ltd: Annual Report, 2017) & (Woolworths Limited: Annual Report, 2017).
Analysis of cash flow statement of Woolworth Group
Financial Items of Cash flow statement
Cash Flow Activities 2017 2016 Change % Change
Cash Flow/(Used) in operating
activity 3,122.00 2,357.50 $ 764.50 32.43%
Cash Flow/(Used) in investment
activity -1,431.40 -1,266.70 $ (164.70) 13.00%
7
Paraphrase This Document
Need a fresh take? Get an instant paraphrase of this document with our AI Paraphraser
Cash Flow/(Used) in financing
activity -1,729.30 -1,474.90 $ (254.40) 17.25%
Net increase/(decrease) in cash and
cash equivalents -38.7 -384.1 $ 345.40 89.92%
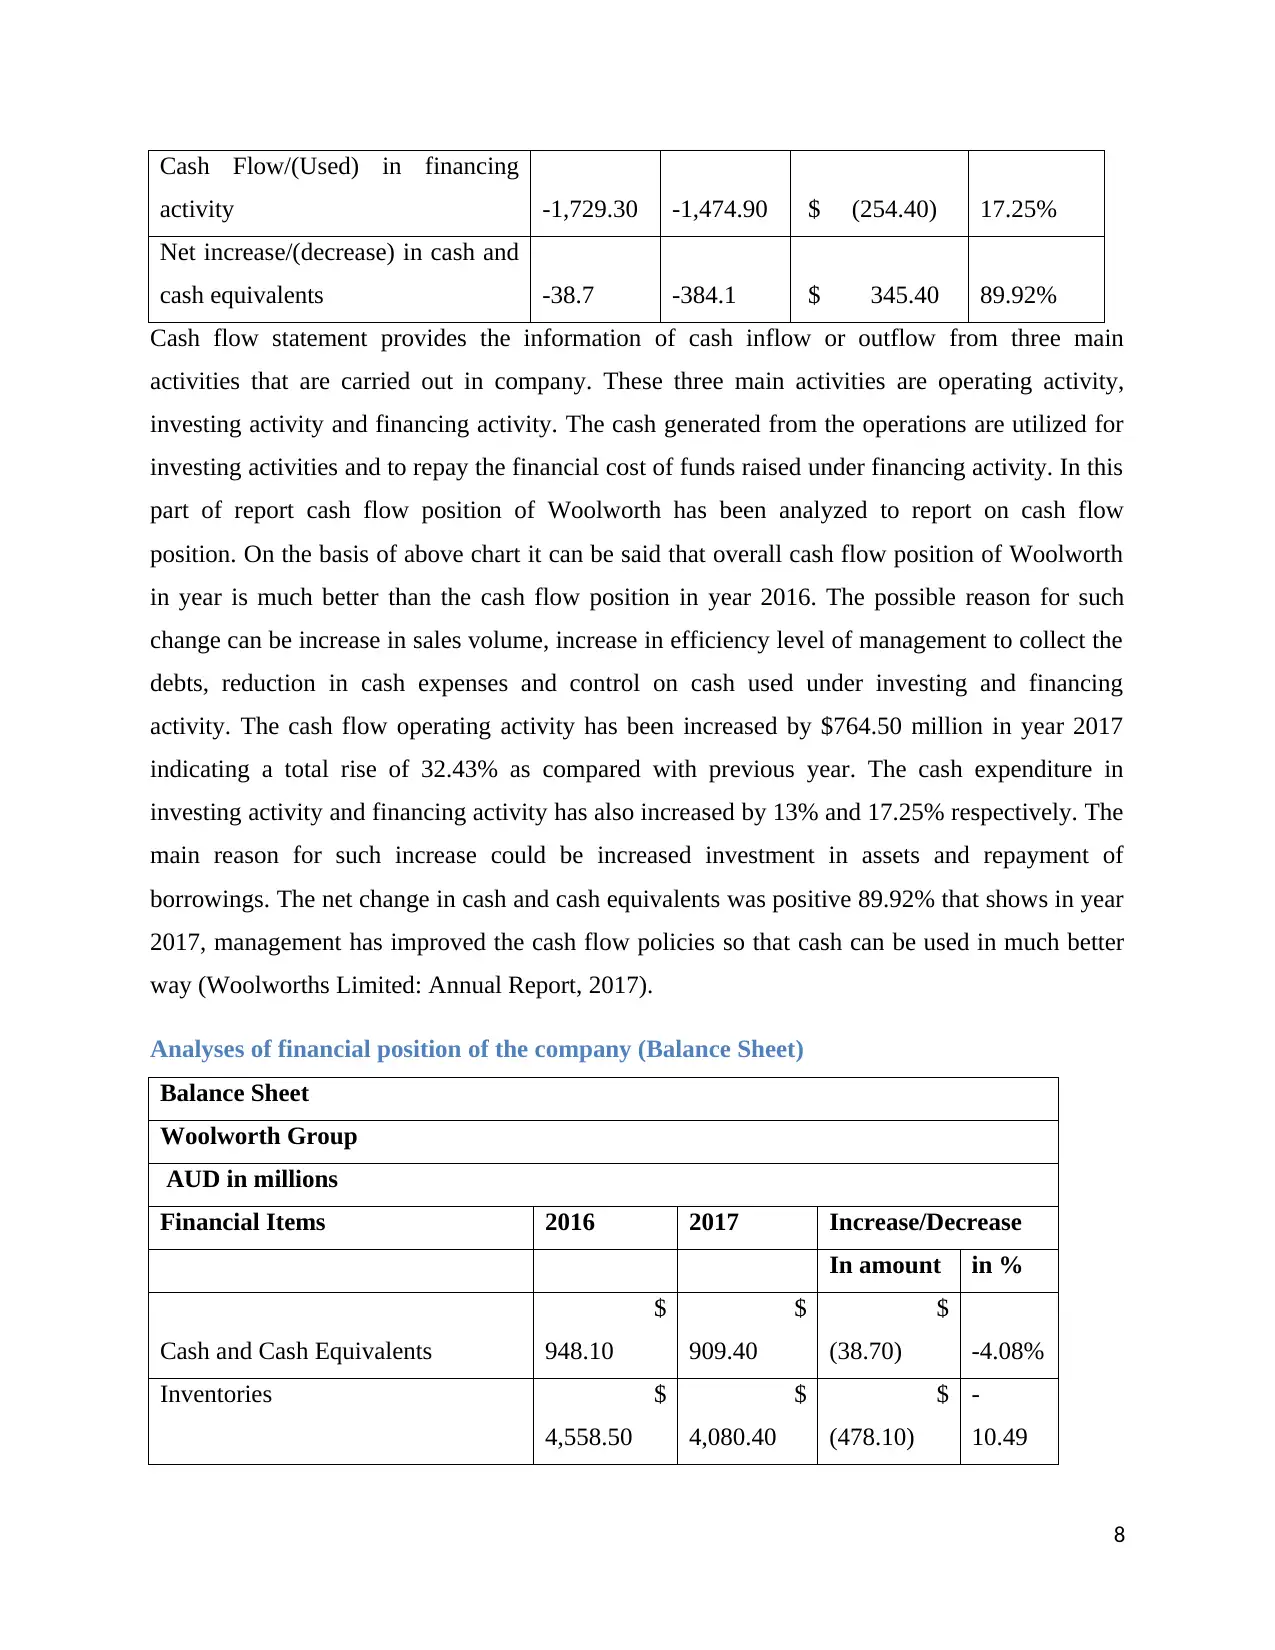
Cash flow statement provides the information of cash inflow or outflow from three main
activities that are carried out in company. These three main activities are operating activity,
investing activity and financing activity. The cash generated from the operations are utilized for
investing activities and to repay the financial cost of funds raised under financing activity. In this
part of report cash flow position of Woolworth has been analyzed to report on cash flow
position. On the basis of above chart it can be said that overall cash flow position of Woolworth
in year is much better than the cash flow position in year 2016. The possible reason for such
change can be increase in sales volume, increase in efficiency level of management to collect the
debts, reduction in cash expenses and control on cash used under investing and financing
activity. The cash flow operating activity has been increased by $764.50 million in year 2017
indicating a total rise of 32.43% as compared with previous year. The cash expenditure in
investing activity and financing activity has also increased by 13% and 17.25% respectively. The
main reason for such increase could be increased investment in assets and repayment of
borrowings. The net change in cash and cash equivalents was positive 89.92% that shows in year
2017, management has improved the cash flow policies so that cash can be used in much better
way (Woolworths Limited: Annual Report, 2017).
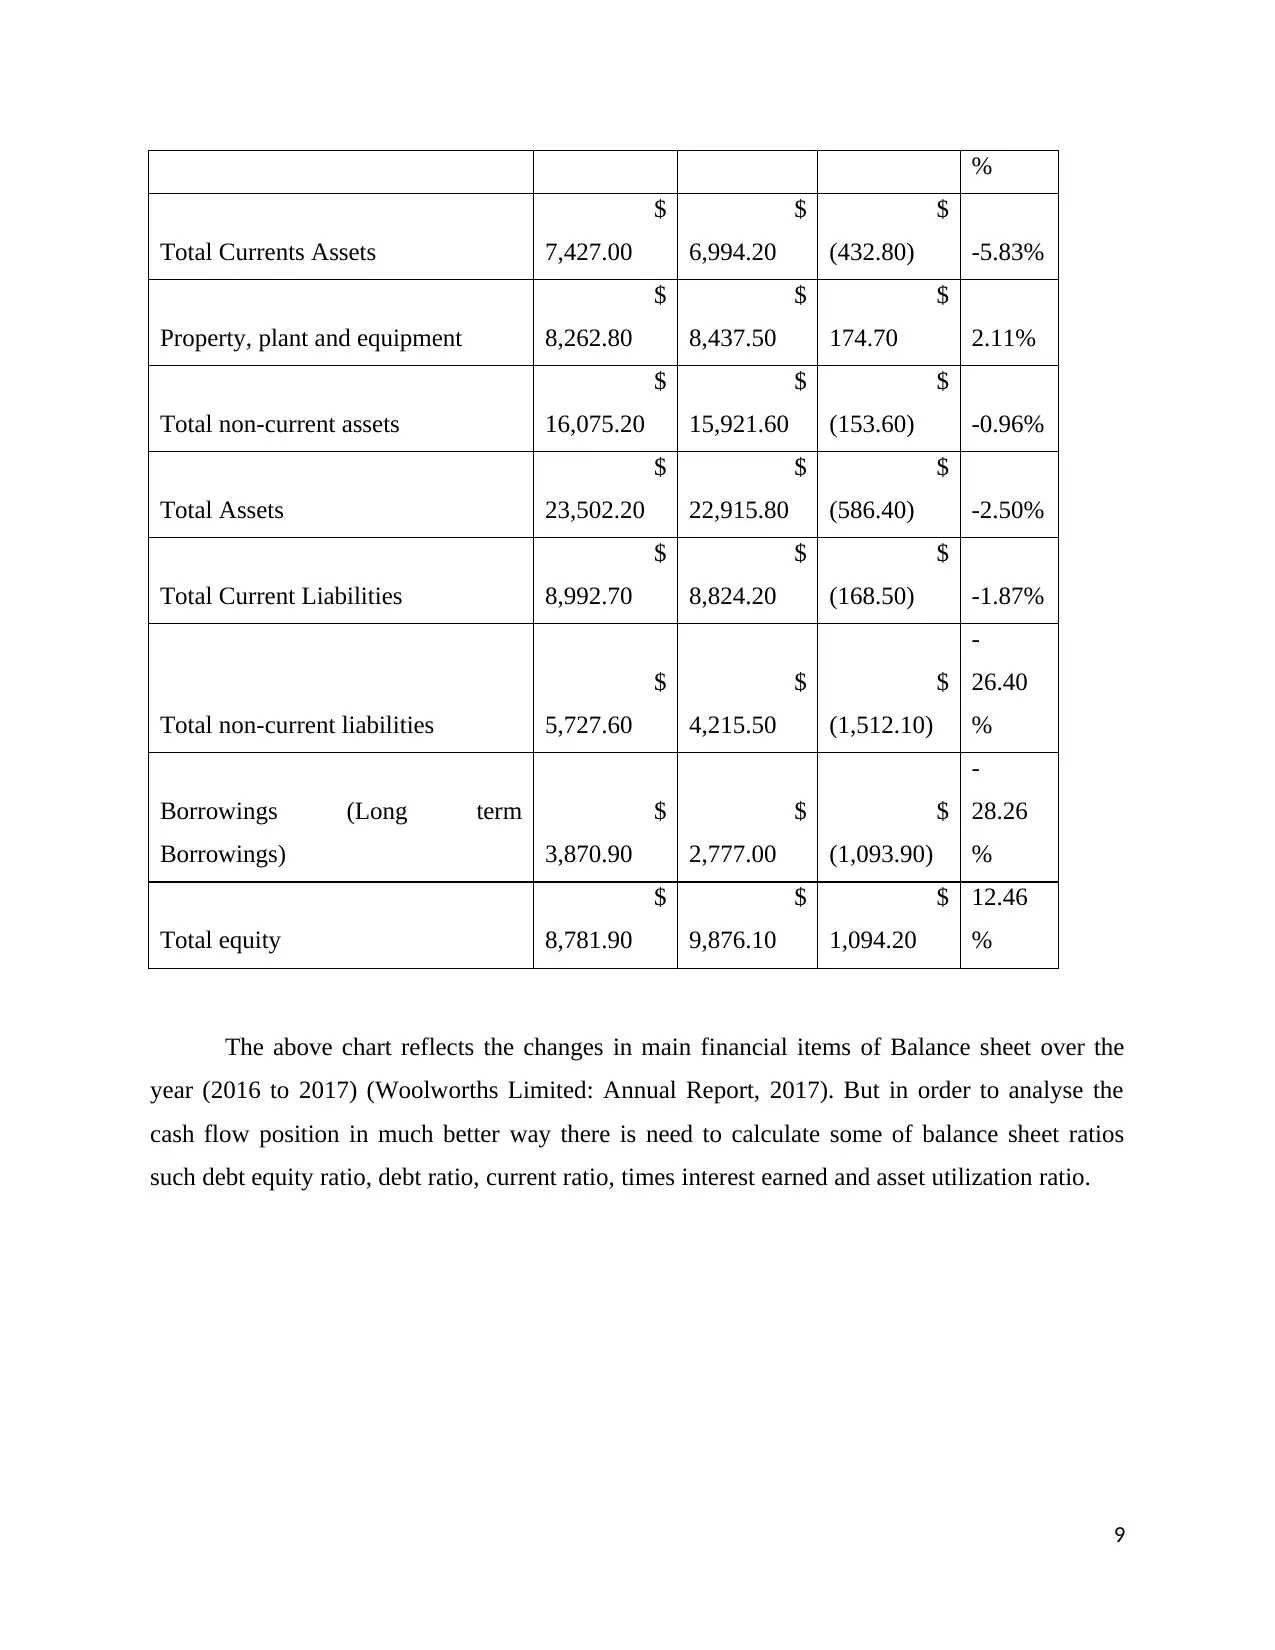
Analyses of financial position of the company (Balance Sheet)
Balance Sheet
Woolworth Group
AUD in millions
Financial Items 2016 2017 Increase/Decrease
In amount in %
Cash and Cash Equivalents
$
948.10
$
909.40
$
(38.70) -4.08%
Inventories $
4,558.50
$
4,080.40
$
(478.10)
-
10.49
8
activity -1,729.30 -1,474.90 $ (254.40) 17.25%
Net increase/(decrease) in cash and
cash equivalents -38.7 -384.1 $ 345.40 89.92%
Cash flow statement provides the information of cash inflow or outflow from three main
activities that are carried out in company. These three main activities are operating activity,
investing activity and financing activity. The cash generated from the operations are utilized for
investing activities and to repay the financial cost of funds raised under financing activity. In this
part of report cash flow position of Woolworth has been analyzed to report on cash flow
position. On the basis of above chart it can be said that overall cash flow position of Woolworth
in year is much better than the cash flow position in year 2016. The possible reason for such
change can be increase in sales volume, increase in efficiency level of management to collect the
debts, reduction in cash expenses and control on cash used under investing and financing
activity. The cash flow operating activity has been increased by $764.50 million in year 2017
indicating a total rise of 32.43% as compared with previous year. The cash expenditure in
investing activity and financing activity has also increased by 13% and 17.25% respectively. The
main reason for such increase could be increased investment in assets and repayment of
borrowings. The net change in cash and cash equivalents was positive 89.92% that shows in year
2017, management has improved the cash flow policies so that cash can be used in much better
way (Woolworths Limited: Annual Report, 2017).
Analyses of financial position of the company (Balance Sheet)
Balance Sheet
Woolworth Group
AUD in millions
Financial Items 2016 2017 Increase/Decrease
In amount in %
Cash and Cash Equivalents
$
948.10
$
909.40
$
(38.70) -4.08%
Inventories $
4,558.50
$
4,080.40
$
(478.10)
-
10.49
8
%
Total Currents Assets
$
7,427.00
$
6,994.20
$
(432.80) -5.83%
Property, plant and equipment
$
8,262.80
$
8,437.50
$
174.70 2.11%
Total non-current assets
$
16,075.20
$
15,921.60
$
(153.60) -0.96%
Total Assets
$
23,502.20
$
22,915.80
$
(586.40) -2.50%
Total Current Liabilities
$
8,992.70
$
8,824.20
$
(168.50) -1.87%
Total non-current liabilities
$
5,727.60
$
4,215.50
$
(1,512.10)
-
26.40
%
Borrowings (Long term
Borrowings)
$
3,870.90
$
2,777.00
$
(1,093.90)
-
28.26
%
Total equity
$
8,781.90
$
9,876.10
$
1,094.20
12.46
%
The above chart reflects the changes in main financial items of Balance sheet over the
year (2016 to 2017) (Woolworths Limited: Annual Report, 2017). But in order to analyse the
cash flow position in much better way there is need to calculate some of balance sheet ratios
such debt equity ratio, debt ratio, current ratio, times interest earned and asset utilization ratio.
9
⊘ This is a preview!⊘
Do you want full access?
Subscribe today to unlock all pages.
Trusted by 1+ million students worldwide
Total Current Liabilities
Total non-current liabilities
Borrowings (Long term Borrowings)
Total equity
Financial Items
Total non-current liabilities
Short term Interest-bearing loans and
borrowings
Total Current Liabilities
Total non-current liabilities
Borrowings (Long term Borrowings)
Total equity
Debt ratio: This ratio provides proportion of debt used to finance the assets of the
company. This ratio has been decrease in year 2017 as compared to year 2016. That
indicates that Woolworth has improved its leverage position in current year and has make
use maximum use of equity capital to finance the assets.
Debt to equity ratio: This ratio provides proportion of debt and equity used to finance the
company assets. This ratio has been decreased from 0.71 times in year 2016 to 0.45 times
in year 2017. It clearly indicates great improvement in the capital structure of the
company.
Times interest earned ratio: This ratio provides number of times entity can bear the
interest expenses for the particular period. This ratio has been increased to 12.01 times in
year 2017 as compared to 6.09 times in year 2016. This shows company has increased its
ability to pay interest on the debt capital.
Asset turnover ratio: This ratio represents how company utilizes its assets to earn the
revenue. The ratio of 2.43 times in year 2017 clearly signifies that company uses its
assets in most prominent manner. This ratio has also been increased in year 2017 as
compared to year 2016 (Tracy, 2012).
10
Total non-current liabilities
Borrowings (Long term Borrowings)
Total equity
Financial Items
Total non-current liabilities
Short term Interest-bearing loans and
borrowings
Total Current Liabilities
Total non-current liabilities
Borrowings (Long term Borrowings)
Total equity
Debt ratio: This ratio provides proportion of debt used to finance the assets of the
company. This ratio has been decrease in year 2017 as compared to year 2016. That
indicates that Woolworth has improved its leverage position in current year and has make
use maximum use of equity capital to finance the assets.
Debt to equity ratio: This ratio provides proportion of debt and equity used to finance the
company assets. This ratio has been decreased from 0.71 times in year 2016 to 0.45 times
in year 2017. It clearly indicates great improvement in the capital structure of the
company.
Times interest earned ratio: This ratio provides number of times entity can bear the
interest expenses for the particular period. This ratio has been increased to 12.01 times in
year 2017 as compared to 6.09 times in year 2016. This shows company has increased its
ability to pay interest on the debt capital.
Asset turnover ratio: This ratio represents how company utilizes its assets to earn the
revenue. The ratio of 2.43 times in year 2017 clearly signifies that company uses its
assets in most prominent manner. This ratio has also been increased in year 2017 as
compared to year 2016 (Tracy, 2012).
10
Paraphrase This Document
Need a fresh take? Get an instant paraphrase of this document with our AI Paraphraser
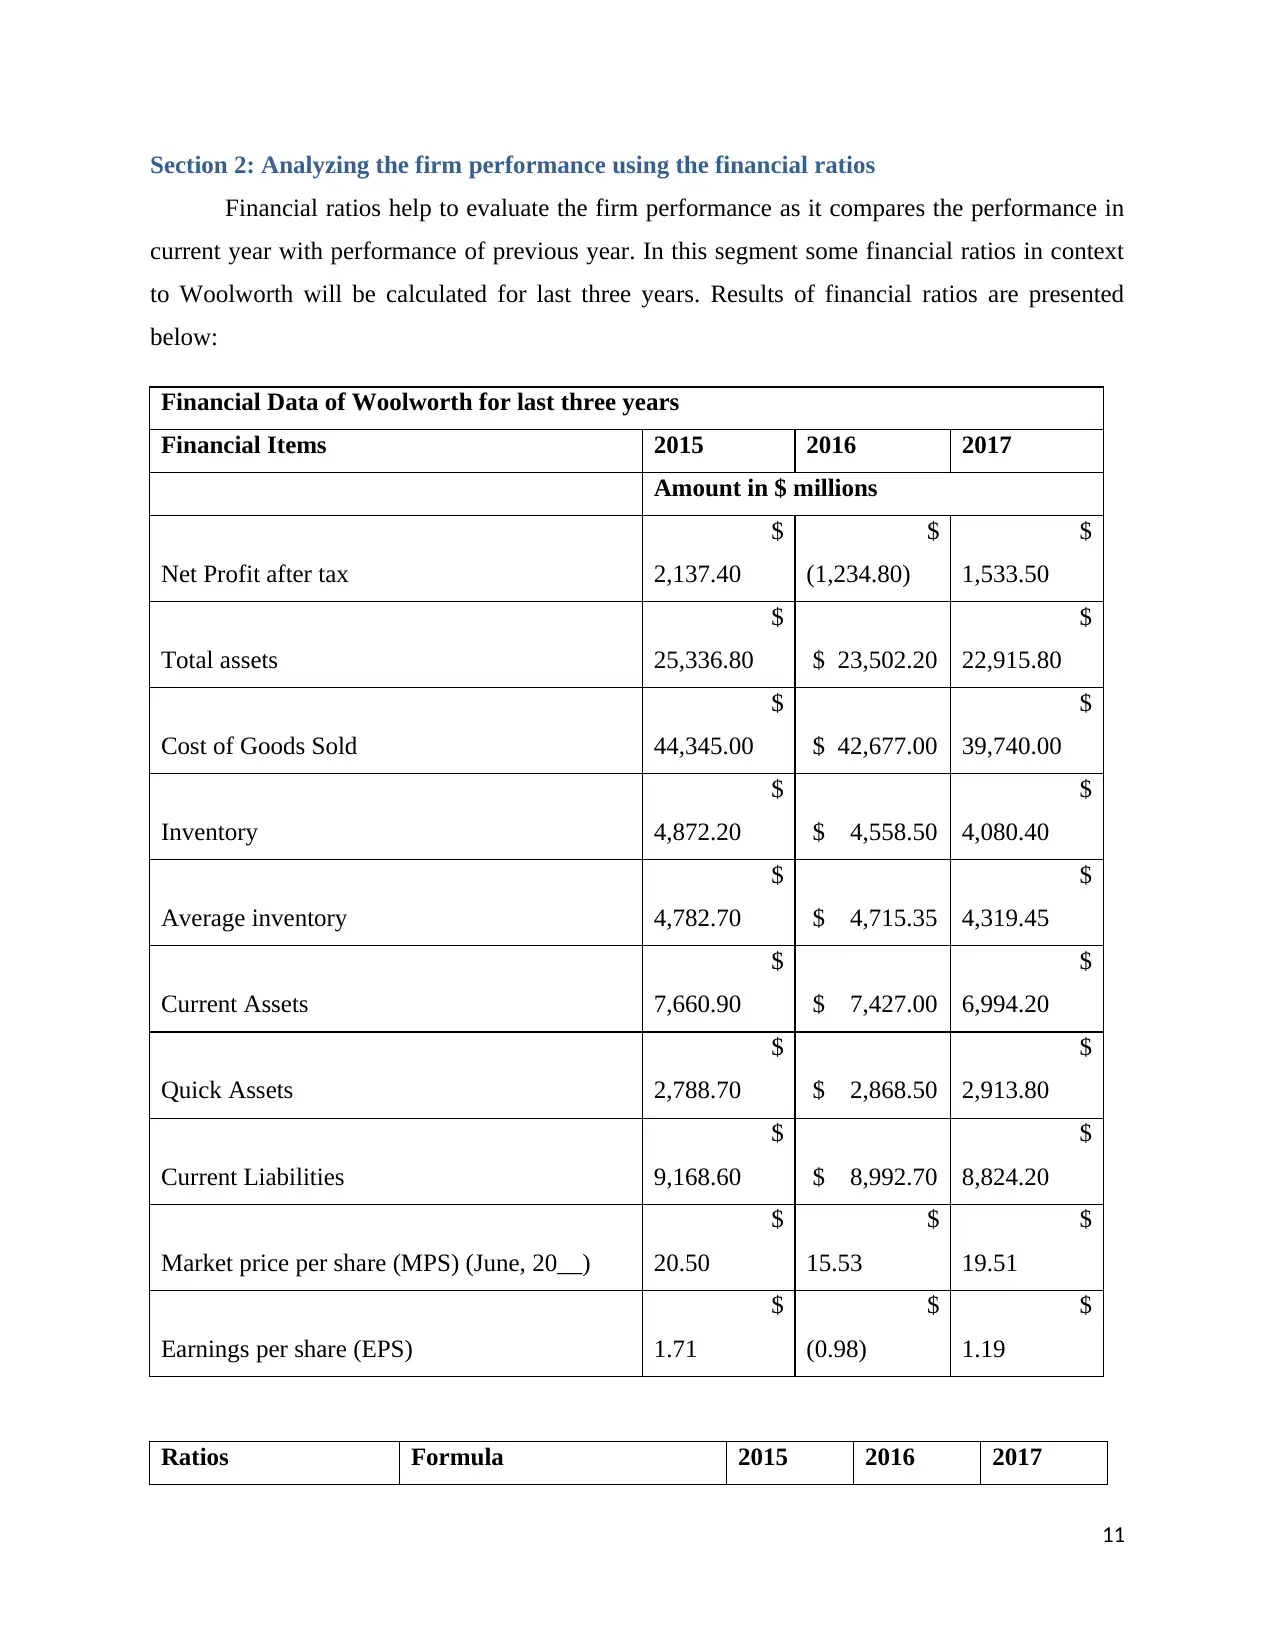
Section 2: Analyzing the firm performance using the financial ratios
Financial ratios help to evaluate the firm performance as it compares the performance in
current year with performance of previous year. In this segment some financial ratios in context
to Woolworth will be calculated for last three years. Results of financial ratios are presented
below:
Financial Data of Woolworth for last three years
Financial Items 2015 2016 2017
Amount in $ millions
Net Profit after tax
$
2,137.40
$
(1,234.80)
$
1,533.50
Total assets
$
25,336.80 $ 23,502.20
$
22,915.80
Cost of Goods Sold
$
44,345.00 $ 42,677.00
$
39,740.00
Inventory
$
4,872.20 $ 4,558.50
$
4,080.40
Average inventory
$
4,782.70 $ 4,715.35
$
4,319.45
Current Assets
$
7,660.90 $ 7,427.00
$
6,994.20
Quick Assets
$
2,788.70 $ 2,868.50
$
2,913.80
Current Liabilities
$
9,168.60 $ 8,992.70
$
8,824.20
Market price per share (MPS) (June, 20__)
$
20.50
$
15.53
$
19.51
Earnings per share (EPS)
$
1.71
$
(0.98)
$
1.19
Ratios Formula 2015 2016 2017
11
Profitability Ratio
Return on Assets
Net Profit after tax/Total
Assets 8.44% -5.25% 6.69%
Efficiency Ratios
Inventory Turnover
Ratio
Cost of Goods Sold/Average
Inventory 9.27 9.05 9.20
Liquidity Ratios
Quick Ratio
Quick Assets/Current
Liabilities 0.30 0.32 0.33
Market Ratios
Price Earnings Ratio
Market price per
share/Earnings per share 11.99 -15.85 16.39
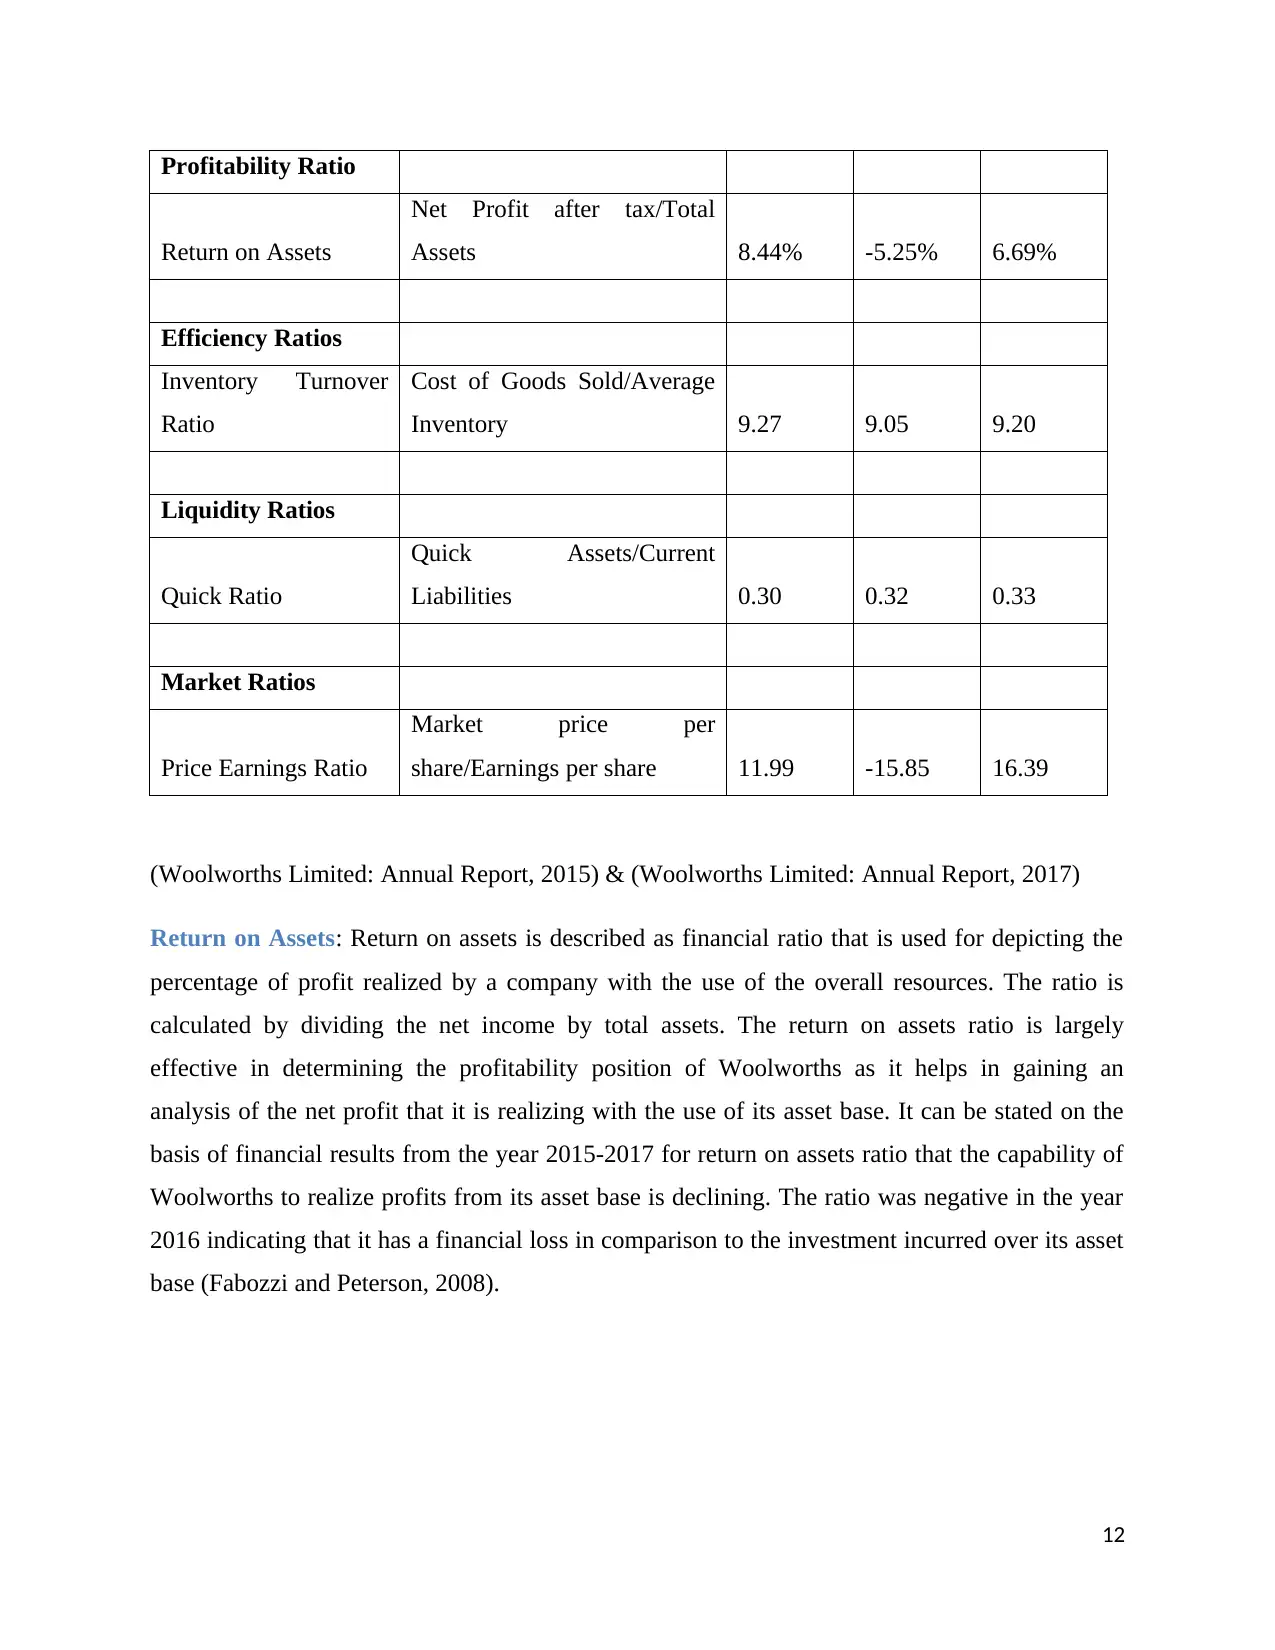
(Woolworths Limited: Annual Report, 2015) & (Woolworths Limited: Annual Report, 2017)
Return on Assets: Return on assets is described as financial ratio that is used for depicting the
percentage of profit realized by a company with the use of the overall resources. The ratio is
calculated by dividing the net income by total assets. The return on assets ratio is largely
effective in determining the profitability position of Woolworths as it helps in gaining an
analysis of the net profit that it is realizing with the use of its asset base. It can be stated on the
basis of financial results from the year 2015-2017 for return on assets ratio that the capability of
Woolworths to realize profits from its asset base is declining. The ratio was negative in the year
2016 indicating that it has a financial loss in comparison to the investment incurred over its asset
base (Fabozzi and Peterson, 2008).
12
Return on Assets
Net Profit after tax/Total
Assets 8.44% -5.25% 6.69%
Efficiency Ratios
Inventory Turnover
Ratio
Cost of Goods Sold/Average
Inventory 9.27 9.05 9.20
Liquidity Ratios
Quick Ratio
Quick Assets/Current
Liabilities 0.30 0.32 0.33
Market Ratios
Price Earnings Ratio
Market price per
share/Earnings per share 11.99 -15.85 16.39
(Woolworths Limited: Annual Report, 2015) & (Woolworths Limited: Annual Report, 2017)
Return on Assets: Return on assets is described as financial ratio that is used for depicting the
percentage of profit realized by a company with the use of the overall resources. The ratio is
calculated by dividing the net income by total assets. The return on assets ratio is largely
effective in determining the profitability position of Woolworths as it helps in gaining an
analysis of the net profit that it is realizing with the use of its asset base. It can be stated on the
basis of financial results from the year 2015-2017 for return on assets ratio that the capability of
Woolworths to realize profits from its asset base is declining. The ratio was negative in the year
2016 indicating that it has a financial loss in comparison to the investment incurred over its asset
base (Fabozzi and Peterson, 2008).
12
⊘ This is a preview!⊘
Do you want full access?
Subscribe today to unlock all pages.
Trusted by 1+ million students worldwide
1 out of 20
Related Documents


Your All-in-One AI-Powered Toolkit for Academic Success.
+13062052269
info@desklib.com
Available 24*7 on WhatsApp / Email
![[object Object]](/_next/static/media/star-bottom.7253800d.svg)
Unlock your academic potential
Copyright © 2020–2026 A2Z Services. All Rights Reserved. Developed and managed by ZUCOL.