Company Performance Analysis of Woolworths Limited: HI5002 Finance
VerifiedAdded on 2023/03/20
|15
|4535
|64
Report
AI Summary
This report presents a comprehensive financial analysis of Woolworths Limited, focusing on its performance from 2016 to 2018. The analysis includes a detailed examination of profitability ratios (Gross Margin, Net Margin, and Return on Capital Employed) and operating efficiency ratios (Days in Inventory Turnover, Days in Receivable Turnover, Days in Payable Turnover, and Cash Conversion Cycle). The report evaluates Woolworths' cash management practices, particularly its marketable securities, and assesses the impact of inventory and receivables. Furthermore, it incorporates a sensitivity analysis of a proposed new product development project, along with an identification of systematic and unsystematic risks. The report also covers Woolworths' dividend payout ratio and policy, culminating in recommendations based on the financial analysis.
Running head: COMPANY PERFORMANCE ANALYSIS
Company Performance Analysis
Name of the Student
Name of the University
Author’s Note
Company Performance Analysis
Name of the Student
Name of the University
Author’s Note
Paraphrase This Document
Need a fresh take? Get an instant paraphrase of this document with our AI Paraphraser
1COMPANY PERFORMANCE ANALYSIS
Abstract
The main objective of this report is the financial performance analysis of Woolworths
Limited for making appropriate investment decision. Analysis of profitability and
operational efficiency is a major part of this report. After that, analysis of the cash
management through the analysis of the marketable securities of Woolworths Limited is
another major aim of the report. This report undertakes the analysis of provided
scenario of proposed investment to determine whether the proposed project needs to
be selected or not. This report also shows the major systemic as well as un-systemic
risk of the company. Analysis of the dividend payout ratio is undertaken regarding
Woolworths Limited.
2COMPANY PERFORMANCE ANALYSIS
Table of Contents
I. Introduction.....................................................................................................................3
II. Financial Analysis of Woolworths..................................................................................3
2.1 Company Description...............................................................................................3
2.2 Calculation and Analysis of Woolworth’s Ratios......................................................3
2.3 Cash Management Analysis....................................................................................6
2.4 Performing a Sensitivity Analysis.............................................................................7
2.5 Identification and Discussion of Systematic and Unsystematic Risks...................10
2.6 Identification of Divided Payout Ratio and Dividend Policy...................................10
III. Recommendation Letter.............................................................................................11
IV. Conclusion..................................................................................................................11
References.......................................................................................................................13
⊘ This is a preview!⊘
Do you want full access?
Subscribe today to unlock all pages.
Trusted by 1+ million students worldwide
3COMPANY PERFORMANCE ANALYSIS
I. Introduction
Analyzing the financial statement of the company is an important factor to identify
the financial performance and to fetch the idea of future performance of the company.
As per above reasons the investors also analyzes the financial statement of the
company to identify the present and future financial performance for the purpose of
decision making process (Robinson et al. 2015). To conduct the decision making
process it involves the usage of different tools which include sensitivity analysis, ratio
analysis and many others. There are other kind of aspects for the decision making
process includes analysis of risks, marketable securities of the company and many
others (Easton and Sommers 2018). This report discusses about the analysis of the
financial statement of the company which is listed with the Australian Stock Exchange
(ASX) for the purpose of decision making process. The ASX listed company which is
considered for this report is Woolworths Limited (Woolworths).The division of this report
is provided below. The first part of the company involves the description of Woolworths.
The next part of this report includes the profitability ratio and efficiency ratio of the
company and analyzing the ratios from the financial statement of the company which
will in turn helps for decision making. The next part explains about the cash
management of Woolworths for analyzing the marketable securities of the company.
The next part includes the sensitivity analysis for the determination of the project. The
next part explains the identification of the systematic and unsystematic risks. The next
part talks about the dividend payout ratio and the dividend policy of the company. The
last part of this report provides the recommendation and the conclusion.
II. Financial Analysis of Woolworths
2.1 Company Description
Woolworths Group is one of the largest companies all throughout Australia and
New Zealand. The company mainly deals with retain and have presence in other kind of
business like liquor retailer, gaming and poker machine operator. The company started
its business way back in 1924. The company has more than 3000 stores all throughout
Australia and moreover it is still counting. The company associated with more than
thousands of local farmers and manufactures of the goods. The company is responsible
for the 201,000 jobs for the working class. Utilizing the huge goodwill the company has
gained trust of more than 29 million customers in total. The company lives up to their
mission statement which states that the company will provide best convenience, value
and quality for the customers who are associated with the company
(woolworthsgroup.com.au 2019).
2.2 Calculation and Analysis of Woolworth’s Ratios
In order to analyze the financial performance as well as financial position of
Woolworths, the analysis of both profitability and efficiency is paramount ((Agha 2014)).
The following discussion shows the profitability as well as efficiency ratio analysis of
Woolworths.
Profitability Analysis
Paraphrase This Document
Need a fresh take? Get an instant paraphrase of this document with our AI Paraphraser
4COMPANY PERFORMANCE ANALYSIS
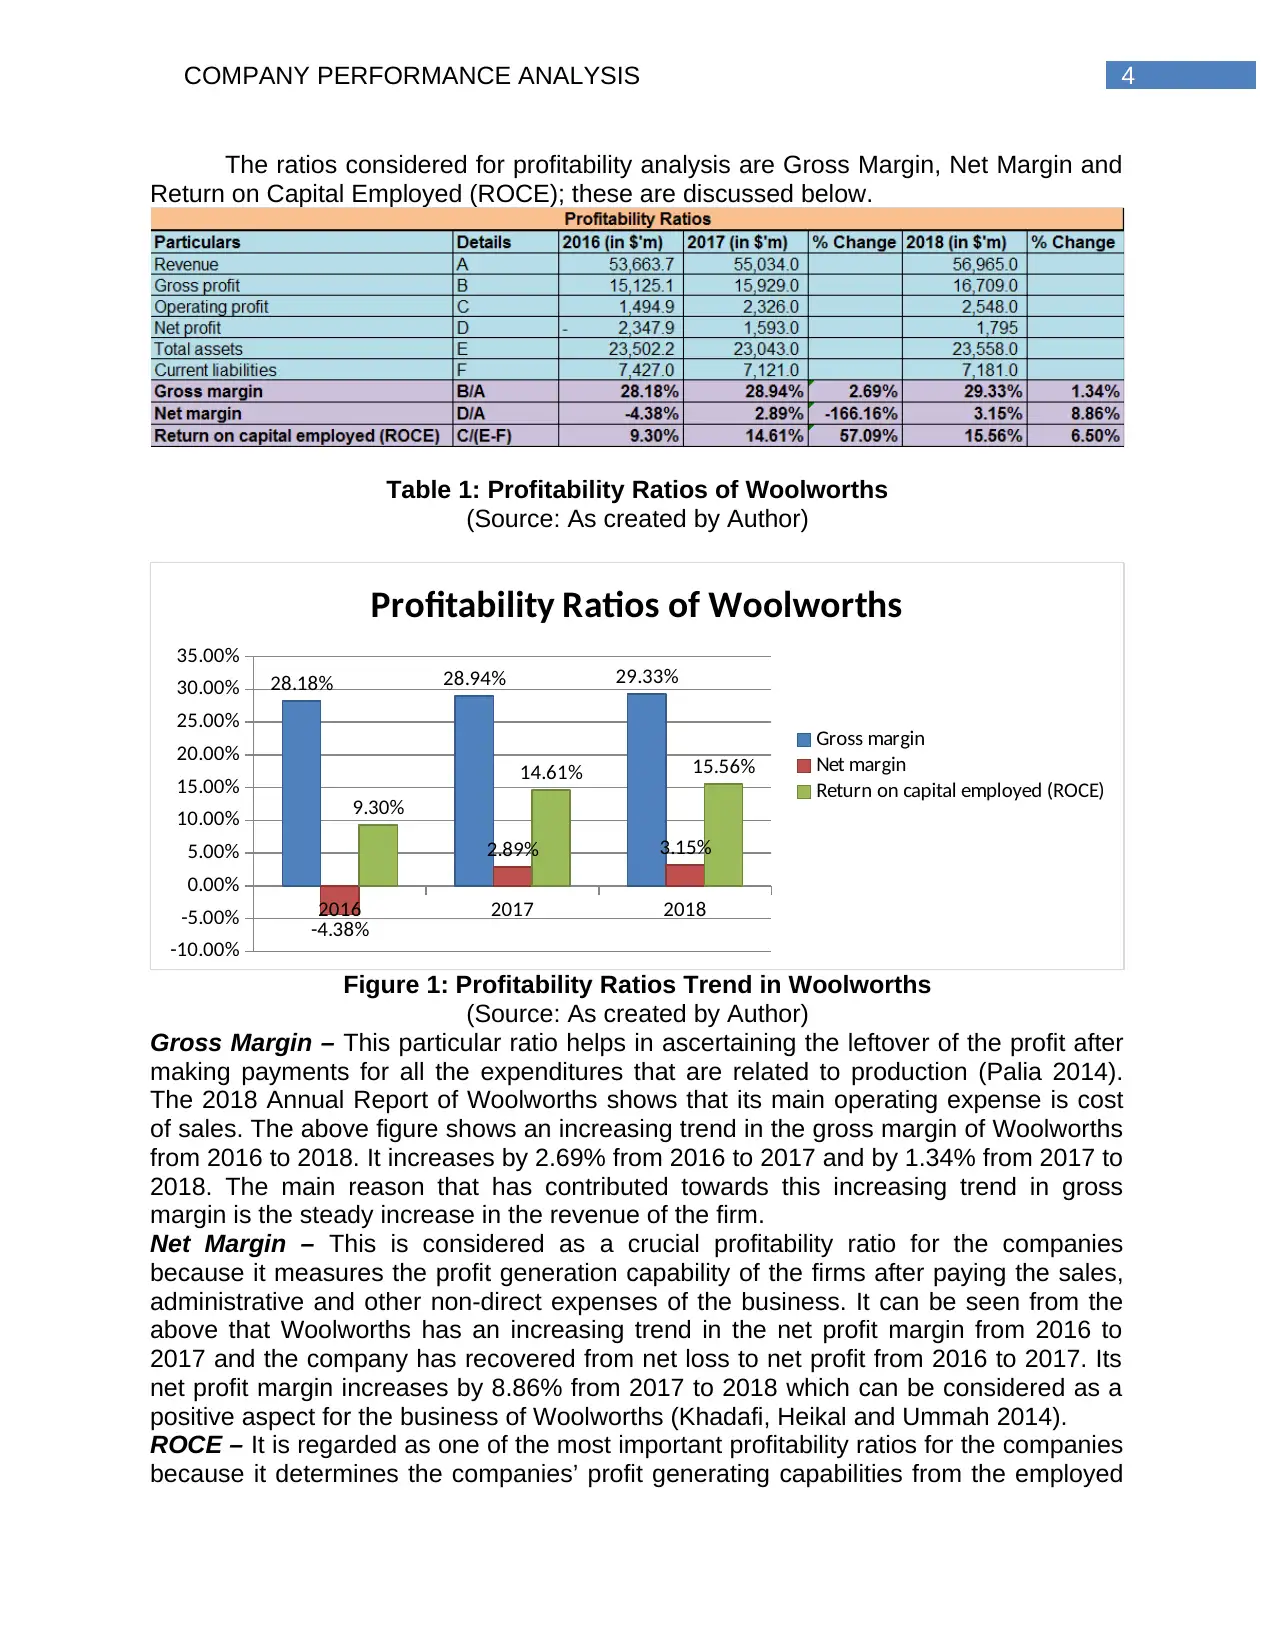
The ratios considered for profitability analysis are Gross Margin, Net Margin and
Return on Capital Employed (ROCE); these are discussed below.
Table 1: Profitability Ratios of Woolworths
(Source: As created by Author)
2016 2017 2018
-10.00%
-5.00%
0.00%
5.00%
10.00%
15.00%
20.00%
25.00%
30.00%
35.00%
28.18% 28.94% 29.33%
-4.38%
2.89% 3.15%
9.30%
14.61% 15.56%
Profitability Ratios of Woolworths
Gross margin
Net margin
Return on capital employed (ROCE)
Figure 1: Profitability Ratios Trend in Woolworths
(Source: As created by Author)
Gross Margin – This particular ratio helps in ascertaining the leftover of the profit after
making payments for all the expenditures that are related to production (Palia 2014).
The 2018 Annual Report of Woolworths shows that its main operating expense is cost
of sales. The above figure shows an increasing trend in the gross margin of Woolworths
from 2016 to 2018. It increases by 2.69% from 2016 to 2017 and by 1.34% from 2017 to
2018. The main reason that has contributed towards this increasing trend in gross
margin is the steady increase in the revenue of the firm.
Net Margin – This is considered as a crucial profitability ratio for the companies
because it measures the profit generation capability of the firms after paying the sales,
administrative and other non-direct expenses of the business. It can be seen from the
above that Woolworths has an increasing trend in the net profit margin from 2016 to
2017 and the company has recovered from net loss to net profit from 2016 to 2017. Its
net profit margin increases by 8.86% from 2017 to 2018 which can be considered as a
positive aspect for the business of Woolworths (Khadafi, Heikal and Ummah 2014).
ROCE – It is regarded as one of the most important profitability ratios for the companies
because it determines the companies’ profit generating capabilities from the employed
5COMPANY PERFORMANCE ANALYSIS
capital. It can be seen from the above table that Woolworths has an increasing trend in
ROCE from 2016 to 2018 because this ration increases by 57.09% from 2016 to 2017
and 6.50% from 2017 to 2018. The main reason for this is the increase in the operating
profit of the company from 2016 to 2018 (Jenkins and Williamson 2015).
On the overall basis, an increasing trend can be seen in all the above three
profitability ratios of Woolworths mainly due to the increase in sales, operating profit and
others. This aspect is a major positive indicator of the effective profitability position of
Woolworths from 2016 to 2018.
Operating Efficiency Ratios Analysis
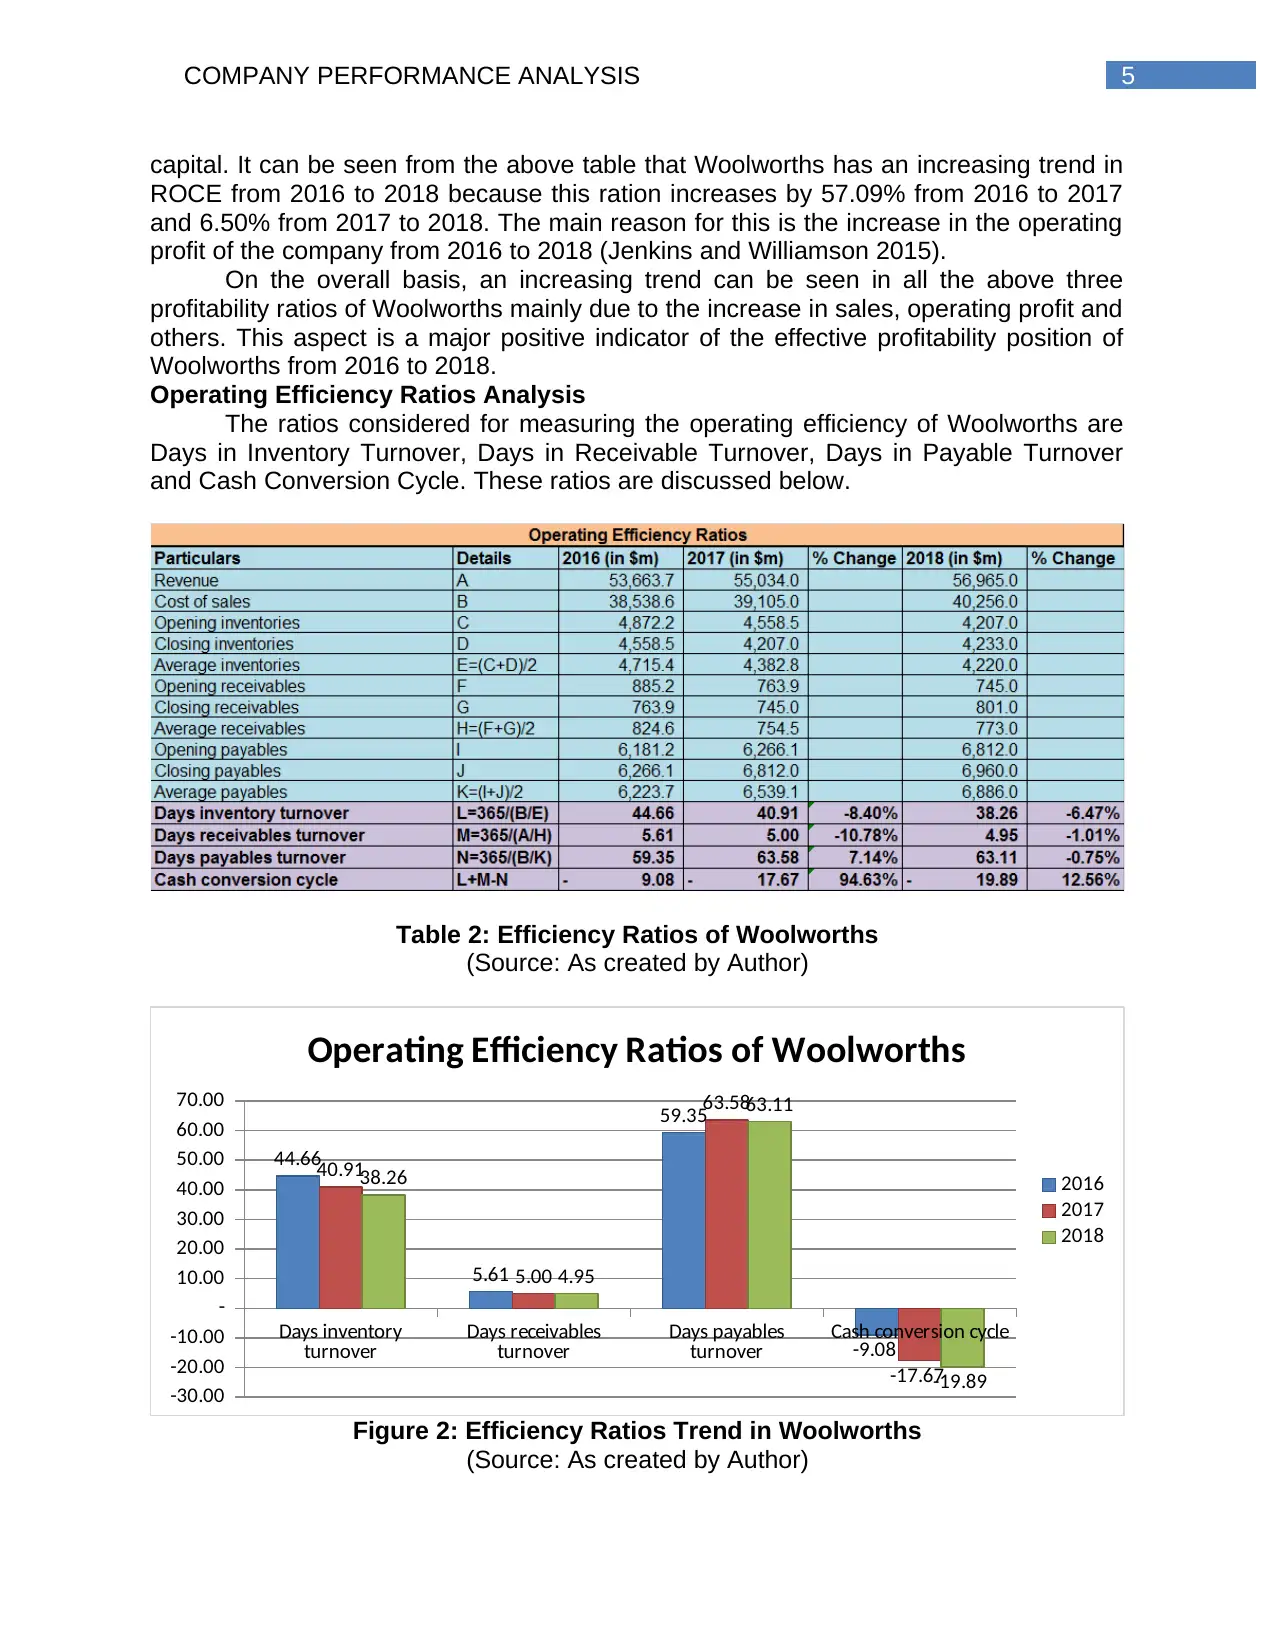
The ratios considered for measuring the operating efficiency of Woolworths are
Days in Inventory Turnover, Days in Receivable Turnover, Days in Payable Turnover
and Cash Conversion Cycle. These ratios are discussed below.
Table 2: Efficiency Ratios of Woolworths
(Source: As created by Author)
Days inventory
turnover Days receivables
turnover Days payables
turnover Cash conversion cycle
-30.00
-20.00
-10.00
-
10.00
20.00
30.00
40.00
50.00
60.00
70.00
44.66
5.61
59.35
-9.08
40.91
5.00
63.58
-17.67
38.26
4.95
63.11
-19.89
Operating Efficiency Ratios of Woolworths
2016
2017
2018
Figure 2: Efficiency Ratios Trend in Woolworths
(Source: As created by Author)
capital. It can be seen from the above table that Woolworths has an increasing trend in
ROCE from 2016 to 2018 because this ration increases by 57.09% from 2016 to 2017
and 6.50% from 2017 to 2018. The main reason for this is the increase in the operating
profit of the company from 2016 to 2018 (Jenkins and Williamson 2015).
On the overall basis, an increasing trend can be seen in all the above three
profitability ratios of Woolworths mainly due to the increase in sales, operating profit and
others. This aspect is a major positive indicator of the effective profitability position of
Woolworths from 2016 to 2018.
Operating Efficiency Ratios Analysis
The ratios considered for measuring the operating efficiency of Woolworths are
Days in Inventory Turnover, Days in Receivable Turnover, Days in Payable Turnover
and Cash Conversion Cycle. These ratios are discussed below.
Table 2: Efficiency Ratios of Woolworths
(Source: As created by Author)
Days inventory
turnover Days receivables
turnover Days payables
turnover Cash conversion cycle
-30.00
-20.00
-10.00
-
10.00
20.00
30.00
40.00
50.00
60.00
70.00
44.66
5.61
59.35
-9.08
40.91
5.00
63.58
-17.67
38.26
4.95
63.11
-19.89
Operating Efficiency Ratios of Woolworths
2016
2017
2018
Figure 2: Efficiency Ratios Trend in Woolworths
(Source: As created by Author)
⊘ This is a preview!⊘
Do you want full access?
Subscribe today to unlock all pages.
Trusted by 1+ million students worldwide
6COMPANY PERFORMANCE ANALYSIS
Days in Inventory Turnover – It is considered as a major efficiency ratio that
ascertains the firm’s capability in clearing their inventories through selling them. It can
be seen from the above figure that there is a gradual decreasing trend in this ratio for
Woolworths from 2016 to 2018; that is by 8.40% from 2016 to 2017 and 6.47% from
2017 to 2018. This can be considered as a positive financial aspect for Woolworths
which indicates the increase in the company’s ability to clear their inventories in faster
basis through the increase in sales. This is good for the company’s overall operating
efficiency (Nallusamy, Balaji and Sundar 2017).
Days in Receivable Turnover – Days in inventory receivable is considered as another
major efficiency ratio for the companies that ascertain the firm’s capability in collecting
the dues from its debtors on speedy basis. It is observable from the above figure that
there a minor decreasing trend in this ratio for Woolworths from 2016 to 2018 that is by
10.78% from 2016 to 2017 and 1.01% from 2017 to 2018. The decrease in this
indicates towards the positive fact that Woolworths has been efficient in collecting the
dues from its debtors in lesser time from 2016 to 2018 which denotes the increase in
operating efficiency of the firm (Mathuva 2015).
Days in Payable Turnover – This is another crucial efficiency ratio for the companies
that help in determining the company’s capability in paying the dues of the creditors.
According to the above figure, this particular ratio increases from 2016 to 2017 by
7.14% and then decreases from 2017 to 2018 by 0.75%. However, it can be considered
as a positive aspect for Woolworths since this ratio is smaller than the days in accounts
receivable (Ukaegbu 2014).
Cash Conversion Cycle – This is a major operating efficiency ratio that helps in
ascertaining the capability of the companies to convert different resources into cash.
According to the above figure, there is an increasing trend in this ratio for Woolworths
from 2016 to 2018 which indicates that the company is taking more time to convert their
resources into cash (Yazdanfar and Öhman 2014).
On the overall basis, it can be said that Woolworths has an effective operating
efficiency position due to the presence of decreasing trend in days in inventory turnover
and receivable turnover and increase in days in payable turnover. These are crucial
aspects for the operating efficiency of the firm.
2.3 Cash Management Analysis
Marketable securities of the current assets can be state that the current assets
which are present in the balance sheet of the company can readily change into cash
(Panigrahi 2013). The marketable securities of the current assets in the balance sheet
of Woolworths include cash and cash equivalent, trade and other receivable and
inventories.
The value of the cash and cash equivalent of Woolworths $1,273,000,000 in the
year 2018 and in 2017 the value holds to be $909,000,000. It can be understood from
the comparison of the value of the cash and cash equivalent between the year 2017
and 2018, that there a considerable increase in the amount from the year 2017 to 2018
(woolworthsgroup.com.au 2019). The increase in the cash and cash equivalent states
that the company has some readily cash or the assets which can be converted easily
during any kind of market change and in terms of shortage and also to compensate
when there is a shortage of cash for the payment to the creditors. After analyzing the
financial report of the annual report of the company it can be also understood that there
Paraphrase This Document
Need a fresh take? Get an instant paraphrase of this document with our AI Paraphraser
7COMPANY PERFORMANCE ANALYSIS
is a considerable increase in the inventory from the year 2017 and 2018
(woolworthsgroup.com.au 2019). This indicates that the company has some serious of
inventory so the company does not need to buy new inventory and hence there will be a
decrease in the cost of goods sold. As per the annual report of the company bit can be
also be understood that the company has seen a considerable amount of increase in
the section of trade receivables. As per the financial statement of the company it is
observed that the company has fetched $801,000,000 amount in 2018 and in 2017 the
company fetch $$745,000,000 (woolworthsgroup.com.au 2019). It can be seen that
there is a considerable increase in terms of the previous year. From the above analysis
it can be stated that Woolworths have considerable amount of cash in hand which can
be used by the company in different ways to increase the productivity of the company
(Purnus and Bodea 2015).
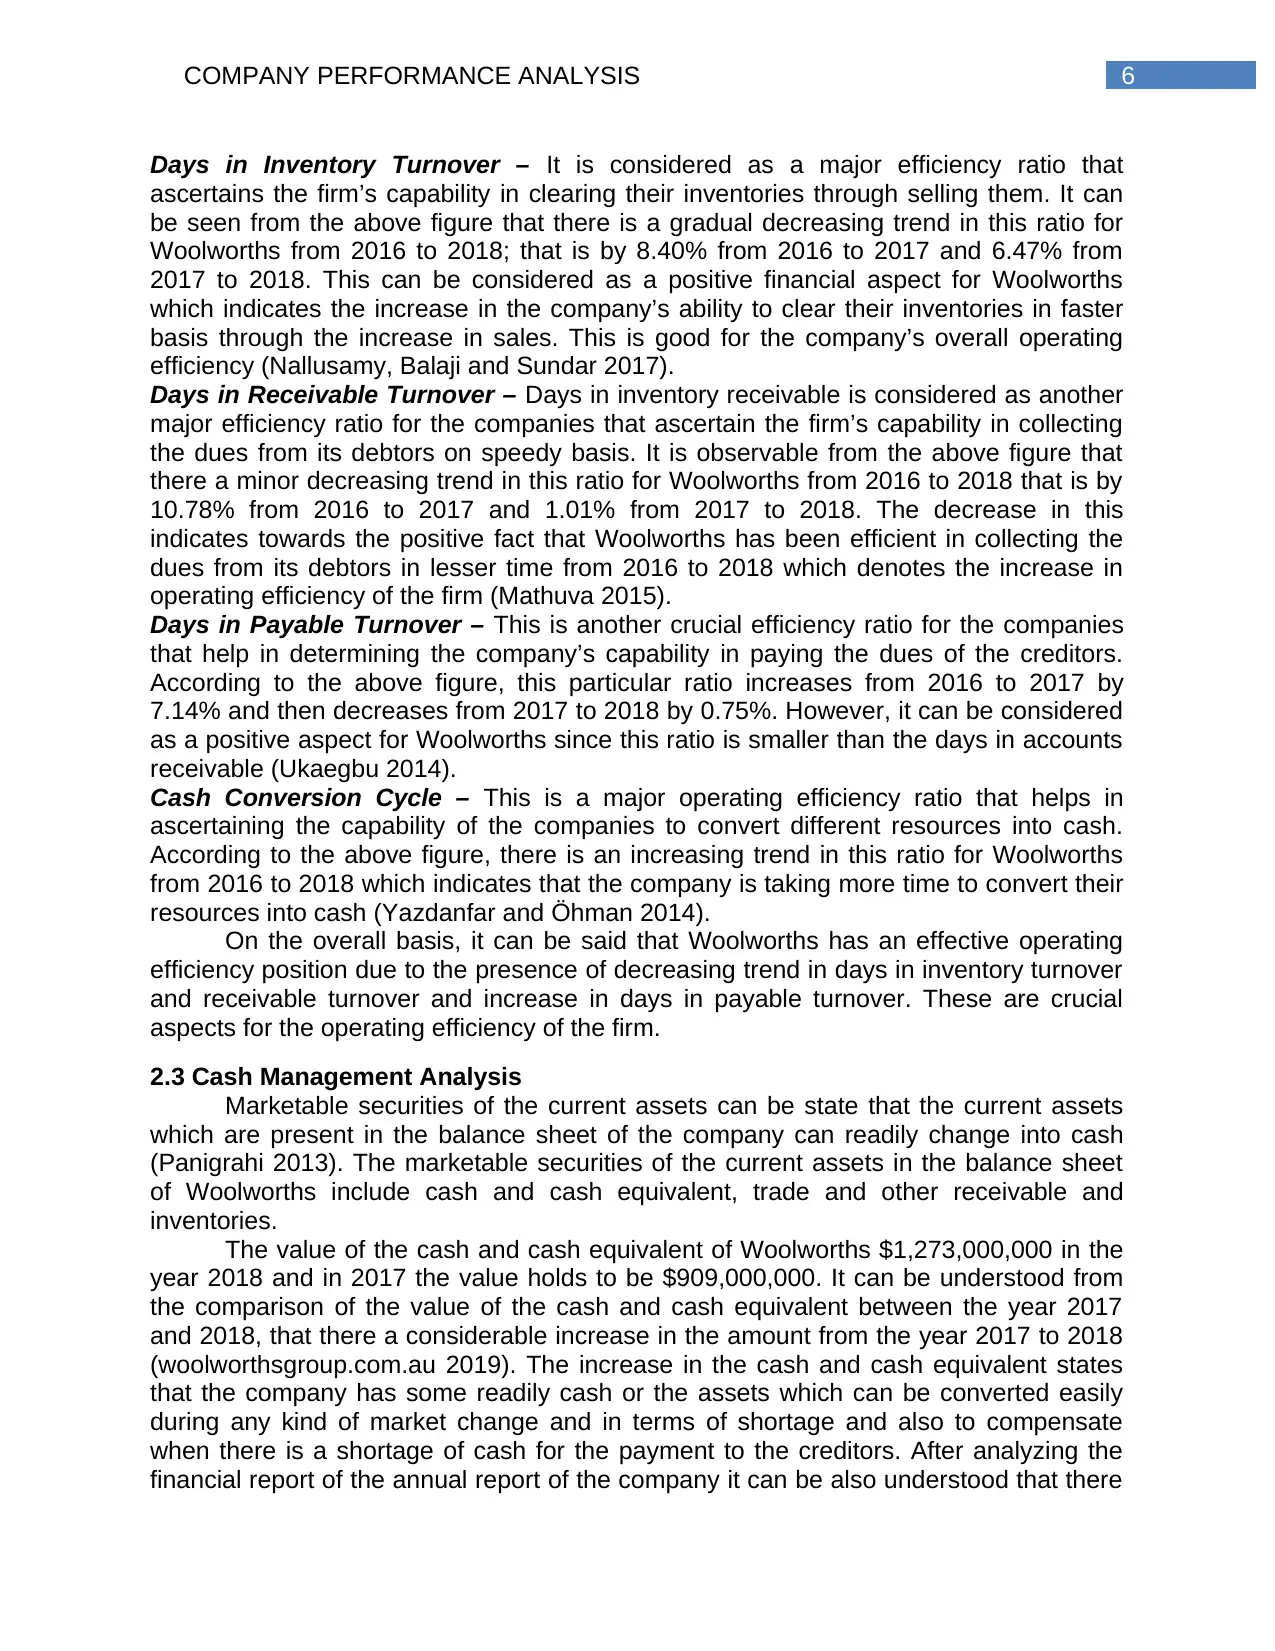
2.4 Performing a Sensitivity Analysis
Sensitivity Analysis
In this part explains the situation where Woolworths entered into a project for
developing a new product. There are two scenarios have been taken into consideration
where there is normal scenario and sensitivity analysis has taken into account with the
presence of certain changes.
is a considerable increase in the inventory from the year 2017 and 2018
(woolworthsgroup.com.au 2019). This indicates that the company has some serious of
inventory so the company does not need to buy new inventory and hence there will be a
decrease in the cost of goods sold. As per the annual report of the company bit can be
also be understood that the company has seen a considerable amount of increase in
the section of trade receivables. As per the financial statement of the company it is
observed that the company has fetched $801,000,000 amount in 2018 and in 2017 the
company fetch $$745,000,000 (woolworthsgroup.com.au 2019). It can be seen that
there is a considerable increase in terms of the previous year. From the above analysis
it can be stated that Woolworths have considerable amount of cash in hand which can
be used by the company in different ways to increase the productivity of the company
(Purnus and Bodea 2015).
2.4 Performing a Sensitivity Analysis
Sensitivity Analysis
In this part explains the situation where Woolworths entered into a project for
developing a new product. There are two scenarios have been taken into consideration
where there is normal scenario and sensitivity analysis has taken into account with the
presence of certain changes.
8COMPANY PERFORMANCE ANALYSIS
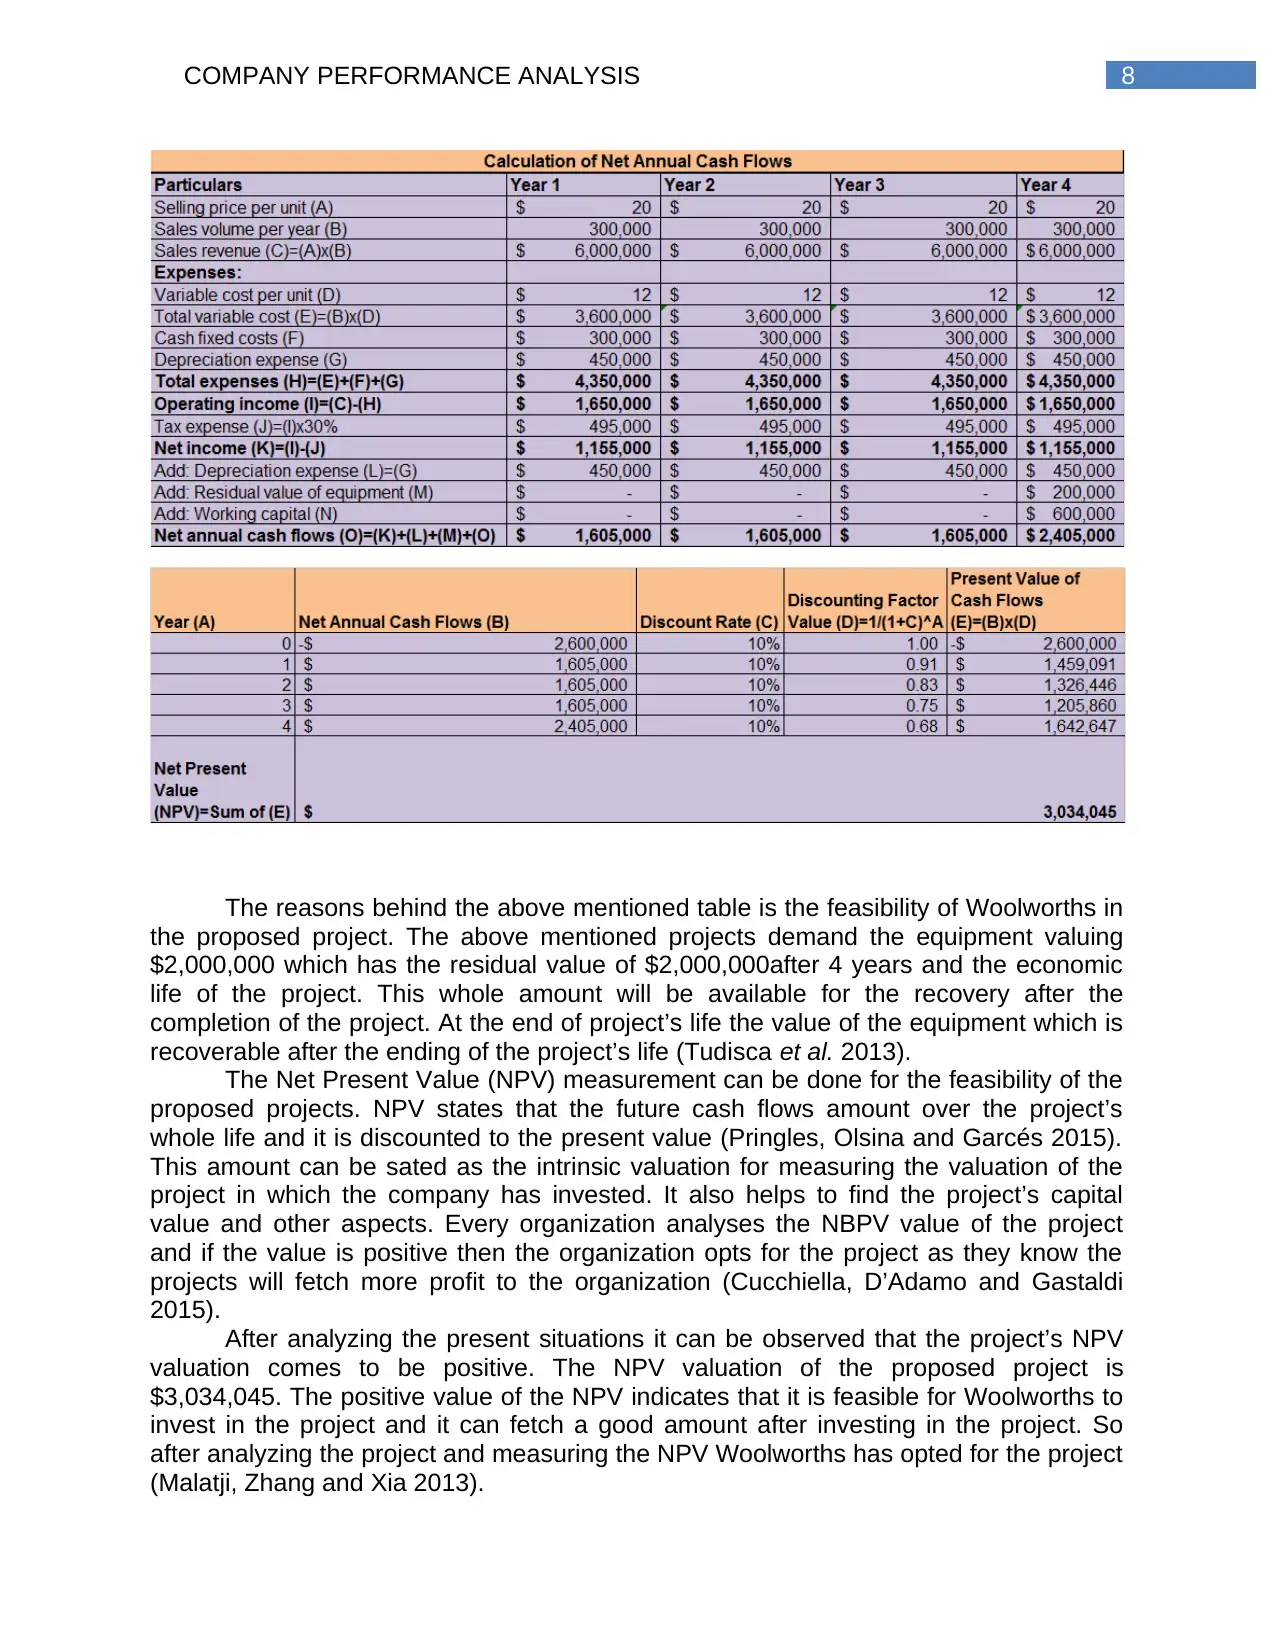
The reasons behind the above mentioned table is the feasibility of Woolworths in
the proposed project. The above mentioned projects demand the equipment valuing
$2,000,000 which has the residual value of $2,000,000after 4 years and the economic
life of the project. This whole amount will be available for the recovery after the
completion of the project. At the end of project’s life the value of the equipment which is
recoverable after the ending of the project’s life (Tudisca et al. 2013).
The Net Present Value (NPV) measurement can be done for the feasibility of the
proposed projects. NPV states that the future cash flows amount over the project’s
whole life and it is discounted to the present value (Pringles, Olsina and Garcés 2015).
This amount can be sated as the intrinsic valuation for measuring the valuation of the
project in which the company has invested. It also helps to find the project’s capital
value and other aspects. Every organization analyses the NBPV value of the project
and if the value is positive then the organization opts for the project as they know the
projects will fetch more profit to the organization (Cucchiella, D’Adamo and Gastaldi
2015).
After analyzing the present situations it can be observed that the project’s NPV
valuation comes to be positive. The NPV valuation of the proposed project is
$3,034,045. The positive value of the NPV indicates that it is feasible for Woolworths to
invest in the project and it can fetch a good amount after investing in the project. So
after analyzing the project and measuring the NPV Woolworths has opted for the project
(Malatji, Zhang and Xia 2013).
⊘ This is a preview!⊘
Do you want full access?
Subscribe today to unlock all pages.
Trusted by 1+ million students worldwide
9COMPANY PERFORMANCE ANALYSIS
Sensitivity Analysis
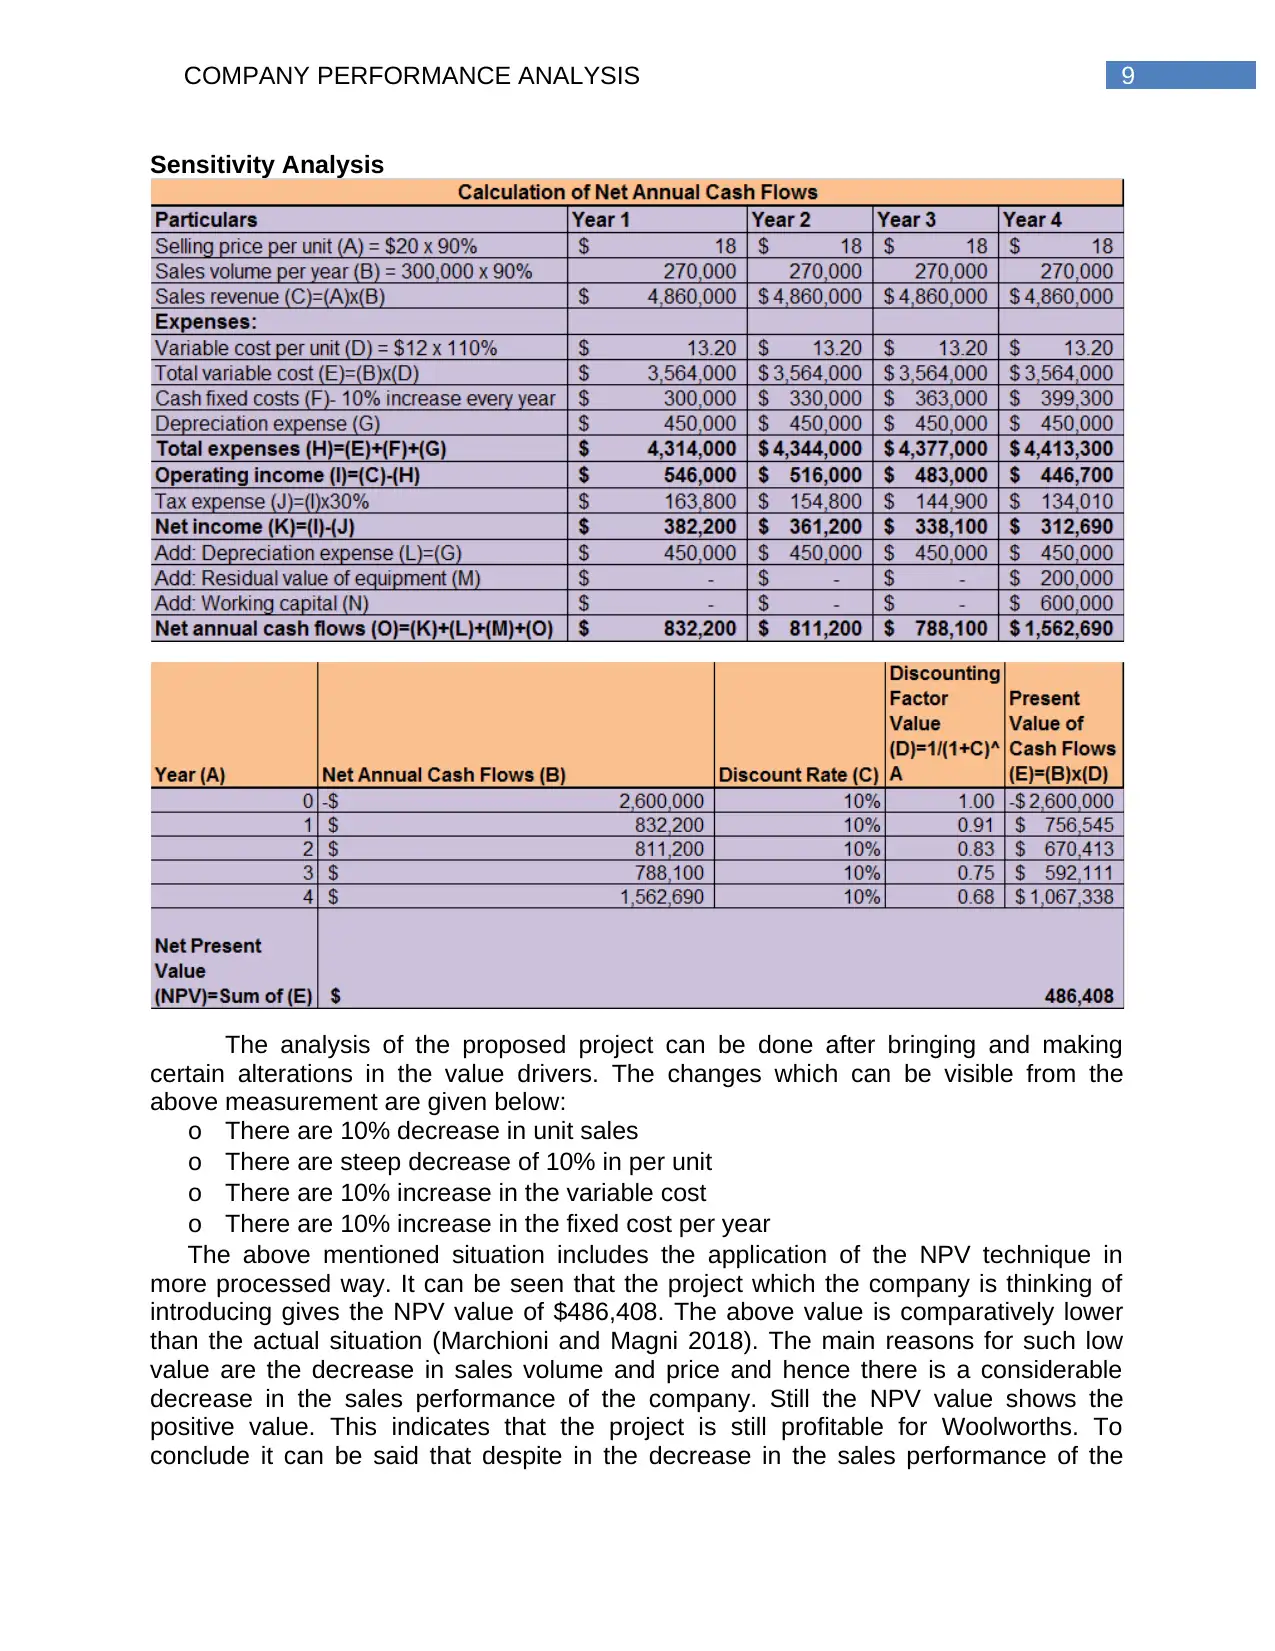
The analysis of the proposed project can be done after bringing and making
certain alterations in the value drivers. The changes which can be visible from the
above measurement are given below:
o There are 10% decrease in unit sales
o There are steep decrease of 10% in per unit
o There are 10% increase in the variable cost
o There are 10% increase in the fixed cost per year
The above mentioned situation includes the application of the NPV technique in
more processed way. It can be seen that the project which the company is thinking of
introducing gives the NPV value of $486,408. The above value is comparatively lower
than the actual situation (Marchioni and Magni 2018). The main reasons for such low
value are the decrease in sales volume and price and hence there is a considerable
decrease in the sales performance of the company. Still the NPV value shows the
positive value. This indicates that the project is still profitable for Woolworths. To
conclude it can be said that despite in the decrease in the sales performance of the
Sensitivity Analysis
The analysis of the proposed project can be done after bringing and making
certain alterations in the value drivers. The changes which can be visible from the
above measurement are given below:
o There are 10% decrease in unit sales
o There are steep decrease of 10% in per unit
o There are 10% increase in the variable cost
o There are 10% increase in the fixed cost per year
The above mentioned situation includes the application of the NPV technique in
more processed way. It can be seen that the project which the company is thinking of
introducing gives the NPV value of $486,408. The above value is comparatively lower
than the actual situation (Marchioni and Magni 2018). The main reasons for such low
value are the decrease in sales volume and price and hence there is a considerable
decrease in the sales performance of the company. Still the NPV value shows the
positive value. This indicates that the project is still profitable for Woolworths. To
conclude it can be said that despite in the decrease in the sales performance of the
Paraphrase This Document
Need a fresh take? Get an instant paraphrase of this document with our AI Paraphraser
10COMPANY PERFORMANCE ANALYSIS
company but still the company can fetch profit from and hence for Woolworths the
return on investment will be much higher (Pringles, Olsina and Garcés 2015).
2.5 Identification and Discussion of Systematic and Unsystematic Risks
Systematic risks is said to be risks which took place due to change in the market
condition in which the company is working in. The systematic risks involve inflation,
interest changes and many others. There are some systematic risks provided below:
Strategy and Completion:
Woolworths need to face much competition in their business. The continuous
change in the customer needs the company leads to be a challenge for the company.
The company created the approach of customer 1st strategy to deal with this kind of
problem (woolworthsgroup.com.au 2019).
Customer and Marketplace
The customer needs =is continuously evolving as the customer are expecting to
receive more convenience in the daily life. The company are successful to counter this
challenge and hence able to serve their customer (woolworthsgroup.com.au 2019).
Socio-political
The company faces different kind of problem after the financial crisis. The
company continue to invest in a team who looks after such kind of problem..
Unsystematic risks are a type of risk which the company faces internally. The
different types of unsystematic risks are as follows:
Business Transformation
The success behind the investment and investment opportunities and other
changes depends on the ability of the company to handle. The company has come up
with different kind of strategy for dealing with such risks.
Product and Food Safety
As the company doing their business in the retail industry they mostly deal with
the food products. The company implements many ways to maintain the quality of the
food. The company also created Supplier Excellence Program for dealing with such
issue.
Asset and Data Loss
There are potential of facing some risks regarding the intervention in the security
system and loss of data. The company has come up with Conduct and Privacy Policy.
This helped the company to safeguard their data and the assets
(woolworthsgroup.com.au 2019).
2.6 Identification of Divided Payout Ratio and Dividend Policy
Investors of the companies consider the dividend payout ratio as a crucial tool for
ascertaining the net income’s percentage that is distributed by the companies as
dividend among the shareholders. This ratio is also crucial for ascertaining the
percentage of company’s profit that is kept aside for funding the operations of the
companies (Floyd, Li and Skinner 2015). The following table shows the dividend payout
ratio of Woolworths from 2016 to 2018.
11COMPANY PERFORMANCE ANALYSIS
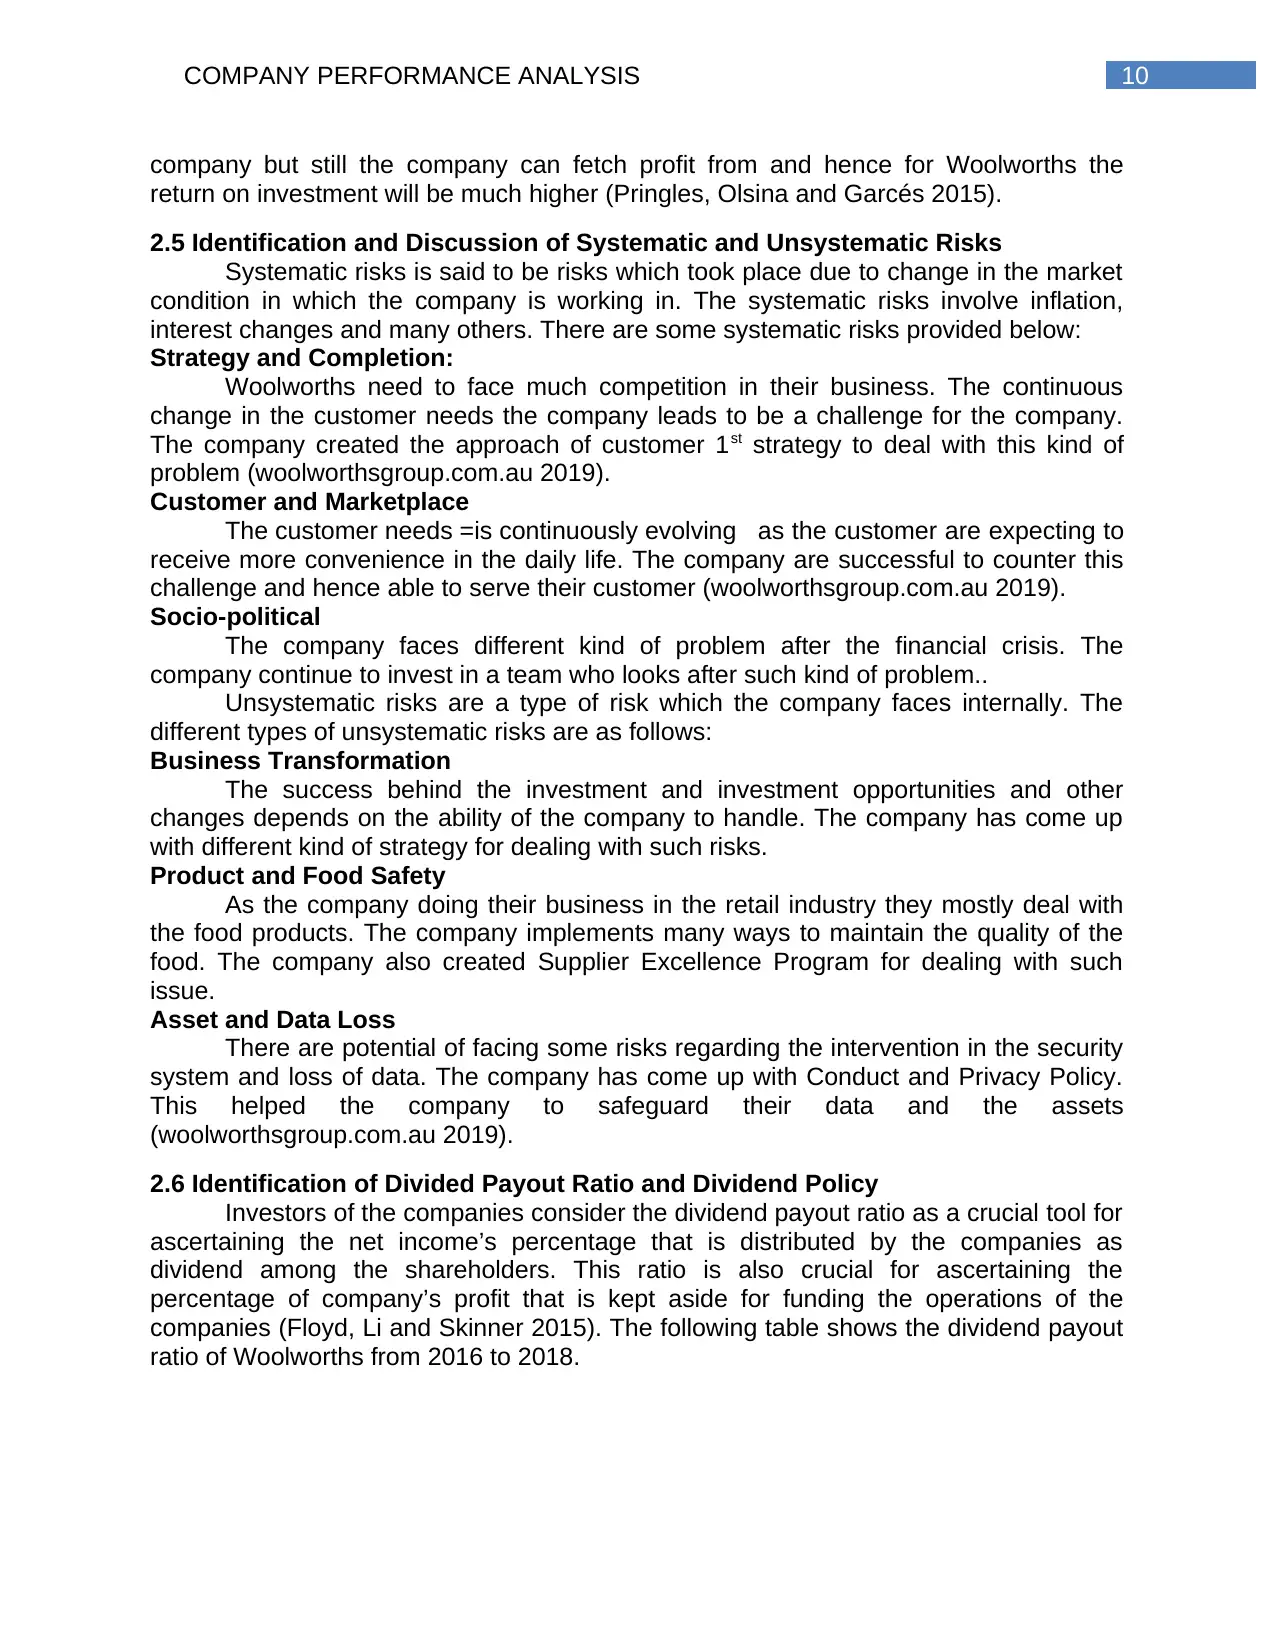
Table 3: Dividend Payout Ratios of Woolworths
(Source: As created by Author)
According to the above table, there is increase in the dividend payout ratio of
Woolworths from 2016 to 2017 because the company had a negative dividend payout
ratio in 2016. After that, this particular ratio has again decreased in the year 2018 as
compared to 2017. It indicates towards the fact that Woolworths has decreased the
percentage of profit in the current year for distributing as dividend and the main reason
for this is the change in the dividend policy of the company in the recent years that is to
increase the amount of retained earnings while decreasing the amount of dividend
(Musiega et al. 2013).
III. Recommendation Letter
To,
Harry Steve
London, UK
Date: 22.05.2019
Subject: Recommendation on Investment
Dear Sir,
I would like to recommend you to take into account some aspects at the time to
make investment decision regarding Woolworths Limited since this will help you in
getting best return on investment. In the last three years, Woolworths Limited has an
excellent profitability position due to the increase in gross margin, net margin and
ROCE. At the same time, Woolworths Limited has shown their operational efficiency by
reducing both the days in inventory turnover and receivable turnover. However, the
company has decided to increase their retained earnings by reducing the divided to the
shareholders and it is for the business development. There are certain systemic as well
as unsystematic risks that you are also required to be considered. However, on the
overall basis, the company has excellent profitability as well as efficiency position that
support the investment decision in Woolworths Limited.
Yours Sincerely,
ABC Investment Corp.
IV. Conclusion
The above discussion indicates towards the crucial fact that Woolworths has an
effective profitability and operating efficiency position over the last three years which is
a major positive factor for the company. It can also be seen from the above that the
company has a better cash management position due to the presence of certain major
marketable securities in current assets. It is observable from the above sensitivity
⊘ This is a preview!⊘
Do you want full access?
Subscribe today to unlock all pages.
Trusted by 1+ million students worldwide
1 out of 15
Related Documents


Your All-in-One AI-Powered Toolkit for Academic Success.
+13062052269
info@desklib.com
Available 24*7 on WhatsApp / Email
![[object Object]](/_next/static/media/star-bottom.7253800d.svg)
Unlock your academic potential
Copyright © 2020–2026 A2Z Services. All Rights Reserved. Developed and managed by ZUCOL.