Financial Analysis Report: Woolworths Limited Performance (FINA600)
VerifiedAdded on 2023/06/09
|15
|3780
|474
Report
AI Summary
This report presents a financial analysis of Woolworths Limited, Australia's largest supermarket chain, based on the 2016 and 2017 financial statements. The analysis includes a review of the income statement, balance sheet, and cash flow statement, highlighting key changes and trends. A detailed ratio analysis is conducted, covering profitability, efficiency, liquidity, and gearing ratios to assess the company's financial health. The report reveals improvements in sales growth, profitability, and balance sheet deleveraging in FY2017 compared to FY2016. However, it also notes concerns about shrinking margins, particularly in the grocery segment. The report concludes with recommendations and an overall assessment of the company's financial performance and future prospects, ultimately leading to a decision not to invest in the company due to margin concerns and industry competition.
R S M DWOOLWO TH LI ITE
A C A R RMA CFIN N I L PE FO N E
S D DTU ENT I :
[Pick the date]
A C A R RMA CFIN N I L PE FO N E
S D DTU ENT I :
[Pick the date]
Paraphrase This Document
Need a fresh take? Get an instant paraphrase of this document with our AI Paraphraser
Executive Summary
The objective of this report is to perform a financial analysis of Woolworths Limited which is
the biggest supermarket in Australia. The analysis of the financial statements for FY2016 and
FY2017 has been offered where critical changes in the income statement, balance sheet and
cash flow statement have been highlighted. Also, a detailed ratio analysis of the company has
been undertaken using the most recent annual report. The analysis highlights that there has
been an improvement in the financial performance of the company in FY2017 as compared to
FY2016. This improvement is particularly apparent in terms of sales growth, improvement of
profits and deleveraging of balance sheet. However, a key aspect which is of concern is the
falling margins especially in the grocery segment which account for the bulk of the
company’s business. Margins in this segment are expected to remain under pressure
considering the high degree of competition coupled with high concentration in the industry.
Owing to concerns on this front in the near future, decision has been taken not to invest in the
company.
2
TABLE OF CONTENTS
1.0 Company Background.....................................................................................................4
2.0 Company Analysis...............................................................................................................4
2.1 Financial Statements & Financial Performance...............................................................4
2.2 Economic Outlook............................................................................................................5
3.0 Ratio Analysis......................................................................................................................6
3.1 Profitability Ratios............................................................................................................6
3.2 Efficiency Ratios..............................................................................................................8
3.3 Liquidity Ratios................................................................................................................9
3.4 Gearing Ratios................................................................................................................10
4.0 Recommendations & Assessment......................................................................................11
5.0 References..........................................................................................................................13
6.0 Appendices.........................................................................................................................14
3
⊘ This is a preview!⊘
Do you want full access?
Subscribe today to unlock all pages.
Trusted by 1+ million students worldwide
1.0 Company Background
Woolworths is the largest supermarket chain in Australia with a market share exceeding 35%.
In the supermarket segment, the company forms a virtual duopoly with Wesfarmers (Coles).
The company started in 1924 as a discount retailer and a single store. However, over the
years the company has grown both organically as well as inorganically. It has diversified into
a number of related business such as home improvement, departmental stores, petrol, liquor,
hotels and general merchandise. Even though the company has presence in 7 foreign
countries but more than 90% of the revenues and profits of the company are derived from
Australia and New Zealand. The company is listed on the Australian Stock Exchange (ASX)
and has 200,200 employees as of March 31, 2017. The company has presence in over 3700
locations across Australia and despite diversification of business; more than 55% of the
revenues of the company are derived from supermarket and grocery segment oolworths(W ,
2017).
2.0 Company Analysis
2.1 Financial Statements & Financial Performance
The various components of the financial statements of the company from the latest annual
report are analysed as indicated below.
Income Statement
It is apparent that in comparison to FY2016, the sales revenue of the company has witnessed
a growth of about 5% in FY2017. This is primarily driven by robust growth observed in food
segment both in Australia and New Zealand along with beverages. This growth has been
particularly robust in the fourth quarter of FY2017. The incremental revenue has led to
higher gross profits for the company which also seem to be aided by incremental margins on
account of better stock management and superior product mix. In comparison to FY2016, a
significant jump has been observed in EBIT in FY2017 which has increased by almost 56%.
This may be attributed to higher gross profit and lower administrative expenses. The lower
administrative expenses may be attributed to the discontinued petrol business and home
improvement business in FY2016. The financing costs of the company have reduced by $ 52
million in FY2017 over the previous year which is mainly driven by lower debt on the books
of the company. The net impact of the above is that the net profit from continuing operations
4
Paraphrase This Document
Need a fresh take? Get an instant paraphrase of this document with our AI Paraphraser
has almost doubled. Also, in comparison to the $ 3.1 billion loss in FY2016, there has been a
$ 111.4 million profit in FY2017 which aids the EPS of the company oolworths(W , 2017).
Balance Sheet
There is a decrease in then current assets as on June 30, 2017 by about $433 million in
comparison to the current assets as on June 30, 2016. This is primarily on account of
reduction of inventories which reflect better inventory management on part of the company.
The non-current assets have also shown slight decline owing to which as on June 30, 2017,
the total assets of the company are $ 587 million lesser in comparison to the corresponding
figure as on June 30, 2018. Despite jump in trade and other payables by about $ 400 million,
the current liabilities as on June 30, 2017 has remaining almost constant when compared to
the previous year. A significant decline to the tune of $ 1.5 billion is observed in the non-
current liabilities on a y-o-y basis. This is primarily driven by reduction in long term
borrowings by about $ 1.1 billion. This is in line with the company’s strategy to focus on the
core businesses while divesting non-core businesses to deleverage the balance sheet and
lower the financial risk. The shareholder’s equity as on June 30, 2017 has increased by about
$ 1 billion backed by increased retained earnings and higher share capital primarily on
account of Dividend Reinvestment Plan oolworths(W , 2017).
Cash Flow Statement
There is an increase of about $ 775 million in the cash flow generated from operations which
in driven by falling payments to suppliers and reduced income tax paid. The net cash outflow
on investing activities has also increased for FY2017 compared to FY2016 by $167 million
which highlights that the company is continuously opening new stores and investing in fixed
assets which augers well for future growth of the company. For both FY2016 and FY2017,
there has been a net outflow in excess of $ 1.4 billion which augers well for the company as
the overall leverage is on the decline which lowers the finance cost and also ensures that
future debt requirements can be met at lower costs. The borrowings repayment for FY2017
exceeds $ 1.4 billion while for FY2016, it stands in excess of $ 0.9 billion oolworths(W , 2017).
2.2 Economic Outlook
The current outlook for the company seems to have improved from Q4 FY2017 when robust
growth was observed in terms of sales. However, going forward the main issue for the
company is the shrinking margins as the focus is on reducing price owing to the hyper-
5
competitive nature of the industry. The company is facing fierce competition from three
sides. On one side are the traditional competitors such as Coles while on the other, there are
the discount retailers like Costco, Aldi etc. that are gaining market share. The company also
faces competition from new digital entrants (Njobeni, 2017). The Australian economy going
forward is expected to grow at a higher pace owing to the improvement in global growth and
the increasing price of commodities. This is positive not only for the company but also the
sector as a whole as the retail spending is driven by the underlying consumer confidence
which is expected to remain robust thus driving higher consumer spending oolworths(W ,
2017).
3.0 Ratio Analysis
The various ratios of the company for the year FY2016 and FY2017 are discussed as follows.
3.1 Profitability Ratios
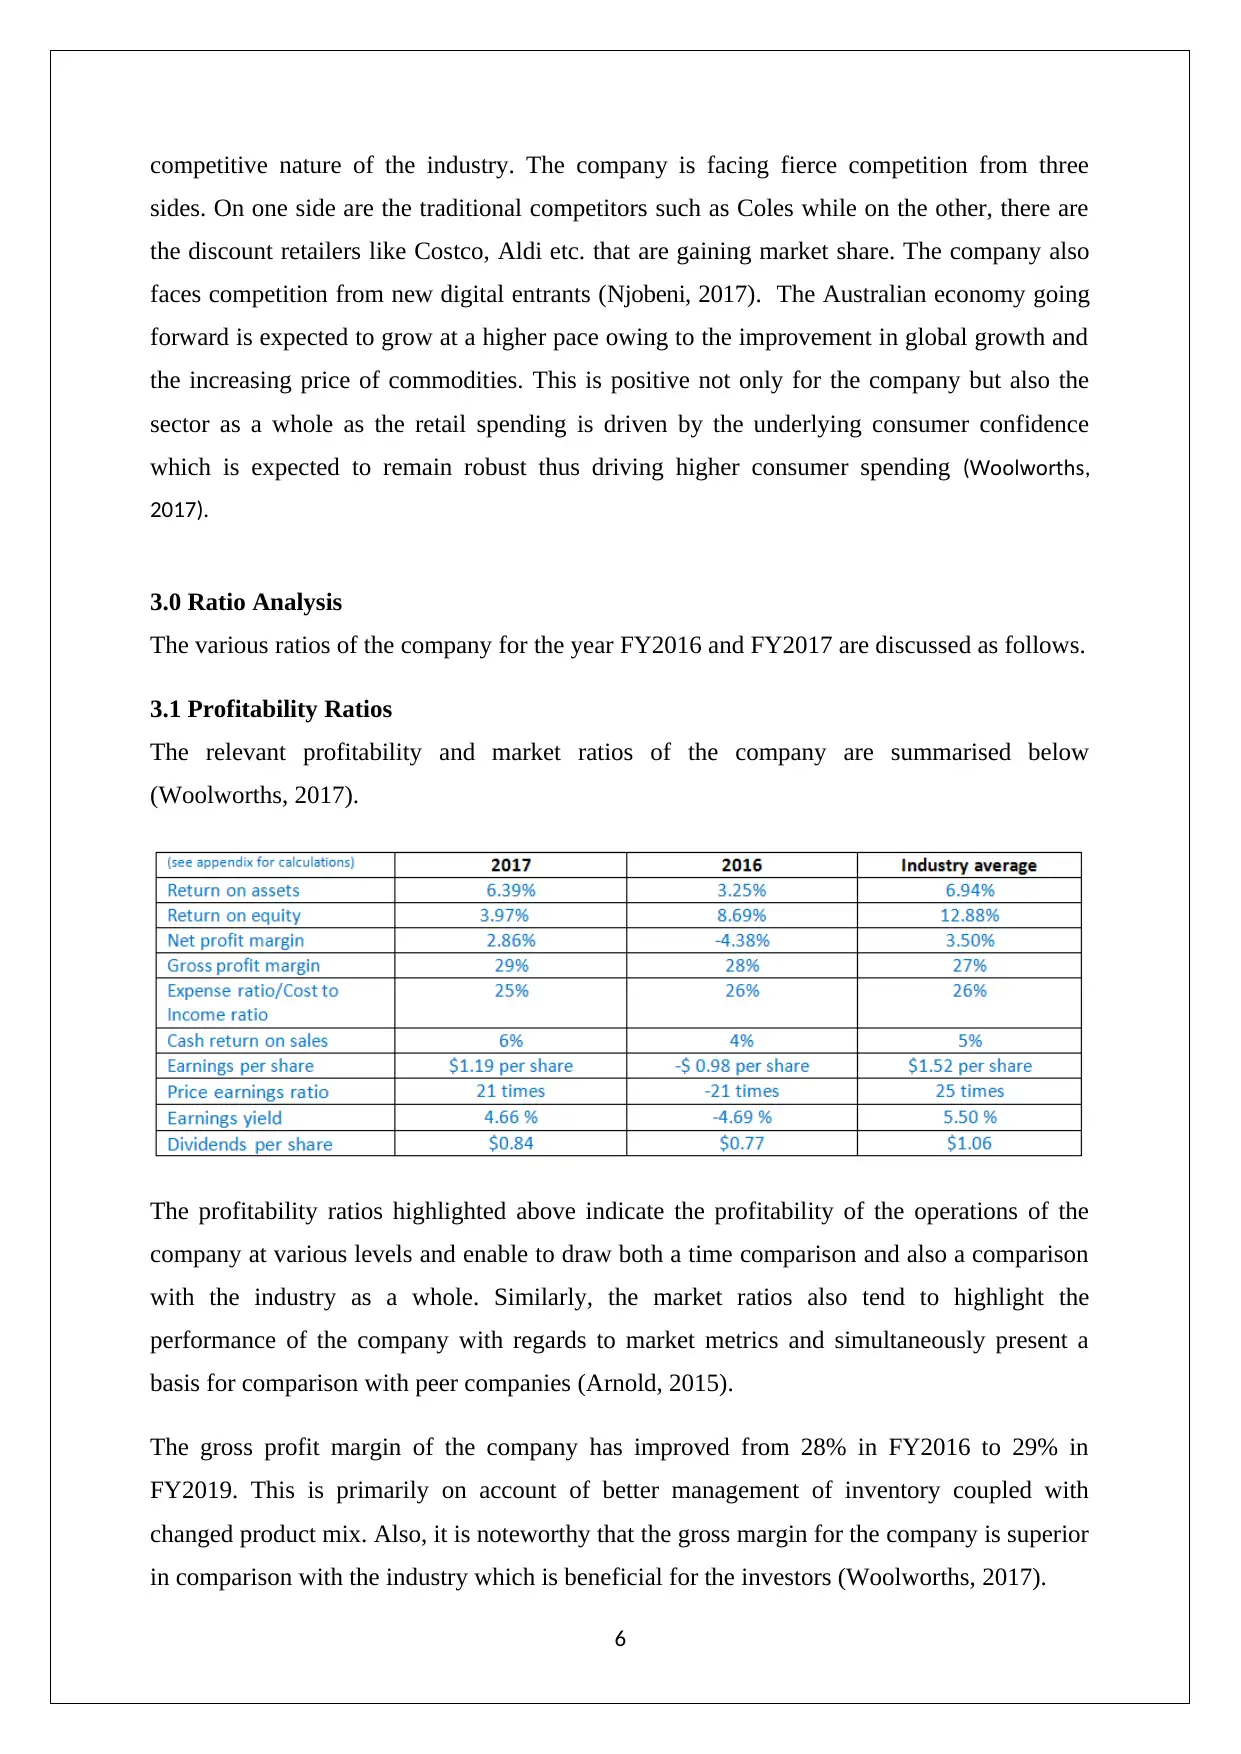
The relevant profitability and market ratios of the company are summarised below
(Woolworths, 2017).
The profitability ratios highlighted above indicate the profitability of the operations of the
company at various levels and enable to draw both a time comparison and also a comparison
with the industry as a whole. Similarly, the market ratios also tend to highlight the
performance of the company with regards to market metrics and simultaneously present a
basis for comparison with peer companies (Arnold, 2015).
The gross profit margin of the company has improved from 28% in FY2016 to 29% in
FY2019. This is primarily on account of better management of inventory coupled with
changed product mix. Also, it is noteworthy that the gross margin for the company is superior
in comparison with the industry which is beneficial for the investors (Woolworths, 2017).
6
sides. On one side are the traditional competitors such as Coles while on the other, there are
the discount retailers like Costco, Aldi etc. that are gaining market share. The company also
faces competition from new digital entrants (Njobeni, 2017). The Australian economy going
forward is expected to grow at a higher pace owing to the improvement in global growth and
the increasing price of commodities. This is positive not only for the company but also the
sector as a whole as the retail spending is driven by the underlying consumer confidence
which is expected to remain robust thus driving higher consumer spending oolworths(W ,
2017).
3.0 Ratio Analysis
The various ratios of the company for the year FY2016 and FY2017 are discussed as follows.
3.1 Profitability Ratios
The relevant profitability and market ratios of the company are summarised below
(Woolworths, 2017).
The profitability ratios highlighted above indicate the profitability of the operations of the
company at various levels and enable to draw both a time comparison and also a comparison
with the industry as a whole. Similarly, the market ratios also tend to highlight the
performance of the company with regards to market metrics and simultaneously present a
basis for comparison with peer companies (Arnold, 2015).
The gross profit margin of the company has improved from 28% in FY2016 to 29% in
FY2019. This is primarily on account of better management of inventory coupled with
changed product mix. Also, it is noteworthy that the gross margin for the company is superior
in comparison with the industry which is beneficial for the investors (Woolworths, 2017).
6
⊘ This is a preview!⊘
Do you want full access?
Subscribe today to unlock all pages.
Trusted by 1+ million students worldwide
The net profit margin for the company has deteriorated in FY2017 if compared for the
continuing operations only. This is because of the increase in cost of doing business
especially for the food segment which accounts for about 60% of the total revenues of the
company. The EBIT to sales for the food business fell by 31 bps in FY2017 as compared to
FY2016. The loss reported in FY2016 is primarily attributed to the tune of $ 3.1 billion on
account of discontinued operations as the company decided to close the Masters stores
(December 2016), sale of HTH to Metcash (October 2016) and sale of Petrol business on
December, 2016. The net profit margin of the company for FY2017 remains lower than the
industry which is not surprising considering the loss of market share and pressure on margins
in the food segment which the company has experienced recently (Woolworths, 2017).
Owing to one-time expenses, the ROA and ROE are lesser for FY2016. However, the ROA
for FY2017 is 6.88% which is slightly lower than the industry average of 6.94% highlighting
the need to improve on usage of assets for generation of profits. The ROE of the company for
FY2017 is 4.27% which is s lower than the industry average of 5.73% witnessed in FY2017
for the industry as a whole. Clearly, on the return ratios, the company’s performance is quite
dismal when compared to the industry (Woolworths, 2017).
The inferior pre-tax profit margins for the company in comparison to the industry is also
reflected in the expense ratio considering that company has higher expense ratio which lower
the profitability of the operations and thereby needs improvement going forward. However,
on cash returns on sale, the company has shown improvement in the present year i.e FY2017
compared to the previous year (Woolworths, 2017).
The EPS of the company in FY2017 has shown significant improvement over the previous
year owing to the 100% rise in the profit generated from continuing operating and also
marginal profit on discontinued operations in FY2017. This EPS reported by the company in
FY2017 is worse than the industry average. The P/E ratio for the company as on June 30,
2017 stood at 21X which is inferior to the industry average and on expected lines
considering the stiff competition that the company is facing especially from discount retailers
like Costco and Aldi which is being captured in the falling market share (IBIS, 2018). The
earnings yield and dividend have share have shown improvement in FY2017 over FY2016
but despite the improvement, these continue to the lower than the relevant industry average
for FY2017.
7
Paraphrase This Document
Need a fresh take? Get an instant paraphrase of this document with our AI Paraphraser
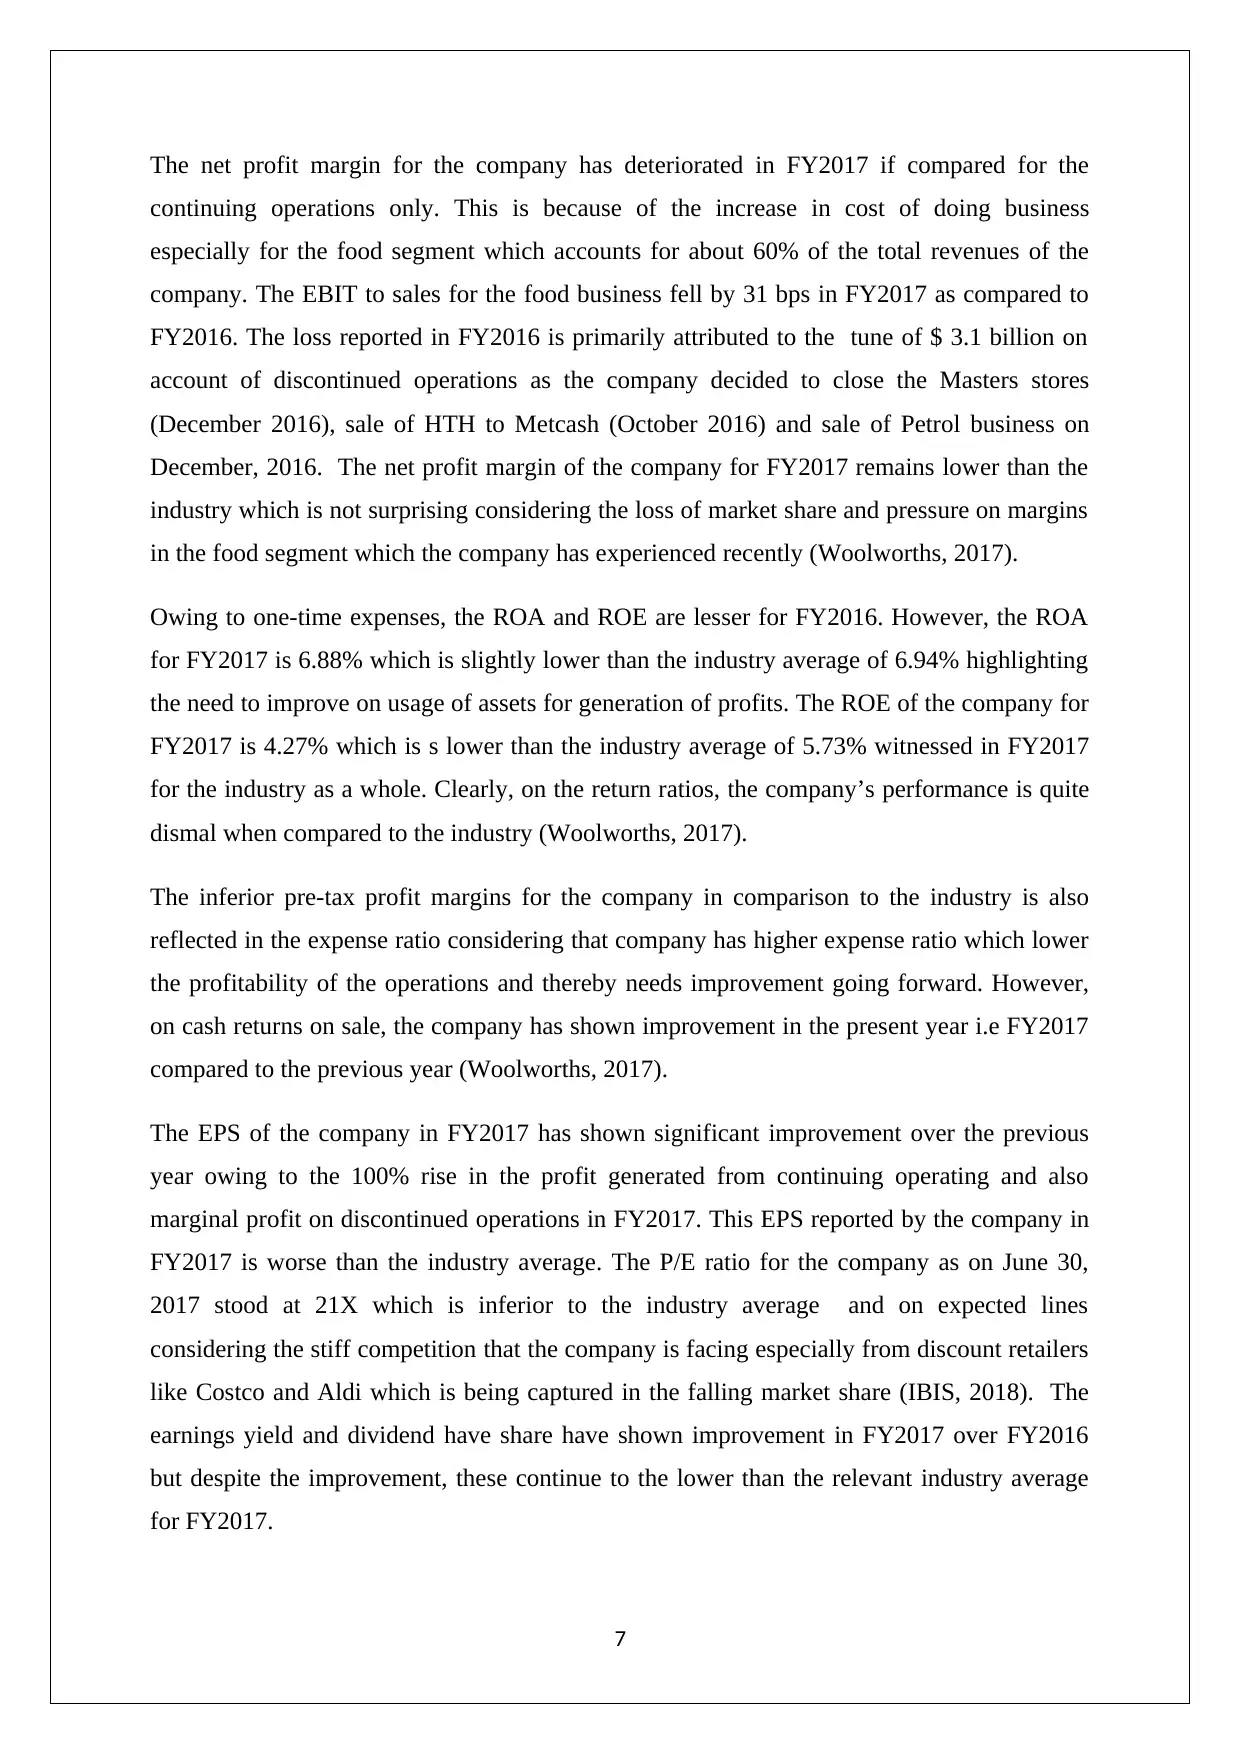
3.2 Efficiency Ratios
The relevant efficiency ratios of the company are summarised below (Woolworths, 2017).
The efficiency ratios play a critical role in determining the underlying efficiency with which
the company is using the assets to generate revenue. This is significant from the perspective
of the shareholders since capital is available in limited amount and hence assets would be
limited. Hence, for enhancing the earnings one potential means is to deploy the assets more
efficiently so that higher revenue generation can take place (Gitman, Juchaou, & Flanagan,
2017).
The asset turnover ratio highlights the efficiency of the company with regards to generation
of sales from the available assets. For Woolworths, there is an improvement in the asset
turnover in FY2017 as compared to FY2016 since the operating revenues generates from
assets are 2.4 times the same. This is clearly higher than the industry average of 1.97 for
FY2017 which highlights that the company is performing well in this aspect (Woolworths,
2017).
The cash returns on assets highlight the operating cash flow per unit total assets that are
generated from the available assets of the company. A higher ratio would be preferable for a
company since it would indicate higher operational cash flows being generated from the
given assets. The cash returns on assets for the company has deteriorated in FY2017 in
comparison to the corresponding value in FY2016. Further, the FY2017 ratio value is lesser
than the industry margin which may be on account of subdued performance by the company
on the margins front in comparison to the industry (Woolworths, 2017).
The fixed asset turnover unlike asset turnover tends to consider only the fixed assets i.e. non-
current assets. This captures the efficiency with which the sales are being generated from the
fixed assets. This metric is quite significant for the retail industry since the same store sales
growth is preferable over expansion based growth. The fixed asset turnover has improved in
8
FY2017 but is marginally lower than the industry average which highlights immense scope of
improvement in this regards (Woolworths, 2017).
3.3 Liquidity Ratios
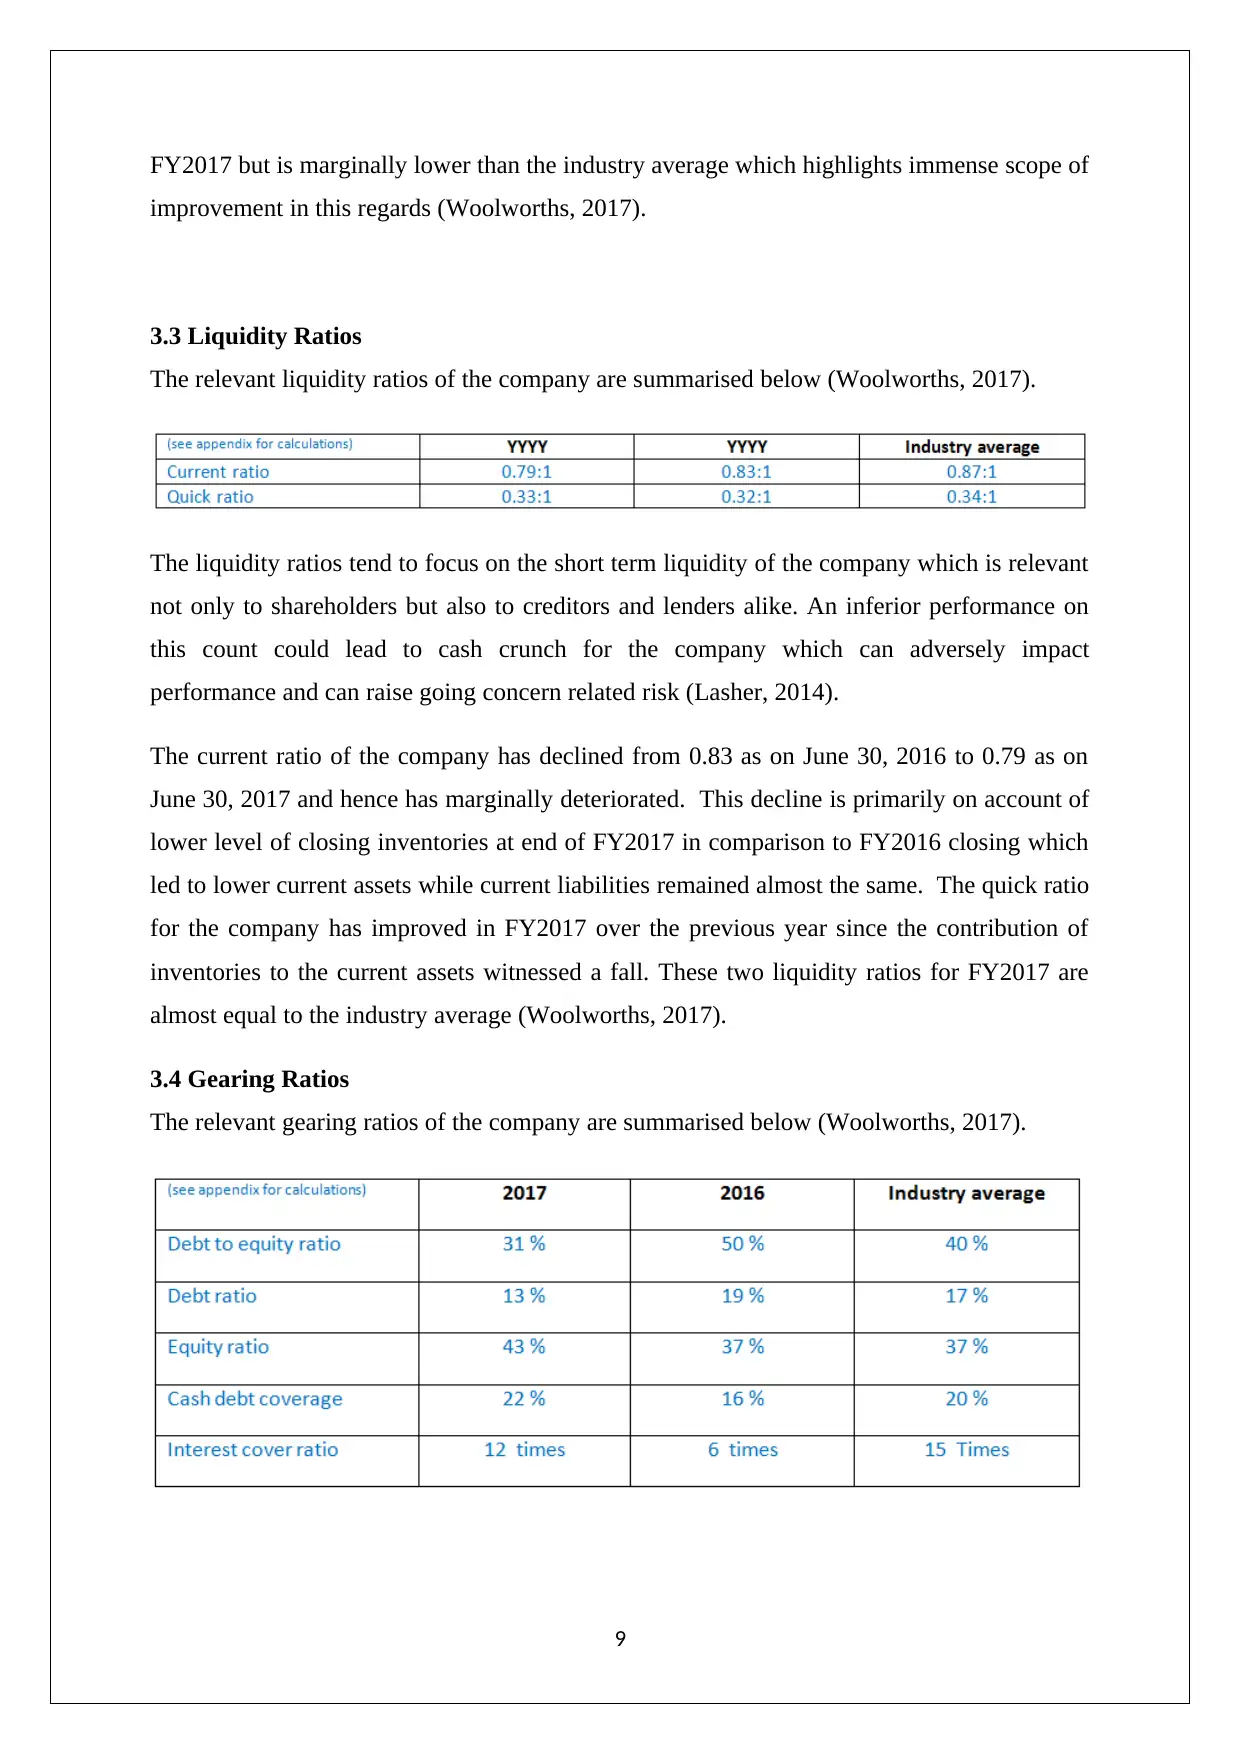
The relevant liquidity ratios of the company are summarised below (Woolworths, 2017).
The liquidity ratios tend to focus on the short term liquidity of the company which is relevant
not only to shareholders but also to creditors and lenders alike. An inferior performance on
this count could lead to cash crunch for the company which can adversely impact
performance and can raise going concern related risk (Lasher, 2014).
The current ratio of the company has declined from 0.83 as on June 30, 2016 to 0.79 as on
June 30, 2017 and hence has marginally deteriorated. This decline is primarily on account of
lower level of closing inventories at end of FY2017 in comparison to FY2016 closing which
led to lower current assets while current liabilities remained almost the same. The quick ratio
for the company has improved in FY2017 over the previous year since the contribution of
inventories to the current assets witnessed a fall. These two liquidity ratios for FY2017 are
almost equal to the industry average (Woolworths, 2017).
3.4 Gearing Ratios
The relevant gearing ratios of the company are summarised below (Woolworths, 2017).
9
improvement in this regards (Woolworths, 2017).
3.3 Liquidity Ratios
The relevant liquidity ratios of the company are summarised below (Woolworths, 2017).
The liquidity ratios tend to focus on the short term liquidity of the company which is relevant
not only to shareholders but also to creditors and lenders alike. An inferior performance on
this count could lead to cash crunch for the company which can adversely impact
performance and can raise going concern related risk (Lasher, 2014).
The current ratio of the company has declined from 0.83 as on June 30, 2016 to 0.79 as on
June 30, 2017 and hence has marginally deteriorated. This decline is primarily on account of
lower level of closing inventories at end of FY2017 in comparison to FY2016 closing which
led to lower current assets while current liabilities remained almost the same. The quick ratio
for the company has improved in FY2017 over the previous year since the contribution of
inventories to the current assets witnessed a fall. These two liquidity ratios for FY2017 are
almost equal to the industry average (Woolworths, 2017).
3.4 Gearing Ratios
The relevant gearing ratios of the company are summarised below (Woolworths, 2017).
9
⊘ This is a preview!⊘
Do you want full access?
Subscribe today to unlock all pages.
Trusted by 1+ million students worldwide
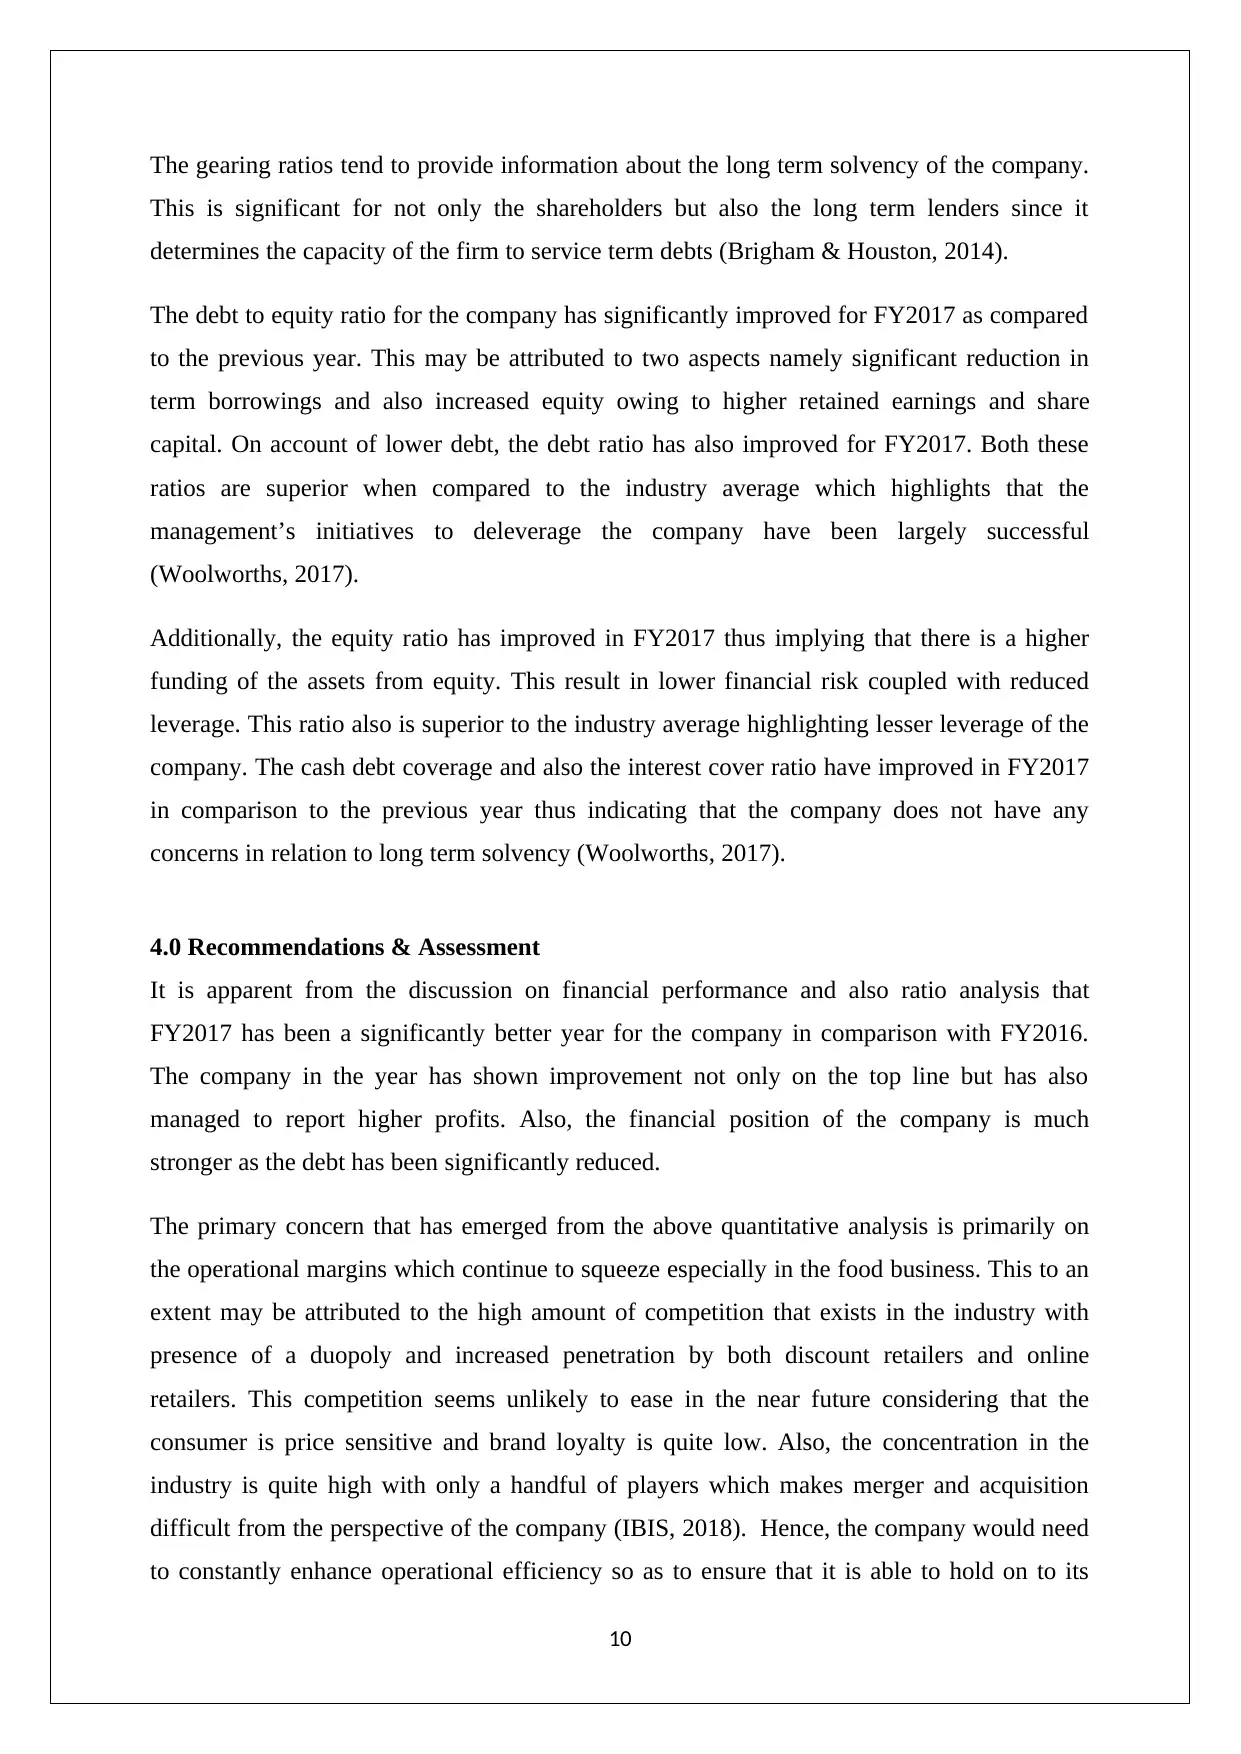
The gearing ratios tend to provide information about the long term solvency of the company.
This is significant for not only the shareholders but also the long term lenders since it
determines the capacity of the firm to service term debts (Brigham & Houston, 2014).
The debt to equity ratio for the company has significantly improved for FY2017 as compared
to the previous year. This may be attributed to two aspects namely significant reduction in
term borrowings and also increased equity owing to higher retained earnings and share
capital. On account of lower debt, the debt ratio has also improved for FY2017. Both these
ratios are superior when compared to the industry average which highlights that the
management’s initiatives to deleverage the company have been largely successful
(Woolworths, 2017).
Additionally, the equity ratio has improved in FY2017 thus implying that there is a higher
funding of the assets from equity. This result in lower financial risk coupled with reduced
leverage. This ratio also is superior to the industry average highlighting lesser leverage of the
company. The cash debt coverage and also the interest cover ratio have improved in FY2017
in comparison to the previous year thus indicating that the company does not have any
concerns in relation to long term solvency (Woolworths, 2017).
4.0 Recommendations & Assessment
It is apparent from the discussion on financial performance and also ratio analysis that
FY2017 has been a significantly better year for the company in comparison with FY2016.
The company in the year has shown improvement not only on the top line but has also
managed to report higher profits. Also, the financial position of the company is much
stronger as the debt has been significantly reduced.
The primary concern that has emerged from the above quantitative analysis is primarily on
the operational margins which continue to squeeze especially in the food business. This to an
extent may be attributed to the high amount of competition that exists in the industry with
presence of a duopoly and increased penetration by both discount retailers and online
retailers. This competition seems unlikely to ease in the near future considering that the
consumer is price sensitive and brand loyalty is quite low. Also, the concentration in the
industry is quite high with only a handful of players which makes merger and acquisition
difficult from the perspective of the company (IBIS, 2018). Hence, the company would need
to constantly enhance operational efficiency so as to ensure that it is able to hold on to its
10
Paraphrase This Document
Need a fresh take? Get an instant paraphrase of this document with our AI Paraphraser
market share in wake of rising competition. Considering that margins are a big concern
hence, it makes sense for the company to expand presence in other segments such as
beverages, hotels where the margins are better in comparison to food. Also, the company
needs to update the product mix so that the share of private labels enhances which can
perhaps enable the company to fight off margin concerns going forward (Bruner, 2013).
The insolvency of the organisation has host of ethical implications. Firstly, there are unpaid
creditors and employees who might have had long relationship with the company despite
which would end up in losses. Clearly, this is unethical from the perspective of fairness and
justice. Additionally, solvency tends to adversely impact the lenders that had given capital to
the firm. If every company starts becoming insolvent, banks and financial institutions would
be reluctant to lend thus leading to higher interest rates which can be disastrous for corporate
(Lasher, 2014). Also, there would be loss to shareholders who fulfil critical capital needs of
businesses by investing into equity and assuming risk. Additionally, there might be some role
of external auditors also particularly if the most recent audit report did not cite any going
concern issues. This might raise ethical issues with regards to auditing profession and their
conduct (Hawawini &Viallet, 2016).
The political environment does have an influence on the company since unrestricted entry to
the industry may lead other foreign players to enter the market and thereby further intensify
competition. On the other hand, any restrictions in this regards would ensure that new players
do not enter. There are a host of external factors which tend to impact company’s business.
One of these is economic environment which tends to impact the consumer spending and
hence sales. Additionally, the social and cultural factors are also impacted the consumer
preferences and mode of shopping with more emphasis on online shopping. Technology is
also acting as a disruptor for the industry as advancements in technology are enabling better
consumer experience through online shopping which is altering the value chain and cost
structure of industry. Additionally, there are legal factors related to compliance with laws
related to consumer protection, employment, health, safety, privacy and anti-trust which the
company needs to be adhere with (IBIS, 2018).
I would not invest in the company primarily because of the industry the company is in and
the cut throat level of competition that the company is witnessing. It is unlikely that the
company would be able to deliver any significant growth in earnings on a sustainable basis
11
because of the constant pressure on the margins. As a result, I would prefer to stay away from
this sector or invest in a competitor having lower share from the grocery business.
5.0 References
Arnold,G. (2015). Corporate Financial Management (3rded.). Sydney: Financial Times
Management.
12
this sector or invest in a competitor having lower share from the grocery business.
5.0 References
Arnold,G. (2015). Corporate Financial Management (3rded.). Sydney: Financial Times
Management.
12
⊘ This is a preview!⊘
Do you want full access?
Subscribe today to unlock all pages.
Trusted by 1+ million students worldwide
1 out of 15
Related Documents


Your All-in-One AI-Powered Toolkit for Academic Success.
+13062052269
info@desklib.com
Available 24*7 on WhatsApp / Email
![[object Object]](/_next/static/media/star-bottom.7253800d.svg)
Unlock your academic potential
Copyright © 2020–2026 A2Z Services. All Rights Reserved. Developed and managed by ZUCOL.