BUS-7600 Financial Analysis Report: Woolworths vs Wesfarmers Ltd

Verified

Added on  2023/04/25

|19
|1867
|350
Report
AI Summary
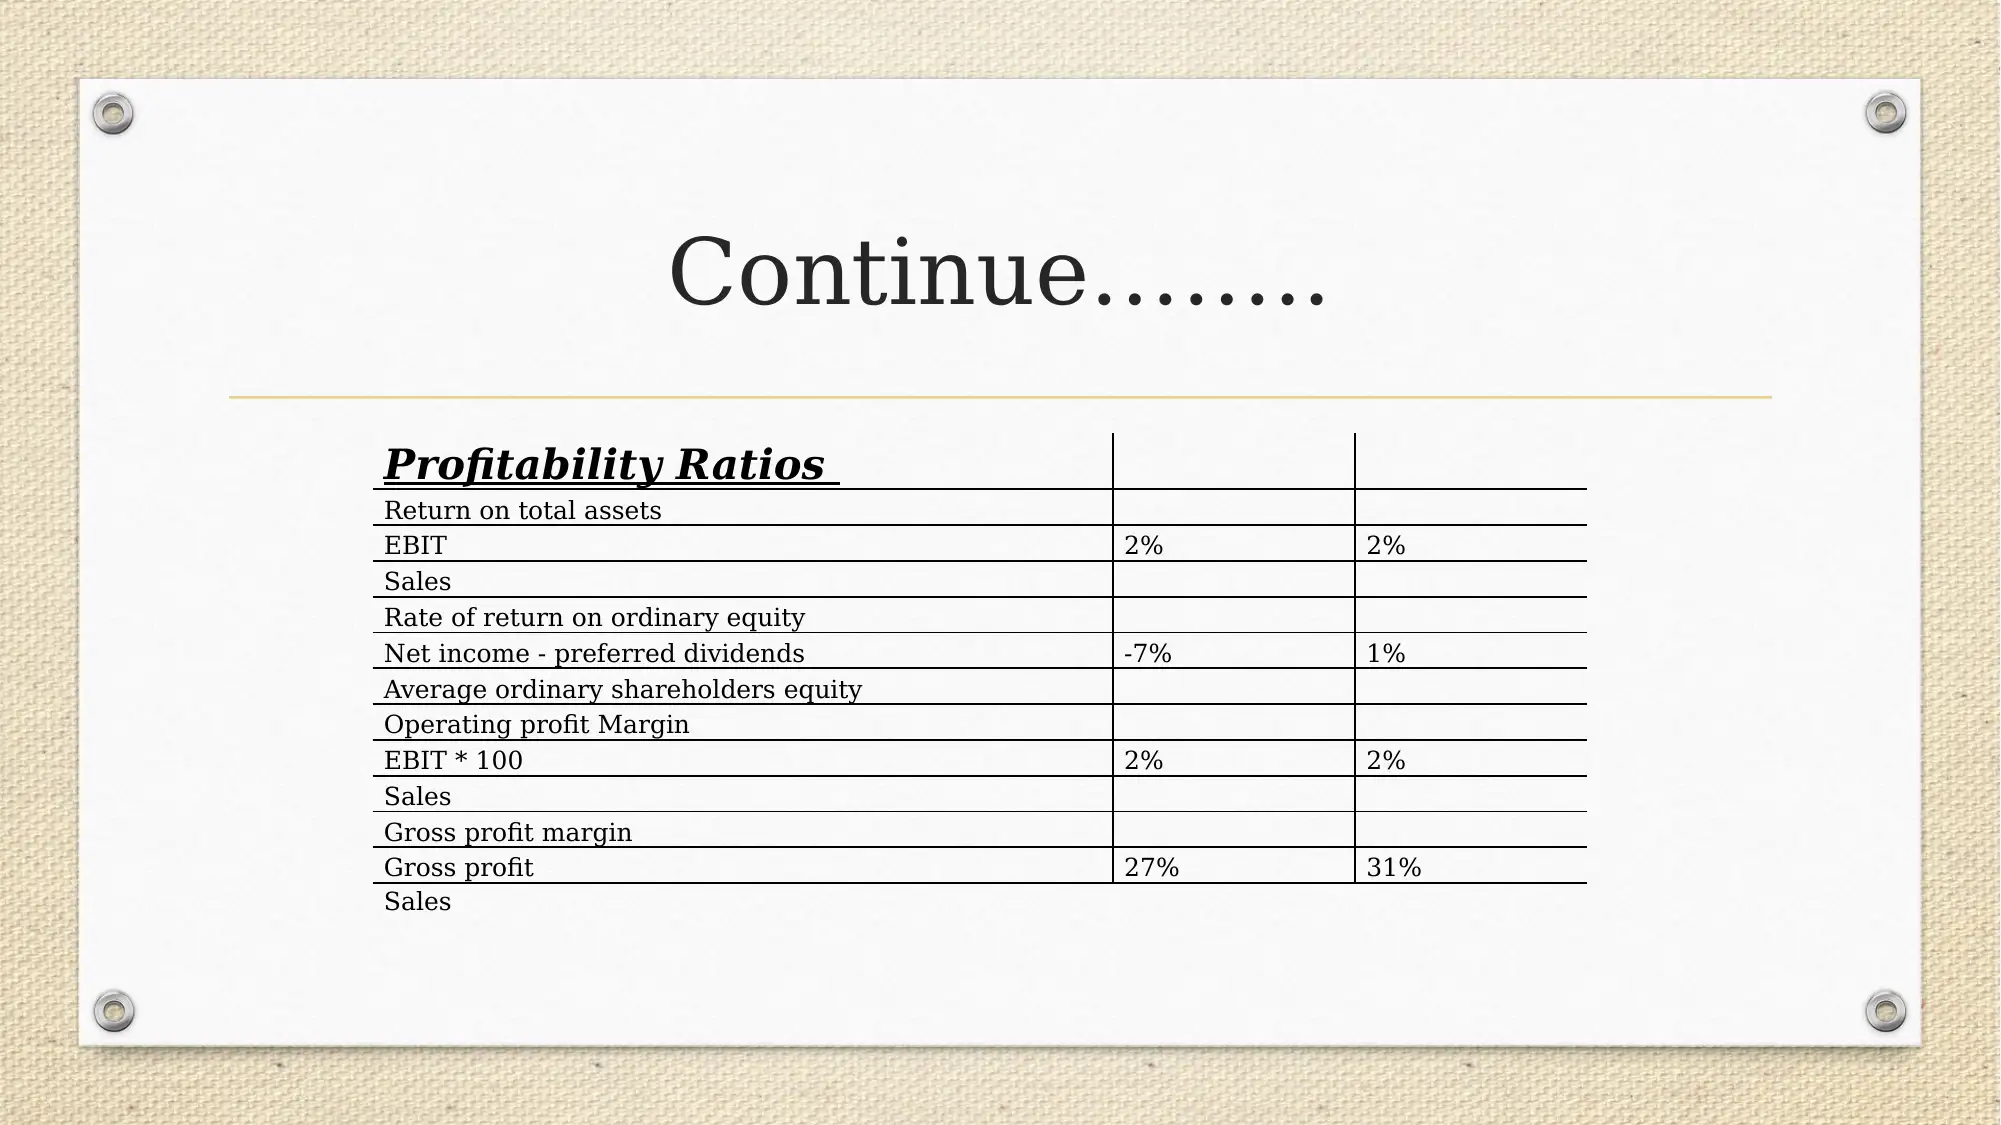
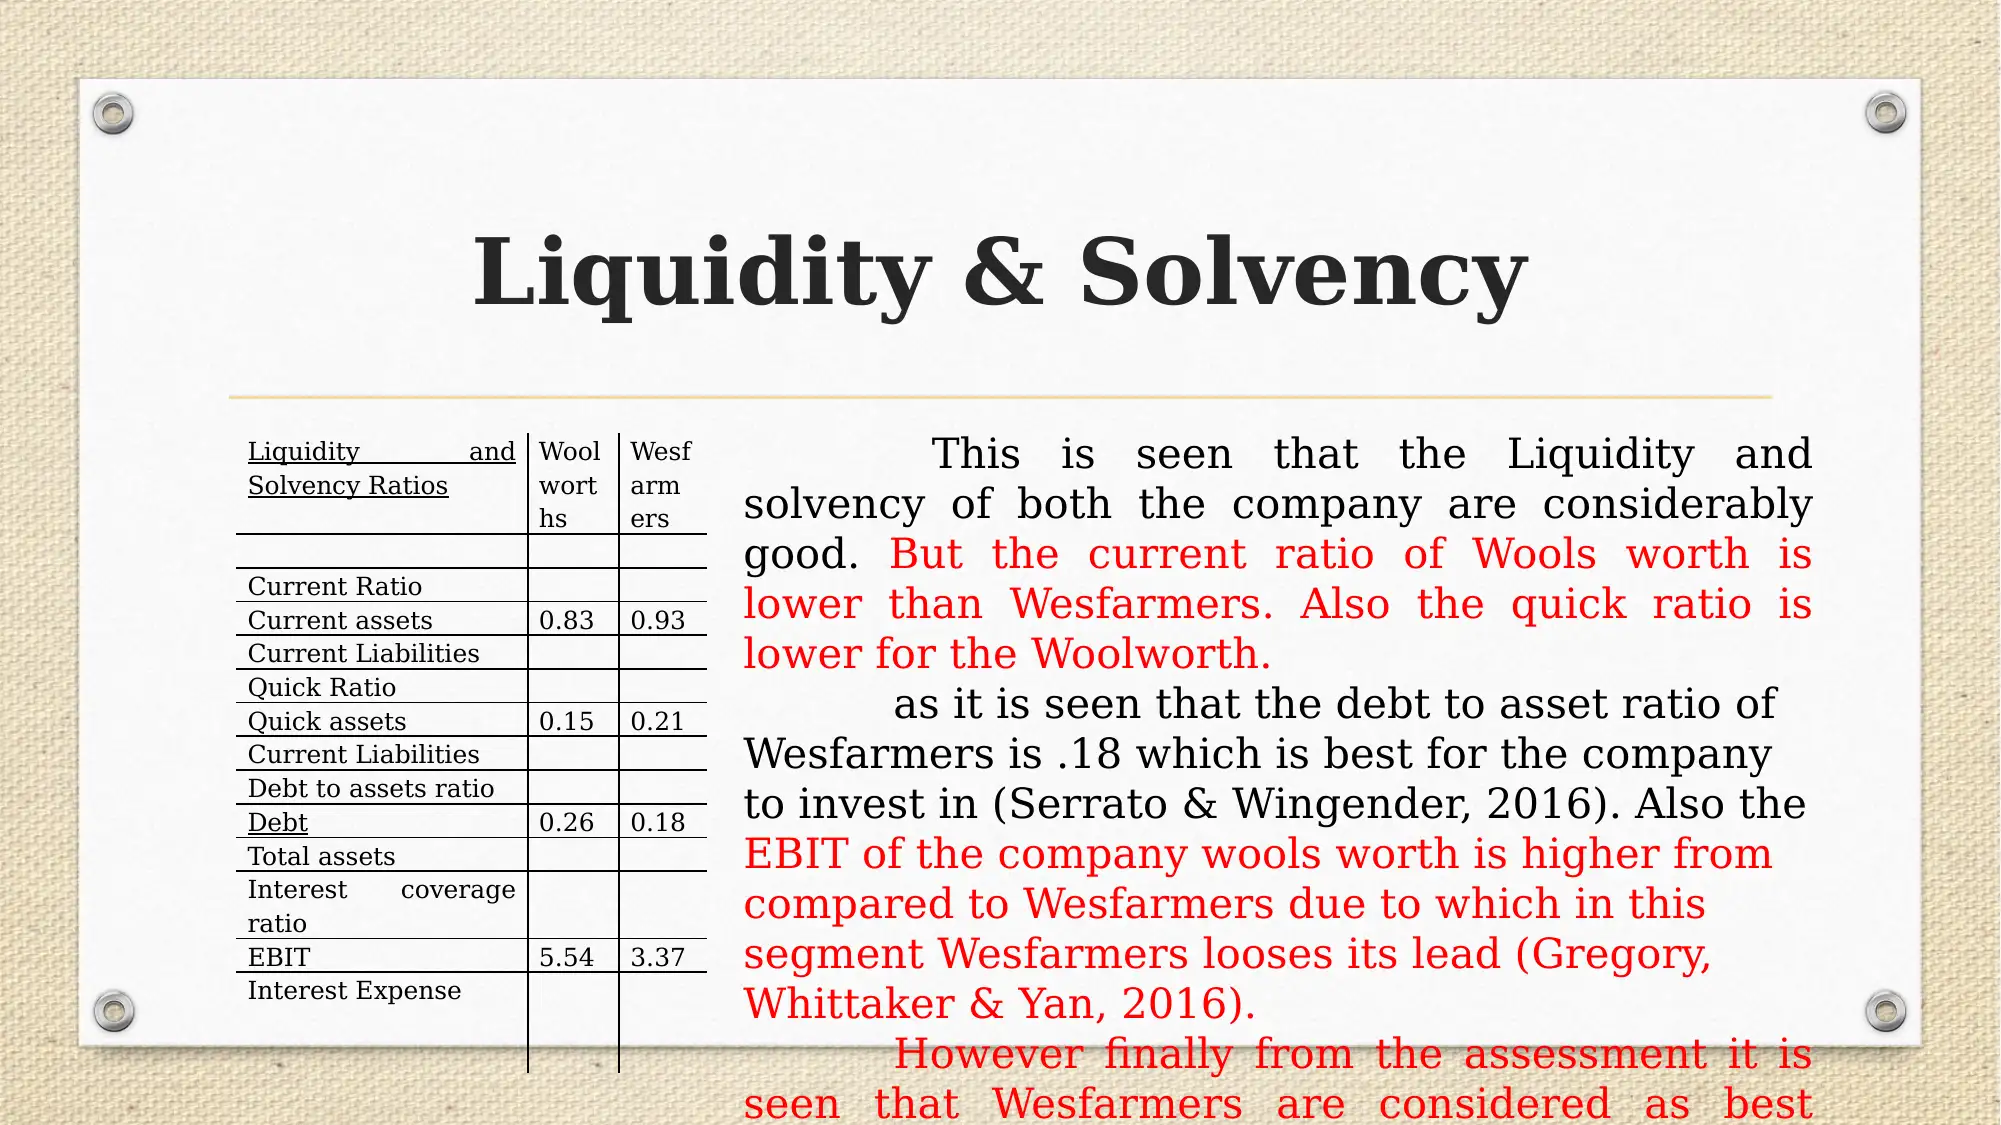
This report provides a detailed financial analysis of Woolworths and Wesfarmers, two major Australian companies. It uses ratio analysis to assess profitability, liquidity, and solvency, comparing the financial performance of both companies. The analysis includes gross profit, net profit, return on assets, and return on equity. The report also utilizes the Capital Asset Pricing Model (CAPM) and earnings multiplier to evaluate investment opportunities, concluding that Wesfarmers generally outperforms Woolworths and is a more favorable investment choice based on the data presented. Desklib offers a variety of solved assignments and past papers for students.
Document Page
MANAGERIAL-FINANCE-
BUS-7600-SP-2019
University Name: Ottawa University, Overland
Park, KS Spring 2019, March 3, 2019
Submitted By: Pratik Patel
tabler-icon-diamond-filled.svg

Paraphrase This Document

Need a fresh take? Get an instant paraphrase of this document with our AI Paraphraser
Document Page
Table of Contents
Overview and the primary line of business
Profitability
Liquidity & solvency-Findings
CAPM-Findings
Earning Multiplier-Findings
Conclusion
Referencing
Document Page
Overview and the primary lines
of business
Woolworths is the biggest Australian based company which came into
existence on 1924 in the month of September having its headquarters at Bella
Vista, New South Wales Australia. The commonly known as Woollies is an
Australian supermarket chain owned by Woolworths Limited Group. The
friendship with the Coles determines the duopoly of Australian supermarkets and
grabs almost 80% of the share. Woolworths mostly specialises in selling the
groceries however they also sell magazines, health and beauty care products. The
current revenue of the company is A$56.726 billion and the company is
progressing with a team of 115000 members (Woolworths, 2018). In competition
to the Woolworths is the Wesfarmers, an Australian Conglomerate dealing in
chemicals fertilisers, coal mining and the industrial as well as the safety products.
Document Page
Profitability
The profitability ratios are the class of the metrics used by the
management to measure the financial performance of the business.
These ratios are the critically successful in determining the data and
the ability of the company whether the company is profitable or not
(Williams & Dobelman, 2017) . Generally the gross profit, net profit,
return on total assets and return on equity is calculated under this
category which are calculated below:
tabler-icon-diamond-filled.svg

Paraphrase This Document

Need a fresh take? Get an instant paraphrase of this document with our AI Paraphraser
Document Page
Gross profit-Findings
From the above analysis it was founded that the both the company
were performing best, however, Wesfarmers was considered as more
profitable as they were giving 4% more profit as compared from Woolworths.
The EBIT for both the company was same in percent but the return on
ordinary equity was negative for Woolworths and for Wesfarmers it was
around 1%. Hence it is advised that investment in Wesfarmers is considered
as good decision (Chan-Lau and et. Al., 2017). This tool is not only sued by the
management but also used by the investors and the shareholders to assess
the capacity of the firm on the basis of these criteria. Below is the ratio
analysis technique used for the two companies namely the Woolworths and
Wesfarmers (Uechi, et al 2015).
Document Page
Continue……..
Profitability Ratios
Return on total assets
EBIT 2% 2%
Sales
Rate of return on ordinary equity
Net income - preferred dividends -7% 1%
Average ordinary shareholders equity
Operating profit Margin
EBIT * 100 2% 2%
Sales
Gross profit margin
Gross profit 27% 31%
Sales
Document Page
Net profit- Findings
The expenses of the Woolworths are crossing their limit and this
is the peak time where the company must pay attention to the
unnecessary costs. The other operating expenses costs $12033100
which are almost 20% of the sales and thereafter the selling expenses
are also around 22% acting as a red flag for the company (Boyas &
Teeter, 2017). This is the reason why the investment in Wesfarmers are
considered as best decision for the investors.
tabler-icon-diamond-filled.svg

Paraphrase This Document

Need a fresh take? Get an instant paraphrase of this document with our AI Paraphraser
Document Page
Return on total assets-
Findings
It was founded through the analysis that return on total assets of
Woolworths as well as the Wesfarmers is considered a critical one at
2%. To improve the ratio the company must reduce the costs of assets,
reducing expenses. Though the Wesfarmers is the first choice yet the
company must secure the ratio (Grant, 2016).
Hence the investment in Wesfarmers is considered as best
decision for the investors.
Document Page
Return on Equity-Findings
From the report it was founded that return on equity of the
Woolworths and Wesfarmers are -7% and 1%. The negative position of
the Woolworths reflects a critical position because this increases as the
financial leverage (Khan & Ali, 2016). Hence Wesfarmers are considered
as the profitable as compared from the other companies.
So it is advised that investment in Wesfarmers is best for the
investors to get best result.
Document Page
Liquidity & Solvency
Liquidity and
Solvency Ratios
Wool
wort
hs
Wesf
arm
ers
Current Ratio
Current assets 0.83 0.93
Current Liabilities
Quick Ratio
Quick assets 0.15 0.21
Current Liabilities
Debt to assets ratio
Debt 0.26 0.18
Total assets
Interest coverage
ratio
EBIT 5.54 3.37
Interest Expense
This is seen that the Liquidity and
solvency of both the company are considerably
good. But the current ratio of Wools worth is
lower than Wesfarmers. Also the quick ratio is
lower for the Woolworth.
as it is seen that the debt to asset ratio of
Wesfarmers is .18 which is best for the company
to invest in (Serrato & Wingender, 2016). Also the
EBIT of the company wools worth is higher from
compared to Wesfarmers due to which in this
segment Wesfarmers looses its lead (Gregory,
Whittaker & Yan, 2016).
However finally from the assessment it is
seen that Wesfarmers are considered as best
tabler-icon-diamond-filled.svg

Paraphrase This Document

Need a fresh take? Get an instant paraphrase of this document with our AI Paraphraser
Document Page
Current Ratio-Findings
Current Ratio is the ratio that defines the relationship between
the current assets and the current liabilities. The ideal current ratio of
the company is 2:1 and when compared with each other the current
ratio of the Woolworths and the Wesfarmers is 0.83 and 0.93
respectively. The current ratio of both the organisations needs to be in
alignment with the ideal ratio (Boyas & Teeter, 2017).
Document Page
Quick Ratio-Findings
The Quick ratio also known as the acid test ratio is a metric used
to reflect how well the companies are able to generate the cash as fast
as possible so that the contractual obligations can be paid on time
(Khan & Ali, 2016). The Quick ratio of the Woolworths and Wesfarmers
are 0.15 and 0.21. Usually the quick ratio is 1:1 and as can be seen the
companies have not performed well and the major reasons are the poor
inventory ratio that needs immediate action (Wesfarmers, 2018).
chevron_up_icon
1 out of 19
circle_padding
hide_on_mobile
zoom_out_icon
[object Object]