Project Management: Work Breakdown Structure Analysis and Estimation

Verified

Added on  2020/10/05

|6
|686
|361
Project
AI Summary
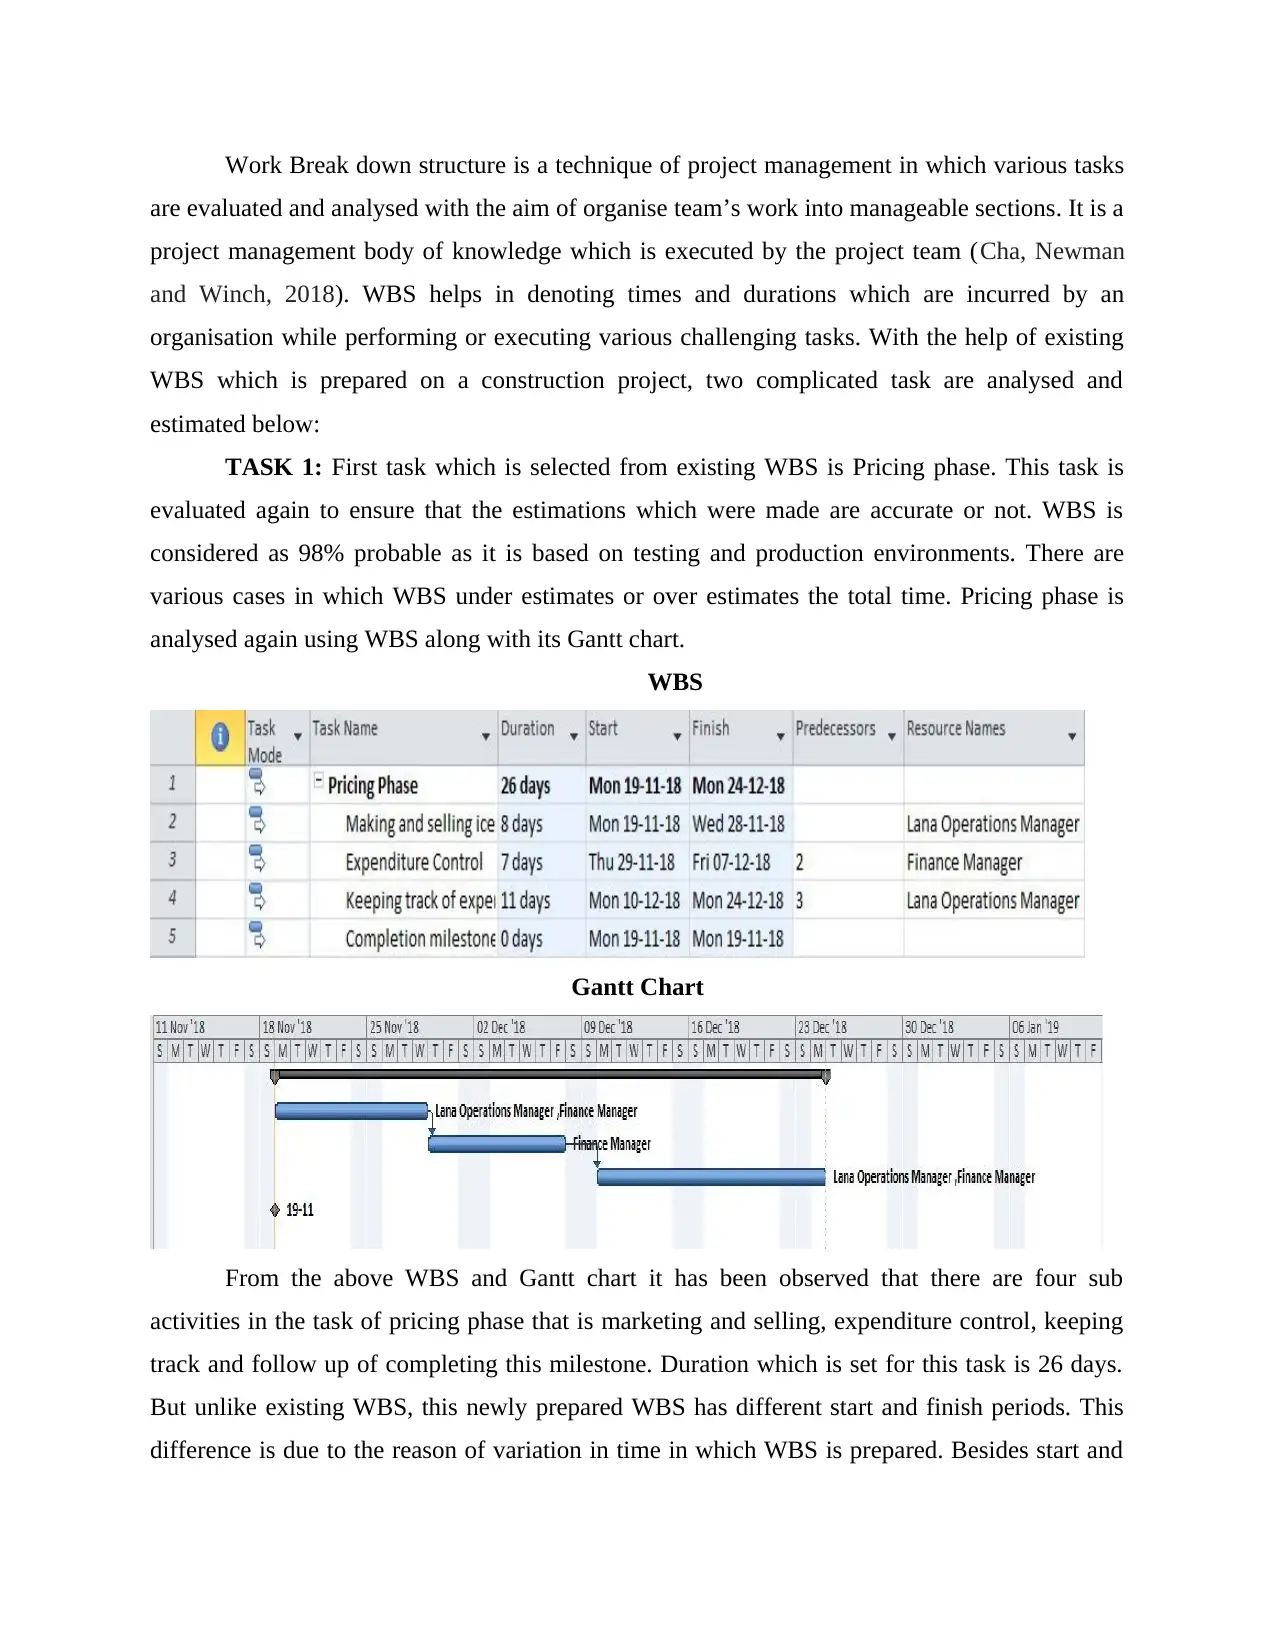
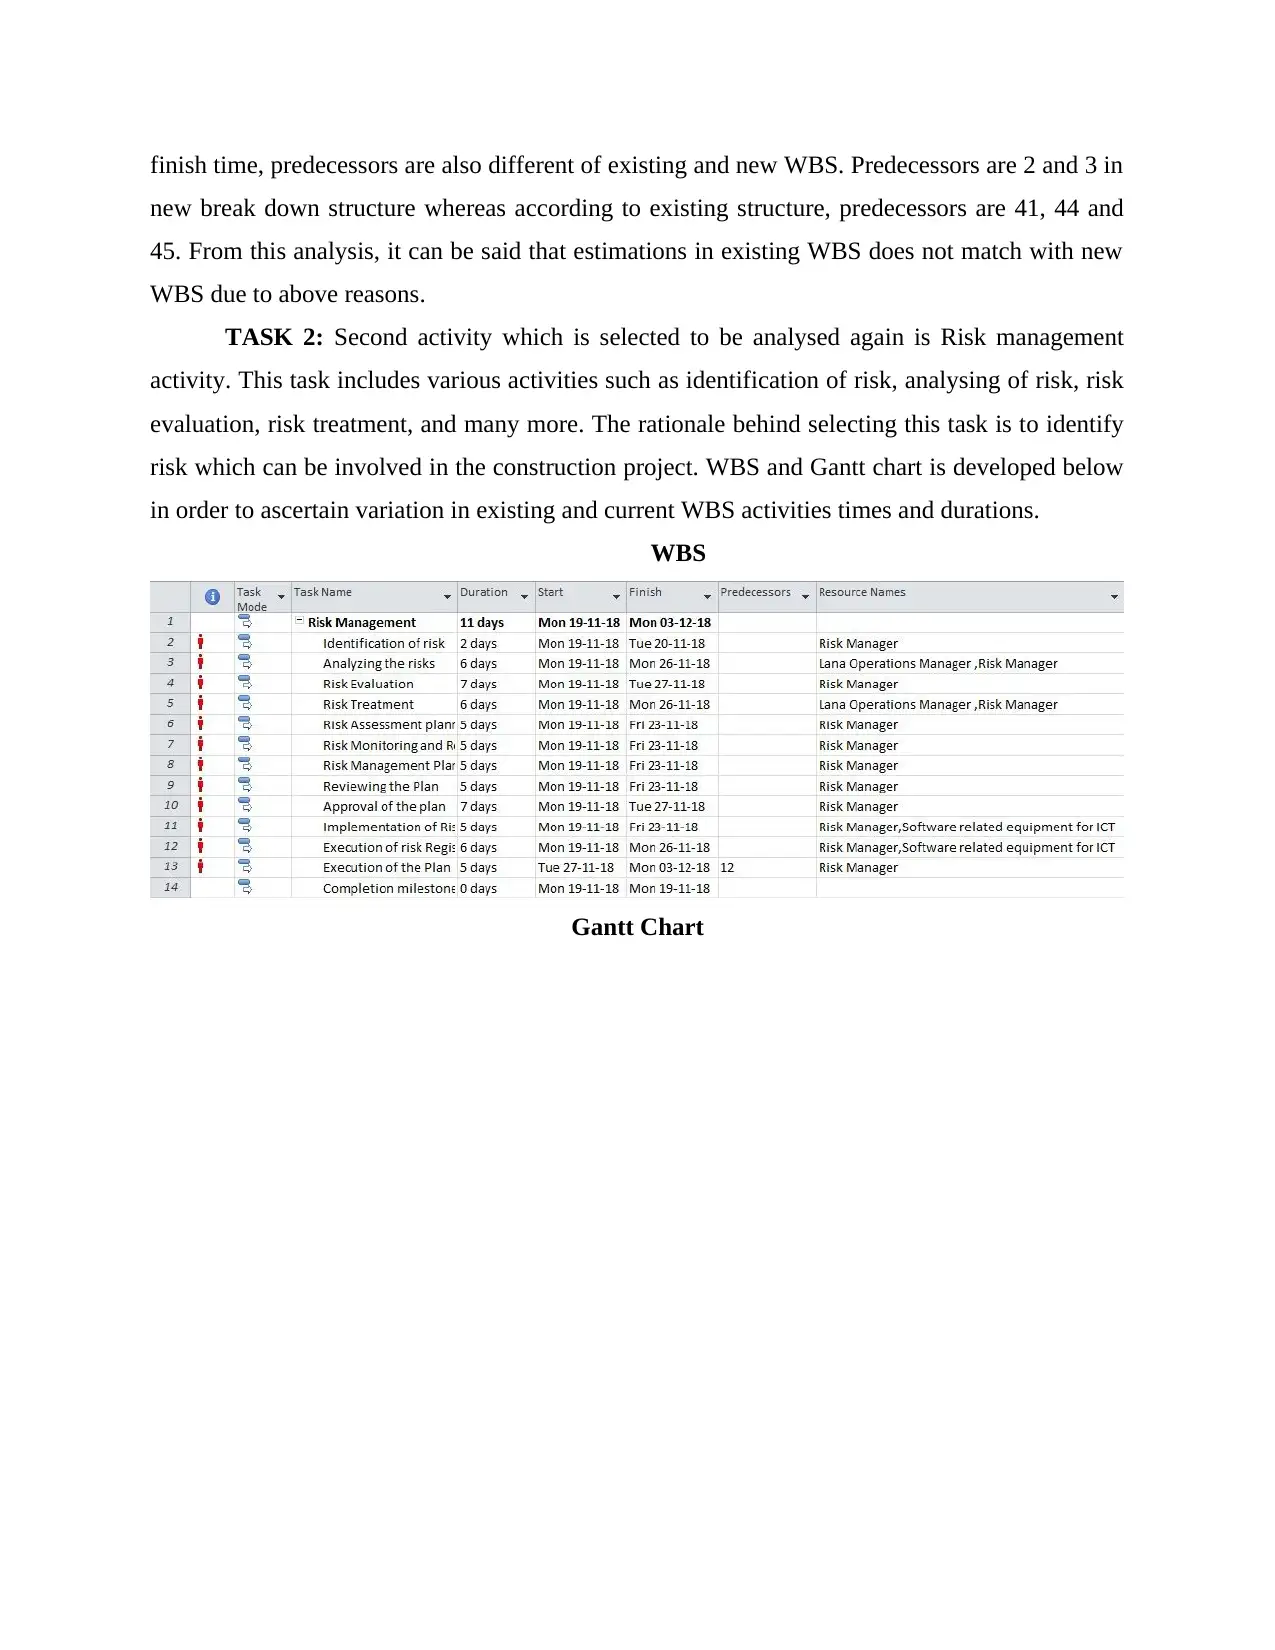
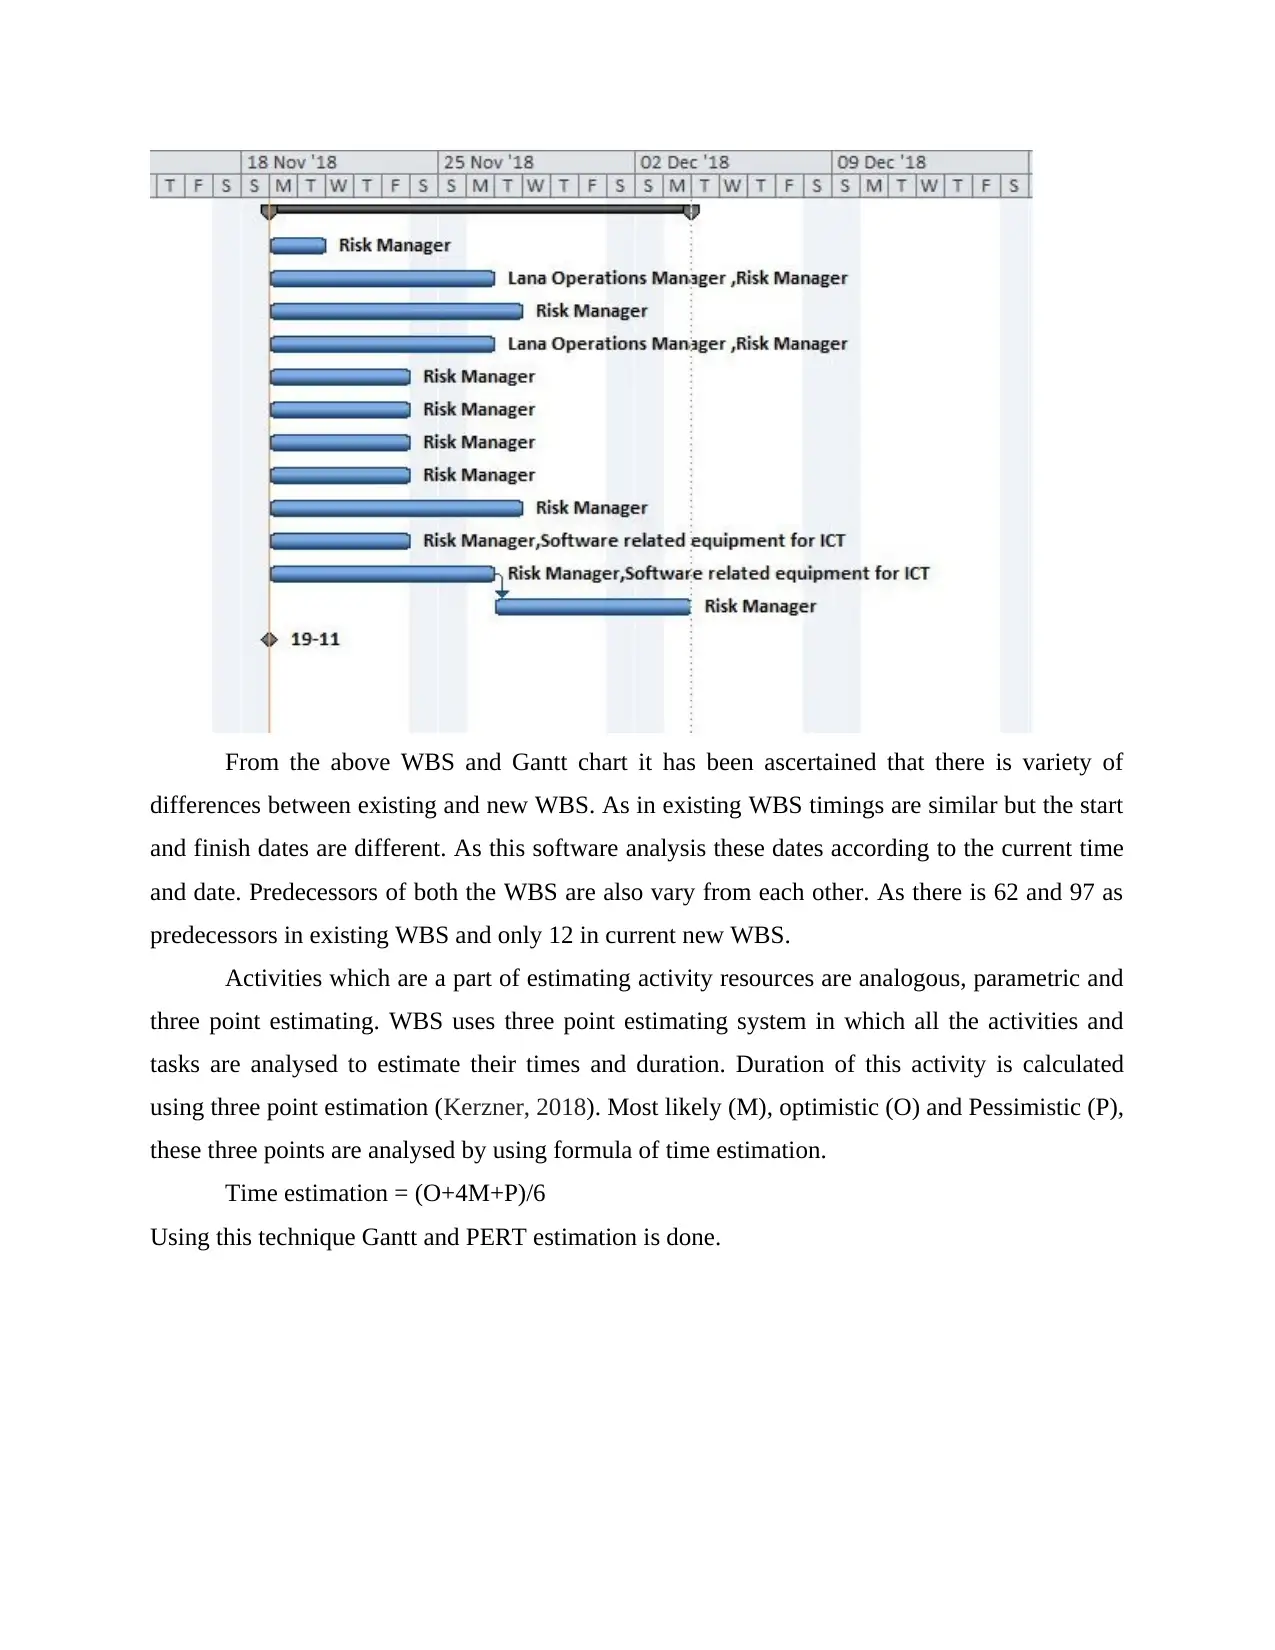
This project management assignment analyzes Work Breakdown Structures (WBS) focusing on two key tasks: pricing and risk management within a construction project context. The analysis compares existing WBS estimations with newly prepared ones, highlighting variations in start and finish times, and predecessors due to changes in project timelines. The pricing phase is evaluated with its sub-activities such as marketing, expenditure control, and follow-up, comparing durations between the existing and new WBS. The risk management activity, including risk identification, analysis, and treatment, is also examined, demonstrating differences in predecessors and task durations. The assignment employs Gantt charts and three-point estimation techniques to determine the duration of activities, using optimistic, pessimistic, and most likely scenarios to calculate time estimations. The project references established project management literature to support its analysis.
Document Page
Project Management
tabler-icon-diamond-filled.svg

Paraphrase This Document

Need a fresh take? Get an instant paraphrase of this document with our AI Paraphraser
Document Page
Work Break down structure is a technique of project management in which various tasks
are evaluated and analysed with the aim of organise team’s work into manageable sections. It is a
project management body of knowledge which is executed by the project team (Cha, Newman
and Winch, 2018). WBS helps in denoting times and durations which are incurred by an
organisation while performing or executing various challenging tasks. With the help of existing
WBS which is prepared on a construction project, two complicated task are analysed and
estimated below:
TASK 1: First task which is selected from existing WBS is Pricing phase. This task is
evaluated again to ensure that the estimations which were made are accurate or not. WBS is
considered as 98% probable as it is based on testing and production environments. There are
various cases in which WBS under estimates or over estimates the total time. Pricing phase is
analysed again using WBS along with its Gantt chart.
WBS
Gantt Chart
From the above WBS and Gantt chart it has been observed that there are four sub
activities in the task of pricing phase that is marketing and selling, expenditure control, keeping
track and follow up of completing this milestone. Duration which is set for this task is 26 days.
But unlike existing WBS, this newly prepared WBS has different start and finish periods. This
difference is due to the reason of variation in time in which WBS is prepared. Besides start and
Document Page
finish time, predecessors are also different of existing and new WBS. Predecessors are 2 and 3 in
new break down structure whereas according to existing structure, predecessors are 41, 44 and
45. From this analysis, it can be said that estimations in existing WBS does not match with new
WBS due to above reasons.
TASK 2: Second activity which is selected to be analysed again is Risk management
activity. This task includes various activities such as identification of risk, analysing of risk, risk
evaluation, risk treatment, and many more. The rationale behind selecting this task is to identify
risk which can be involved in the construction project. WBS and Gantt chart is developed below
in order to ascertain variation in existing and current WBS activities times and durations.
WBS
Gantt Chart
Document Page
From the above WBS and Gantt chart it has been ascertained that there is variety of
differences between existing and new WBS. As in existing WBS timings are similar but the start
and finish dates are different. As this software analysis these dates according to the current time
and date. Predecessors of both the WBS are also vary from each other. As there is 62 and 97 as
predecessors in existing WBS and only 12 in current new WBS.
Activities which are a part of estimating activity resources are analogous, parametric and
three point estimating. WBS uses three point estimating system in which all the activities and
tasks are analysed to estimate their times and duration. Duration of this activity is calculated
using three point estimation (Kerzner, 2018). Most likely (M), optimistic (O) and Pessimistic (P),
these three points are analysed by using formula of time estimation.
Time estimation = (O+4M+P)/6
Using this technique Gantt and PERT estimation is done.
tabler-icon-diamond-filled.svg

Paraphrase This Document

Need a fresh take? Get an instant paraphrase of this document with our AI Paraphraser
Document Page
Document Page
REFERENCES
Books and Journals
Cha, J., Newman, M., & Winch, G. (2018). Revisiting the project management knowledge
framework: Rebalancing the framework to include transformation projects.
International Journal of Managing Projects in Business. 11(4). 1026-1043.
Kerzner, H. (2018). Project management best practices: Achieving global excellence. John
Wiley & Sons.
chevron_up_icon
1 out of 6
circle_padding
hide_on_mobile
zoom_out_icon
[object Object]