An Empirical Study of Work, Religion, and Happiness Using WVS Data
VerifiedAdded on 2023/06/08
|21
|4053
|181
Essay
AI Summary
This essay investigates the relationship between work, religion, and happiness using quantitative data from the World Values Survey (WVS). It formulates two primary hypotheses: that there is a positive relationship between religion and happiness, and that there is a positive relationship between work and happiness. The methodology section details the use of WVS data, independent variables (work and religion), and the dependent variable (happiness). The data analysis section covers statistical assumptions such as normality, multicollinearity, linearity, and homoscedasticity, followed by descriptive analysis including frequencies, mean, median, and standard deviation. Correlation and regression analyses are conducted to test the hypotheses. The results indicate the importance of both work and religion to overall happiness, with the majority of respondents reporting positive feelings. The essay concludes by summarizing the findings and their implications.

Running Head: RELATIONSHIP BETWEEN WORK AND RELIGION ON HAPPINESS
Relationship Between Work and Religion on Happiness
Name of the Student
Name of the University
Student ID
Relationship Between Work and Religion on Happiness
Name of the Student
Name of the University
Student ID
Paraphrase This Document
Need a fresh take? Get an instant paraphrase of this document with our AI Paraphraser

1RELATIONSHIP BETWEEN WORK AND RELIGION ON HAPPINESS
Table of Contents
1. Introduction............................................................................................................................3
2. Conceptual Framework..........................................................................................................3
2.1 Religion and Happiness....................................................................................................4
2.2 Work and Happiness........................................................................................................4
3. Methodology..........................................................................................................................5
3.1 World Value Survey.........................................................................................................5
3.2 Independent Variables......................................................................................................5
3.3 Dependent Variable..........................................................................................................6
4. Data Analysis Results and Discussions..................................................................................6
4.1 Statistical Assumptions....................................................................................................6
4.1.1 Normality..................................................................................................................7
4.1.2 Multicollinearity........................................................................................................7
4.1.3 Linearity and Homoscedasticity................................................................................8
4.2 Descriptive Analysis........................................................................................................8
4.2.1 Frequencies...............................................................................................................9
4.2.2 Mean, Median and Standard Deviation...................................................................11
4.3 Correlation Analysis.......................................................................................................12
4.4 Regression Analysis.......................................................................................................13
5. Conclusion............................................................................................................................14
References................................................................................................................................15

2RELATIONSHIP BETWEEN WORK AND RELIGION ON HAPPINESS
Appendix..................................................................................................................................17
1. Introduction
The concept of happiness is an extremely abstract concept. The concept has been of
immense interest to the philosophers from a very long time. The background of an empirical
research cannot be framed with the help of only an abstract concept (Abdullah and Ling
2016). Thus, various concepts have been developed so as to understand happiness. In all the
concepts, happiness has been considered as a dependent variable to various other factors (Van
De Voorde and Beijer 2015). The correlates of happiness have been considered as
psychological and various studies have been considered on the nature of happiness and the
discussion has been operationalized properly. Progress has been observed in the studying
happiness on the psychological note with the help of the measurement of the psychological
construct (Proyer et al. 2015). It has been observed from the study by Vallina and Guerrero
(2018), that the components of happiness have been mainly positive effect, satisfaction for a
prolonged period and lesser negative feelings indicated by mainly anxiety and depression.
Thus, keeping in mind the above discussions, the research for this study can be
framed. The aim of this study is given as follows:
Aim: There exists a positive relationship between work and religion towards happiness
In order to conduct the study to satisfy the aim of this research, the following sections
have been developed. The section 1 has provided an overview of the research, section 2 will
provide an insight towards the conceptual framework of the study, section 3 will give an
insight on the methodology used for this study and section 4 will provide the results and
discussions of the analysis.
2. Conceptual Framework
⊘ This is a preview!⊘
Do you want full access?
Subscribe today to unlock all pages.
Trusted by 1+ million students worldwide

3RELATIONSHIP BETWEEN WORK AND RELIGION ON HAPPINESS
2.1 Religion and Happiness
Some people are religious and they find satisfaction by maintaining their religion
(Capaldi, Dopko and Zelenski 2014). A person is said to be religious, if the person has a
belief in their respective religious god. Some people find their happiness by expressing
themselves in front of their God, sharing their problems with God provides them with a peace
of mind (Steel et al. 2018). This helps them to think through their problem properly and have
a solution to it. This in turn reduces their depression or distress and provides satisfaction to
the person, which is again a positive component of happiness (Aghababaei and Błachnio
2014). There are a lot of people who are not that religious and they try to solve their problems
all by themselves (Abdel-Khalek and Lester 2017). To them, god is no one to help out with
the humanly problems in real life (Fenelon and Danielsen 2016). From various studies, it has
been observed that there is a positive relationship between religiousness and happiness.
H1: There is a positive relationship between Religion and Happiness
2.2 Work and Happiness
Determinants of happiness are determined by various factors. Circumstances faced in
the lives of a person is one of the most important determinants of happiness. To a person,
who is having a work life, it becomes a challenge for the person to maintain the work-life
balance (Bryson and MacKerron 2017). A person, who is efficient enough to maintain the
Paraphrase This Document
Need a fresh take? Get an instant paraphrase of this document with our AI Paraphraser
4RELATIONSHIP BETWEEN WORK AND RELIGION ON HAPPINESS
work life balance has been found to have happiness more than the ones who are not that
efficient in maintaining the balance. Moreover, job satisfaction is another important matter. If
there is no satisfaction in the job a person is working on, it is not possible for the person to
have happiness in his or her personal life (Abdullah and Ling 2016). The frustration and the
depression of the work life will be reflected in their personal life as well. Thus, according to
various studies, it has been observed that there is a positive relationship between work and
happiness.
H2: There is a positive relationship between Work and Happiness
3. Methodology
Quantitative research methodology has been used for the purpose of this research. The
philosophy of positivism and a deductive approach has been followed along with the
hypothesis testing techniques that has been considered to test the research hypotheses. The
tests have been conducted from the data collected from the World Values Survey (WVS)
Wave 5 (Saunders, Lewis and Thornhill, 2016).
3.1 World Value Survey
In the analysis conducted here, the data has been collected quantitatively with the help
of a questionnaire developed. The questionnaire was distributed to some of the respondents in
UK selected randomly. WVS had conducted the survey in the year 2015
(worldvaluessurvey.org 2015) and there are certain disadvantages to the data collected from
this survey. The survey was conducted just for the record and by not keeping in mind any
particular study. Thus, there can be some problems related to the validity of the data.
3.2 Independent Variables
work life balance has been found to have happiness more than the ones who are not that
efficient in maintaining the balance. Moreover, job satisfaction is another important matter. If
there is no satisfaction in the job a person is working on, it is not possible for the person to
have happiness in his or her personal life (Abdullah and Ling 2016). The frustration and the
depression of the work life will be reflected in their personal life as well. Thus, according to
various studies, it has been observed that there is a positive relationship between work and
happiness.
H2: There is a positive relationship between Work and Happiness
3. Methodology
Quantitative research methodology has been used for the purpose of this research. The
philosophy of positivism and a deductive approach has been followed along with the
hypothesis testing techniques that has been considered to test the research hypotheses. The
tests have been conducted from the data collected from the World Values Survey (WVS)
Wave 5 (Saunders, Lewis and Thornhill, 2016).
3.1 World Value Survey
In the analysis conducted here, the data has been collected quantitatively with the help
of a questionnaire developed. The questionnaire was distributed to some of the respondents in
UK selected randomly. WVS had conducted the survey in the year 2015
(worldvaluessurvey.org 2015) and there are certain disadvantages to the data collected from
this survey. The survey was conducted just for the record and by not keeping in mind any
particular study. Thus, there can be some problems related to the validity of the data.
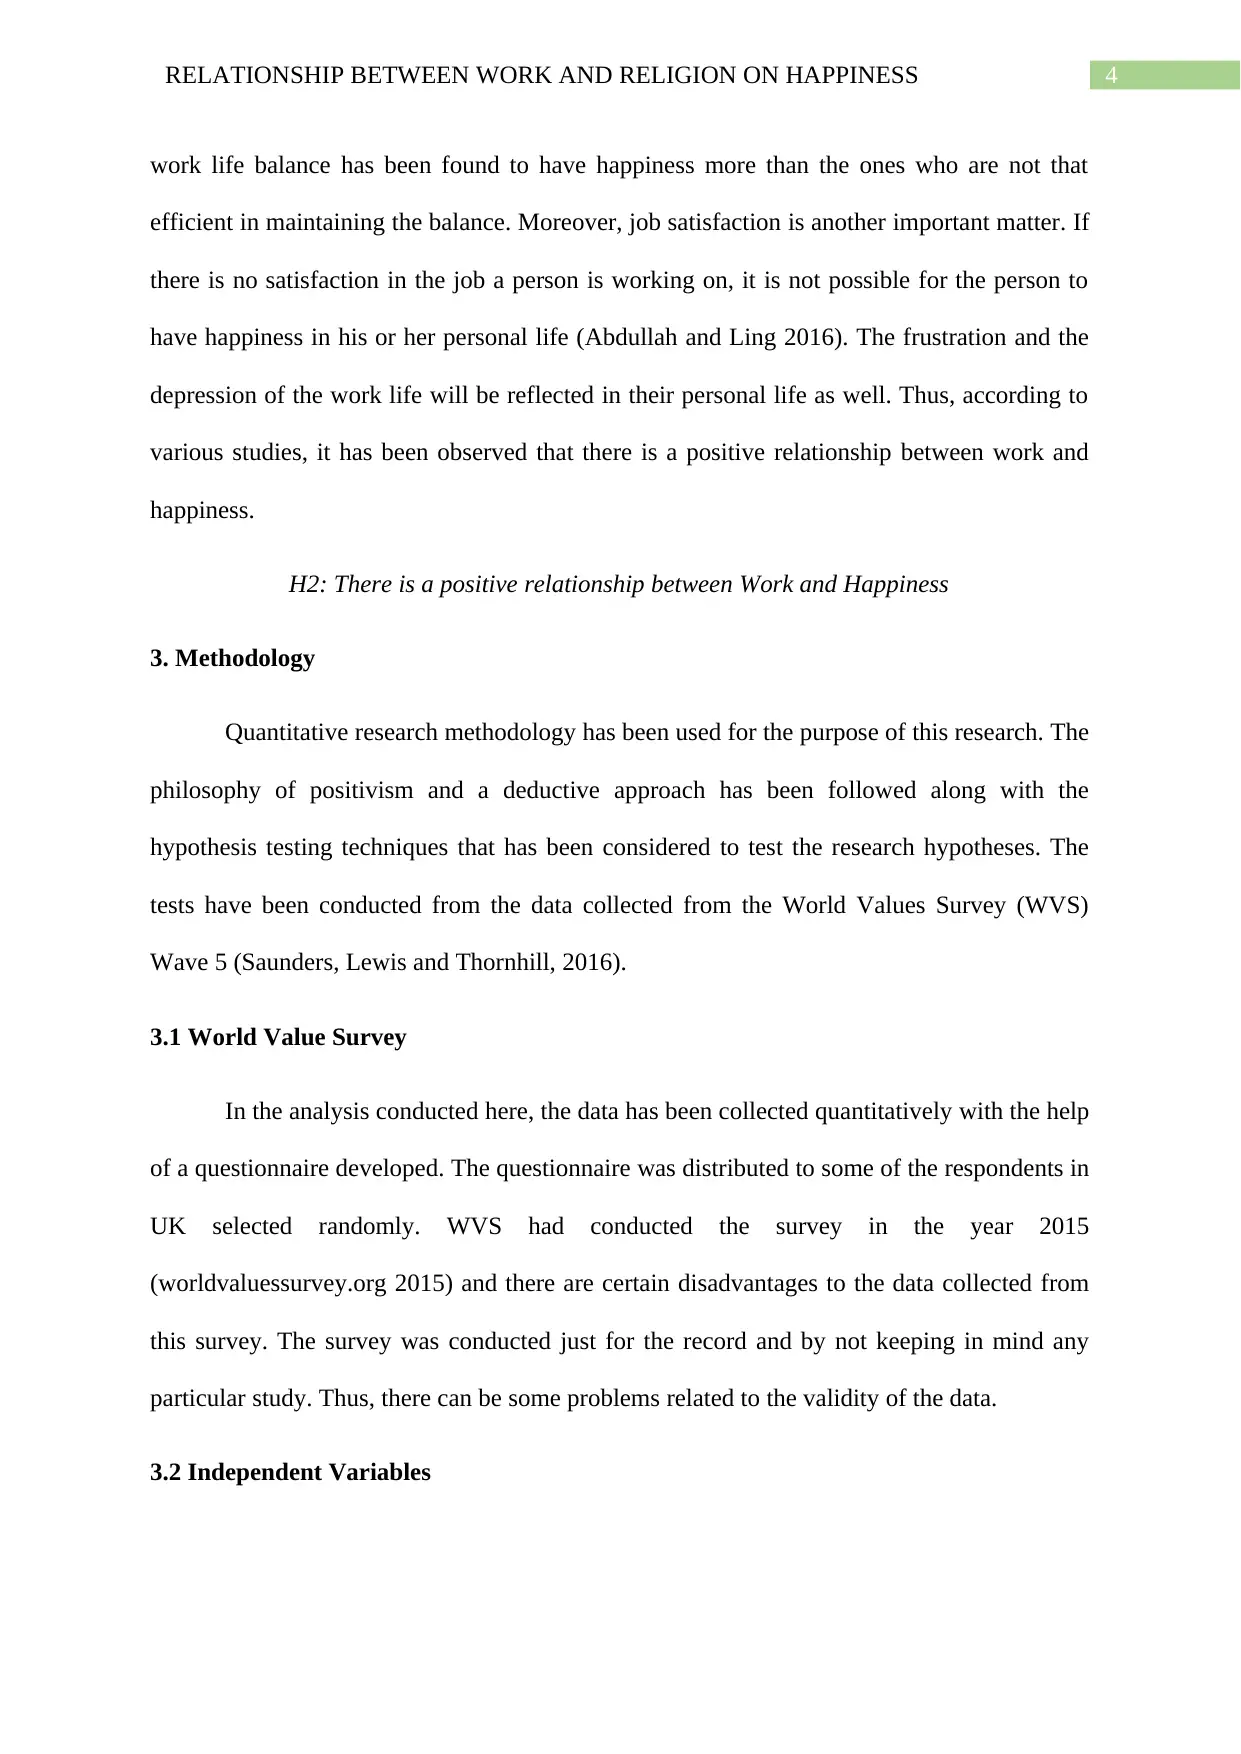
3.2 Independent Variables
5RELATIONSHIP BETWEEN WORK AND RELIGION ON HAPPINESS
Independent variables are the variables which are not affected by the presence of any
other variables. The independent variables are also known as explanatory variables as these
variables are used to explain the changes in the dependent variables or the predicted variable
(Gupta 2017). For this study, the independent variables considered are work and religion.
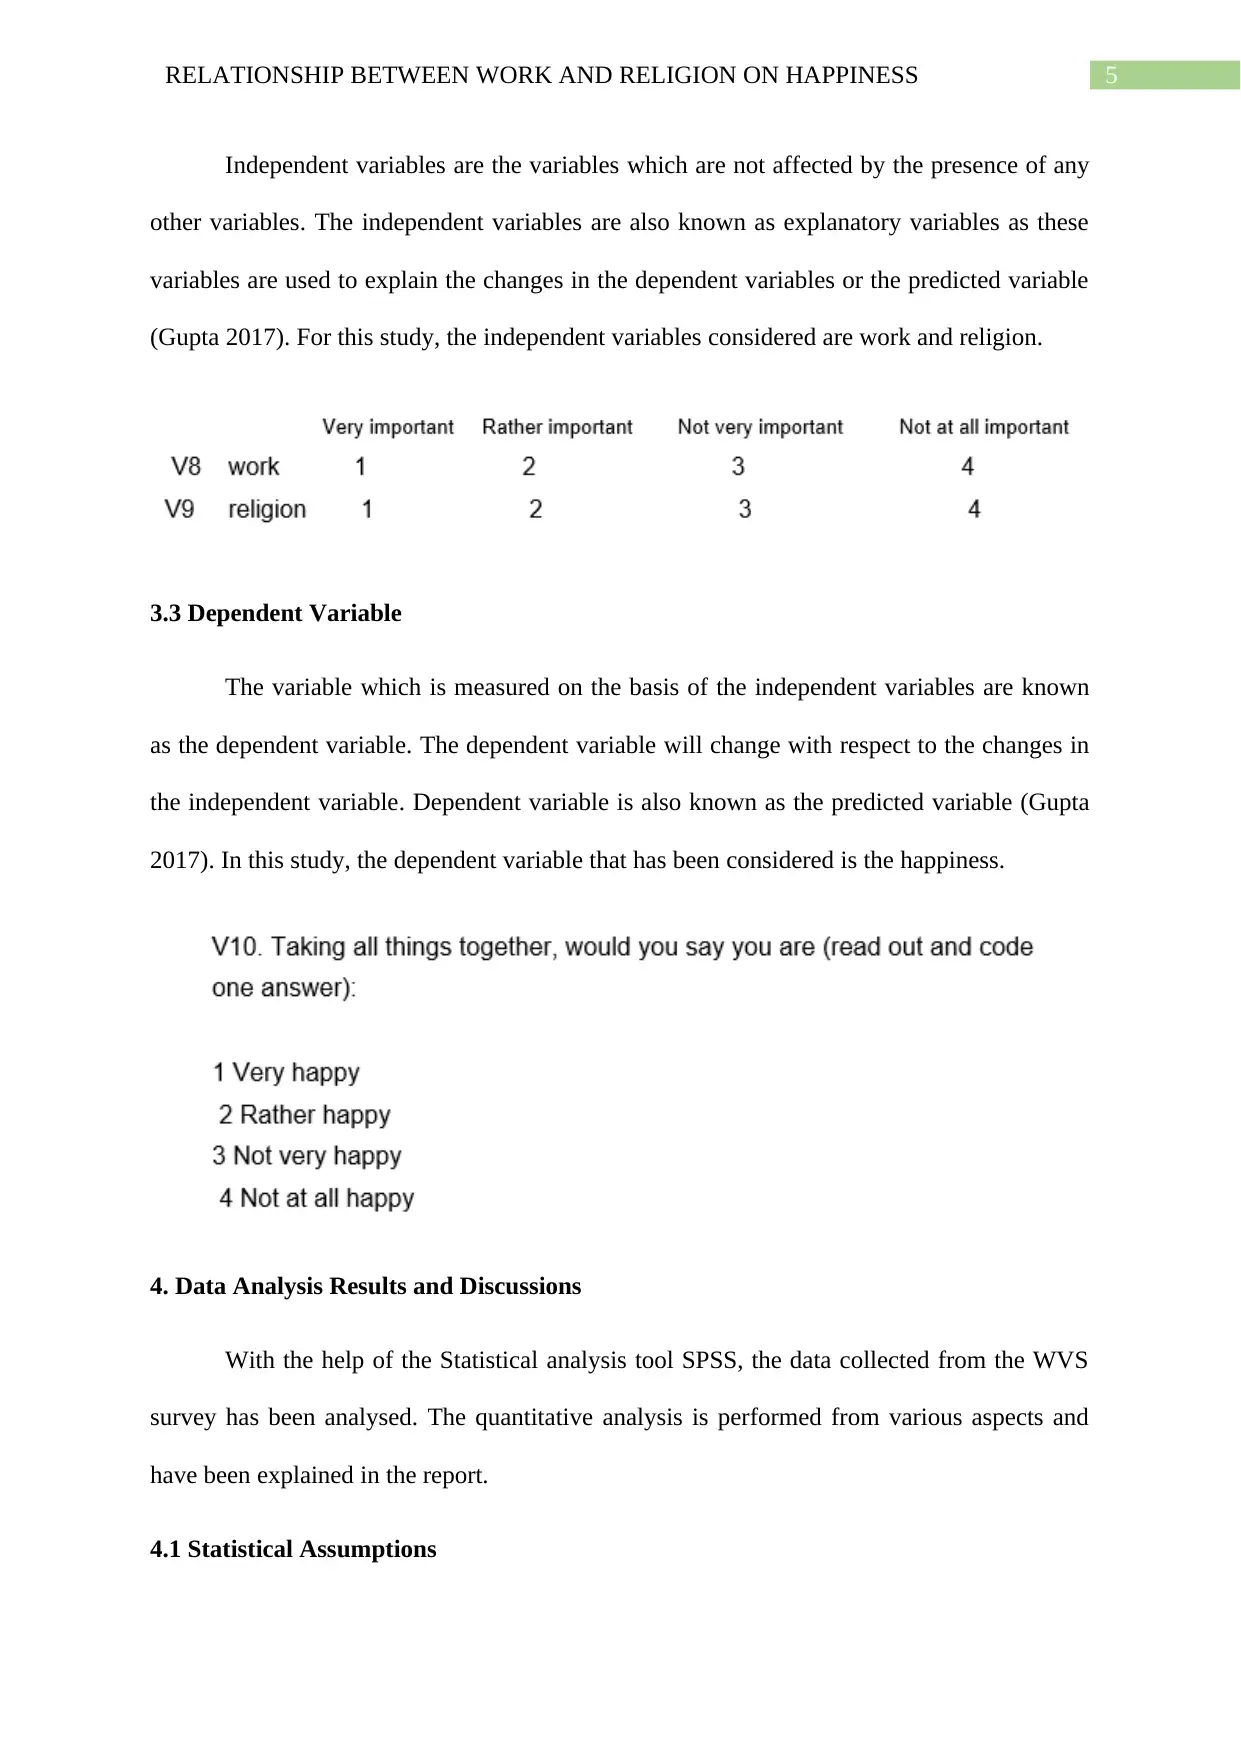
3.3 Dependent Variable
The variable which is measured on the basis of the independent variables are known
as the dependent variable. The dependent variable will change with respect to the changes in
the independent variable. Dependent variable is also known as the predicted variable (Gupta
2017). In this study, the dependent variable that has been considered is the happiness.
4. Data Analysis Results and Discussions
With the help of the Statistical analysis tool SPSS, the data collected from the WVS
survey has been analysed. The quantitative analysis is performed from various aspects and
have been explained in the report.
4.1 Statistical Assumptions
Independent variables are the variables which are not affected by the presence of any
other variables. The independent variables are also known as explanatory variables as these
variables are used to explain the changes in the dependent variables or the predicted variable
(Gupta 2017). For this study, the independent variables considered are work and religion.
3.3 Dependent Variable
The variable which is measured on the basis of the independent variables are known
as the dependent variable. The dependent variable will change with respect to the changes in
the independent variable. Dependent variable is also known as the predicted variable (Gupta
2017). In this study, the dependent variable that has been considered is the happiness.
4. Data Analysis Results and Discussions
With the help of the Statistical analysis tool SPSS, the data collected from the WVS
survey has been analysed. The quantitative analysis is performed from various aspects and
have been explained in the report.
4.1 Statistical Assumptions
⊘ This is a preview!⊘
Do you want full access?
Subscribe today to unlock all pages.
Trusted by 1+ million students worldwide

6RELATIONSHIP BETWEEN WORK AND RELIGION ON HAPPINESS
There are a few statistical assumptions for statistical analysis to be performed for the
data to follow. Satisfying all the assumptions only the data will be considered suitable for
analysis. These assumptions are Normality, homoscedasticity, multicollinearity and linearity
(Sullivan III 2015).
4.1.1 Normality
A data is said to be normal if the data points by plotting on the graph shows a similar
nature towards the left as well as the right of the mean of the data. The measures of normality
are the skewness and the kurtosis measures (Sullivan III 2015). Table 4.1 gives the skewness
and the kurtosis measures obtained from the SPSS analysis.
Table 4.1: Normality of the Variables
Statistic Std. Error
Feeling of happiness Skewness 1.000 0.076
Kurtosis 1.067 0.152
Work Important Skewness 0.793 0.080
Kurtosis -0.384 0.159
Religion Important Skewness -0.275 0.076
Kurtosis -1.170 0.153
It can be seen from the table that all the values of skewness and kurtosis lies between
-2 and +2. This indicates that the values are between permissible limit of normality and hence
can be said the data selected is normally distributed. The normal Q-Q plot provided in the
appendix section provides a clearer illustration that the data follows normality.
4.1.2 Multicollinearity
The presence of any interrelations between the independent variables are determined
with the help of multicollinearity. The value of the VIF provides an insight about the
presence of multicollinearity in the data. A value of VIF higher than 3 indicates inter
relationship between the dependent variables (Bharti and Bharti 2014).
Table 4.2: Collinearity Diagnostics
Paraphrase This Document
Need a fresh take? Get an instant paraphrase of this document with our AI Paraphraser

7RELATIONSHIP BETWEEN WORK AND RELIGION ON HAPPINESS
Tolerance VIF
Work important .989 1.011
Religion important .989 1.011
From table 4.2, it can be seen clearly that the values of VIF are less than 3 in both the
cases. This indicates that no inter-relationship exists between the independent variables work
and religion. This provides an advantage for the data analysis.
4.1.3 Linearity and Homoscedasticity
Assumption of linearity is a very important assumption in case of linear regression
analysis. With the help of a scatter diagram, the nature of the data between an independent
variable and a dependent variable has to be evaluated and tested for the linearity of
curvilinearity of the variables. Linearity assumption will be met only if the data follows a
linear trend (Draper and Smith 2014).
Figure 4.1: Graph for linearity and homoscedasticity
It can be seen from the graph that there is a linear relationship between work and
happiness. Thus, it can be said that the linearity and the homoscedasticity conditions has been
satisfied.
4.2 Descriptive Analysis

8RELATIONSHIP BETWEEN WORK AND RELIGION ON HAPPINESS
A clear idea about the frequency and the frequency distribution of the involved
variables can be illustrated with the help of the descriptive analysis. The properties of the data
involved can be analysed with the help of these techniques.
4.2.1 Frequencies
The number of occurrences of each response in a variable is indicated with the help of
a frequency distribution (Gupta 2017).
Figure 4.2
Table 4.3: Work important
Frequency Percent
Valid
Very important 353 37.6
Rather important 365 38.8
Not very important 108 11.5
Not at all important 114 12.1
Total 940 100.0
It can be seen from table 4.3 that to most of the people, work is extremely important.
To 37 percent of the respondents, work has been found to be very important and important to
38 percent people. It has been unimportant to very little percentage of the respondents.
⊘ This is a preview!⊘
Do you want full access?
Subscribe today to unlock all pages.
Trusted by 1+ million students worldwide

9RELATIONSHIP BETWEEN WORK AND RELIGION ON HAPPINESS
Figure 4.3
Table 4.4: Religion important
Frequency Percent
Valid
Very important 209 20.4
Rather important 200 19.5
Not very important 353 34.4
Not at all important 264 25.7
Total 1026 100.0
It can be seen from the table 4.4 that, to most of the respondents, religion has not been
that important. To 34 percent people, religion is not very important and to 25 percent people,
religion has not at all been important. Thus, it can be said that the people of UK does not give
religion much preference.
Paraphrase This Document
Need a fresh take? Get an instant paraphrase of this document with our AI Paraphraser

10RELATIONSHIP BETWEEN WORK AND RELIGION ON HAPPINESS
Figure 4.4
Table 4.5: Feeling of happiness
Frequency Percent
Valid
Very happy 525 50.5
Quite happy 445 42.8
Not very happy 55 5.3
Not at all happy 14 1.3
Total 1039 100.0
It can be seen from table 4.5 that the feeling of happiness of the respondents of UK
are mostly positive. Thus, most of the UK respondents are very happy with their lives. Very
little percentage of people have been observed to be unhappy.
4.2.2 Mean, Median and Standard Deviation
The average of the values present in the dataset is known as the mean of the values.
The middlemost value of the dataset is denoted by the median and the standard deviation
indicates the average of the deviations of each of the values from the mean of the variable.
Table 4.6: Statistics
Feeling of happiness Work important Religion important
Mean 1.57 1.98 2.65
Median 1.00 2.00 3.00
Std. Deviation .657 .988 1.072

11RELATIONSHIP BETWEEN WORK AND RELIGION ON HAPPINESS
It can be seen from the analysis that the average score of happiness and importance of
work is less indicating high levels of happiness and importance to work. Religion has also
been found to be important to most of the people. The standard deviation for each of the
variables is less indicating that the values are close to the mean value. Moreover, the mean
and the median are found to be close, indicating that the data is distributed evenly.
4.3 Correlation Analysis
The Association between the independent and the dependent variable is shown with
the help of the correlation analysis. The association can be of three types – positively
associated, negatively associated and not associated. The Pearsonian correlation coefficient
illustrates the association between the variables. The positive sign indicates positive
association; negative sign indicates negative association. A p-value less than 0.05 indicates
that the association is significant (Chatterjee and Hadi 2015). It can be seen from table 4.7
that both work and religion are positively associated with happiness but the association
between religion and happiness is significant.
Table 4.7: Correlations
Work
important
Religion
important
Feeling of
happiness
Work important
Pearson Correlation 1 .105** .028
Sig. (2-tailed) .001 .388
N 940 929 938
Religion important
Pearson Correlation .105** 1 .068*
Sig. (2-tailed) .001 .030
N 929 1026 1025
Feeling of happiness
Pearson Correlation .028 .068* 1
Sig. (2-tailed) .388 .030
N 938 1025 1039
**. Correlation is significant at the 0.01 level (2-tailed).
*. Correlation is significant at the 0.05 level (2-tailed).
⊘ This is a preview!⊘
Do you want full access?
Subscribe today to unlock all pages.
Trusted by 1+ million students worldwide
1 out of 21
Related Documents


Your All-in-One AI-Powered Toolkit for Academic Success.
+13062052269
info@desklib.com
Available 24*7 on WhatsApp / Email
![[object Object]](/_next/static/media/star-bottom.7253800d.svg)
Unlock your academic potential
Copyright © 2020–2026 A2Z Services. All Rights Reserved. Developed and managed by ZUCOL.