Statistical Analysis Report: ANOVA Analysis on Gender and Work

Verified

Added on  2022/12/19

|4
|447
|52
Report
AI Summary
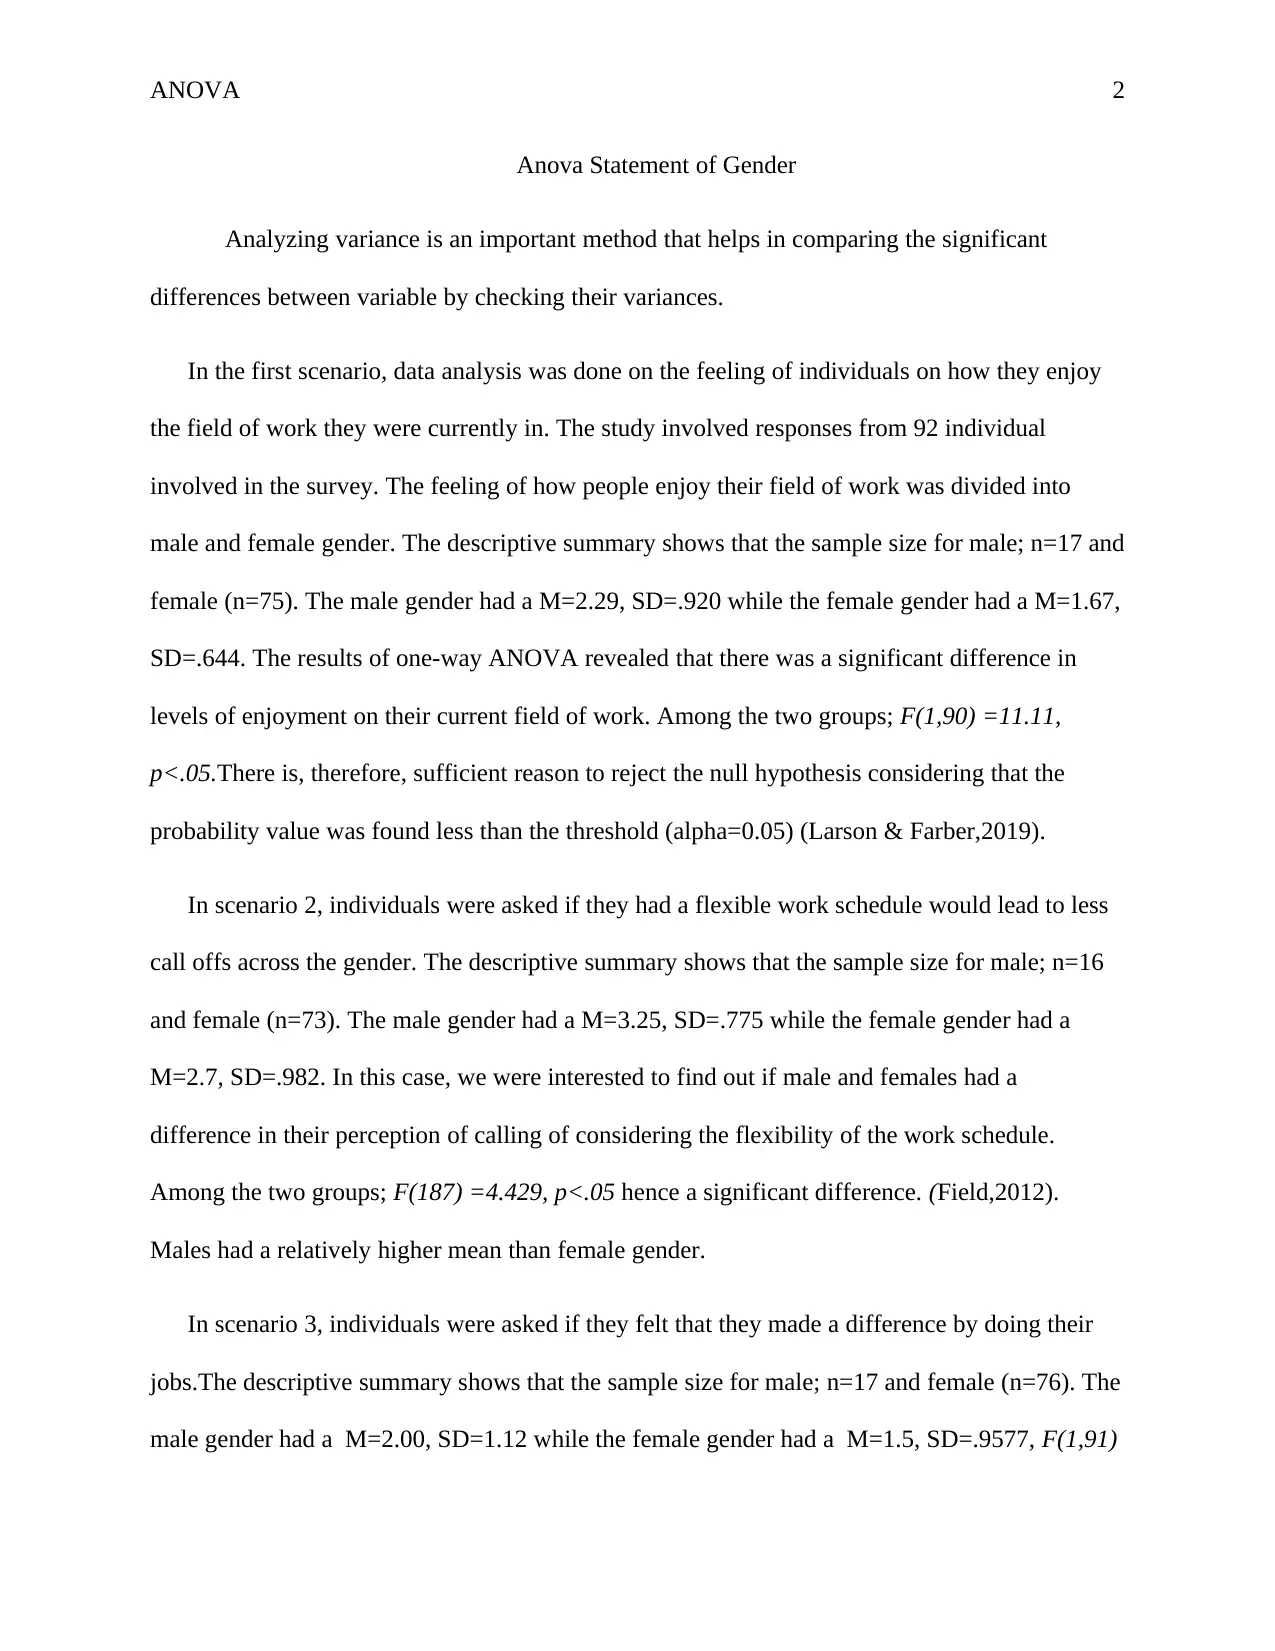
This report presents an analysis of variance (ANOVA) to examine the differences in work-related perceptions between genders. The study investigates three scenarios: the enjoyment of work, the impact of flexible work schedules on call-offs, and the feeling of making a difference through work. The analysis includes descriptive statistics, such as means and standard deviations for male and female groups, and the results of the one-way ANOVA tests. The findings reveal significant differences between genders in all three scenarios. The report highlights the statistical significance of the results, indicating that gender plays a role in how individuals perceive their work experiences. The report also references the sources used for the analysis, including Field (2012) and Larson & Farber (2019).
Document Page
Running head: ANOVA 1
ANOVA
Name
Institution
tabler-icon-diamond-filled.svg

Paraphrase This Document

Need a fresh take? Get an instant paraphrase of this document with our AI Paraphraser
Document Page
ANOVA 2
Anova Statement of Gender
Analyzing variance is an important method that helps in comparing the significant
differences between variable by checking their variances.
In the first scenario, data analysis was done on the feeling of individuals on how they enjoy
the field of work they were currently in. The study involved responses from 92 individual
involved in the survey. The feeling of how people enjoy their field of work was divided into
male and female gender. The descriptive summary shows that the sample size for male; n=17 and
female (n=75). The male gender had a M=2.29, SD=.920 while the female gender had a M=1.67,
SD=.644. The results of one-way ANOVA revealed that there was a significant difference in
levels of enjoyment on their current field of work. Among the two groups; F(1,90) =11.11,
p<.05.There is, therefore, sufficient reason to reject the null hypothesis considering that the
probability value was found less than the threshold (alpha=0.05) (Larson & Farber,2019).
In scenario 2, individuals were asked if they had a flexible work schedule would lead to less
call offs across the gender. The descriptive summary shows that the sample size for male; n=16
and female (n=73). The male gender had a M=3.25, SD=.775 while the female gender had a
M=2.7, SD=.982. In this case, we were interested to find out if male and females had a
difference in their perception of calling of considering the flexibility of the work schedule.
Among the two groups; F(187) =4.429, p<.05 hence a significant difference. (Field,2012).
Males had a relatively higher mean than female gender.
In scenario 3, individuals were asked if they felt that they made a difference by doing their
jobs.The descriptive summary shows that the sample size for male; n=17 and female (n=76). The
male gender had a M=2.00, SD=1.12 while the female gender had a M=1.5, SD=.9577, F(1,91)
Document Page
ANOVA 3
=7.02, p<.05. Males and females, therefore, had significant differences. Males had a relatively
higher mean than female gender.
Document Page
ANOVA 4
References
Field, Andy. (2012), Discovering statistics using SPSS. 3rd ed. London: Sage Publications Ltd.
Larson, R., & Farber, B. (2019). Elementary statistics. Pearson.
chevron_up_icon
1 out of 4
circle_padding
hide_on_mobile
zoom_out_icon
[object Object]