BSBHRM404: Workforce Data Analysis for Star Industries
VerifiedAdded on  2023/01/09
|12
|2010
|79
Report
AI Summary
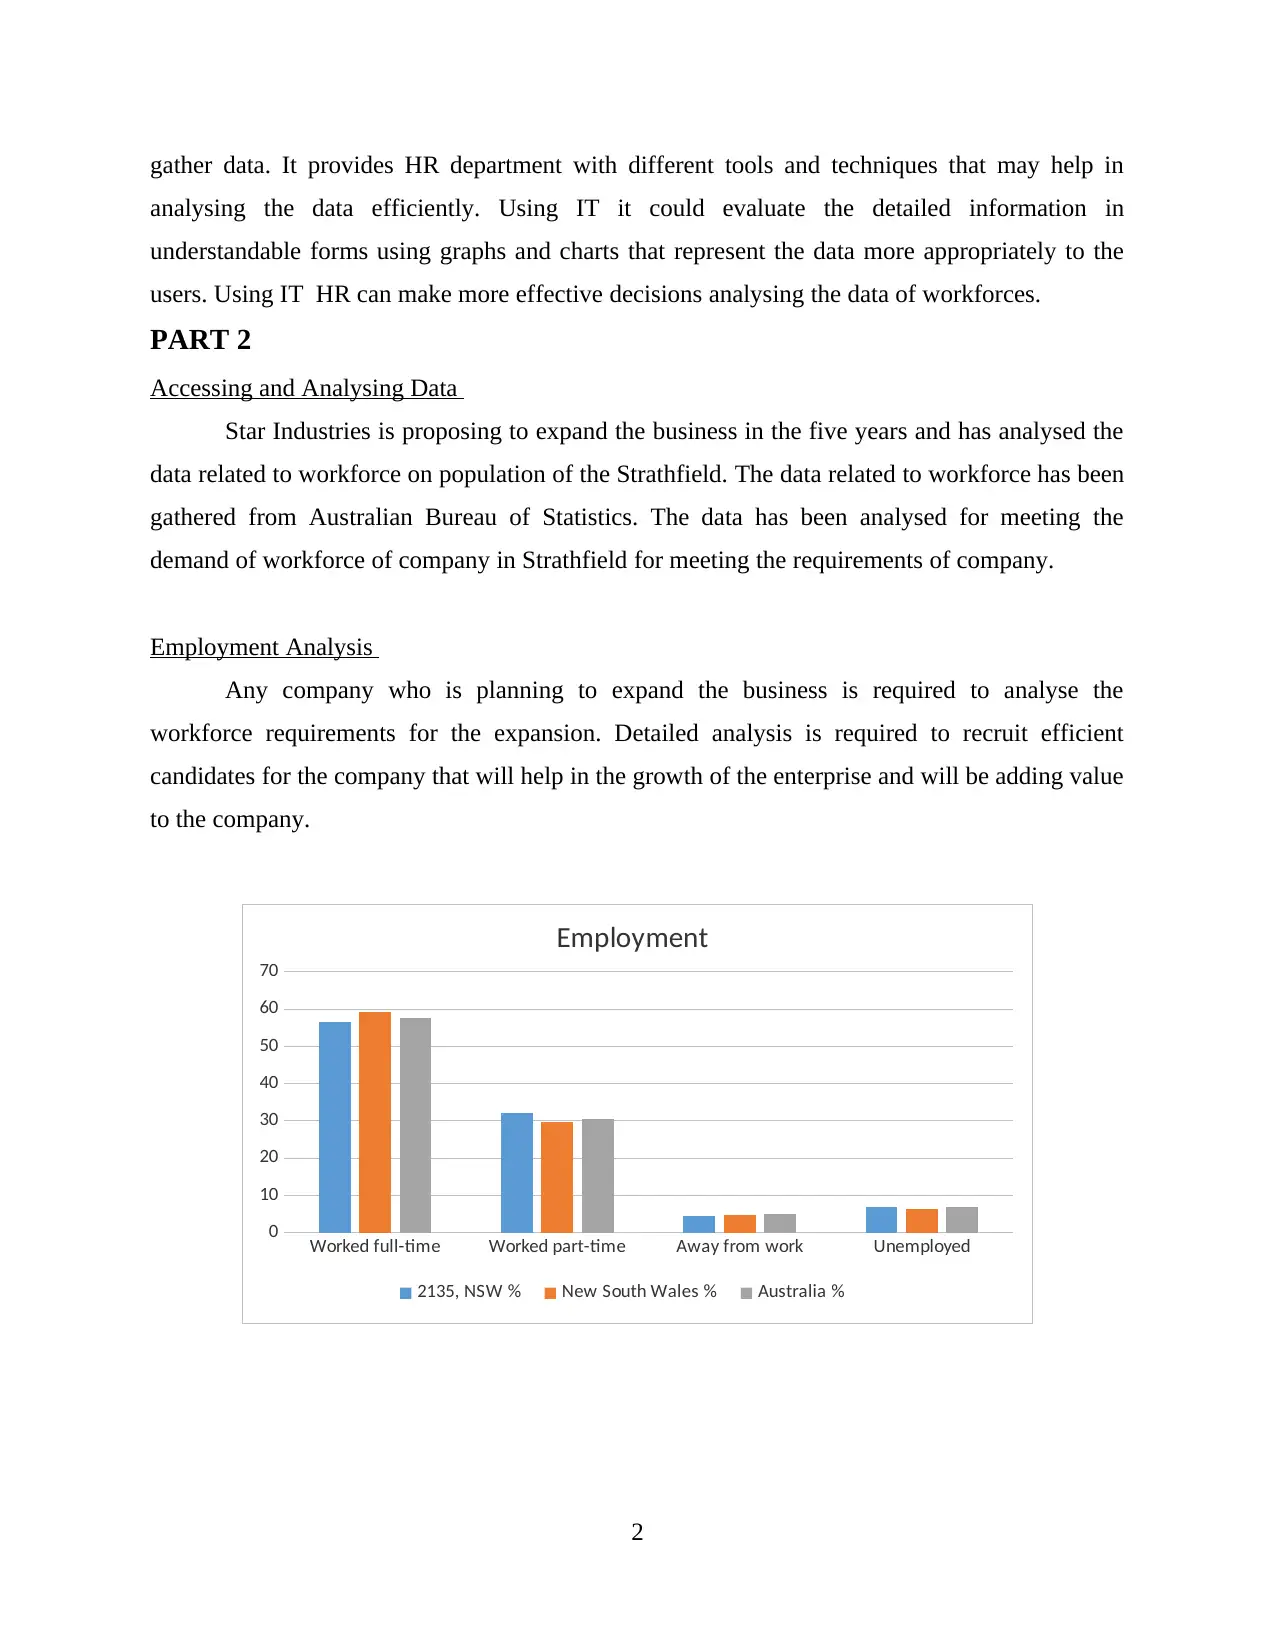
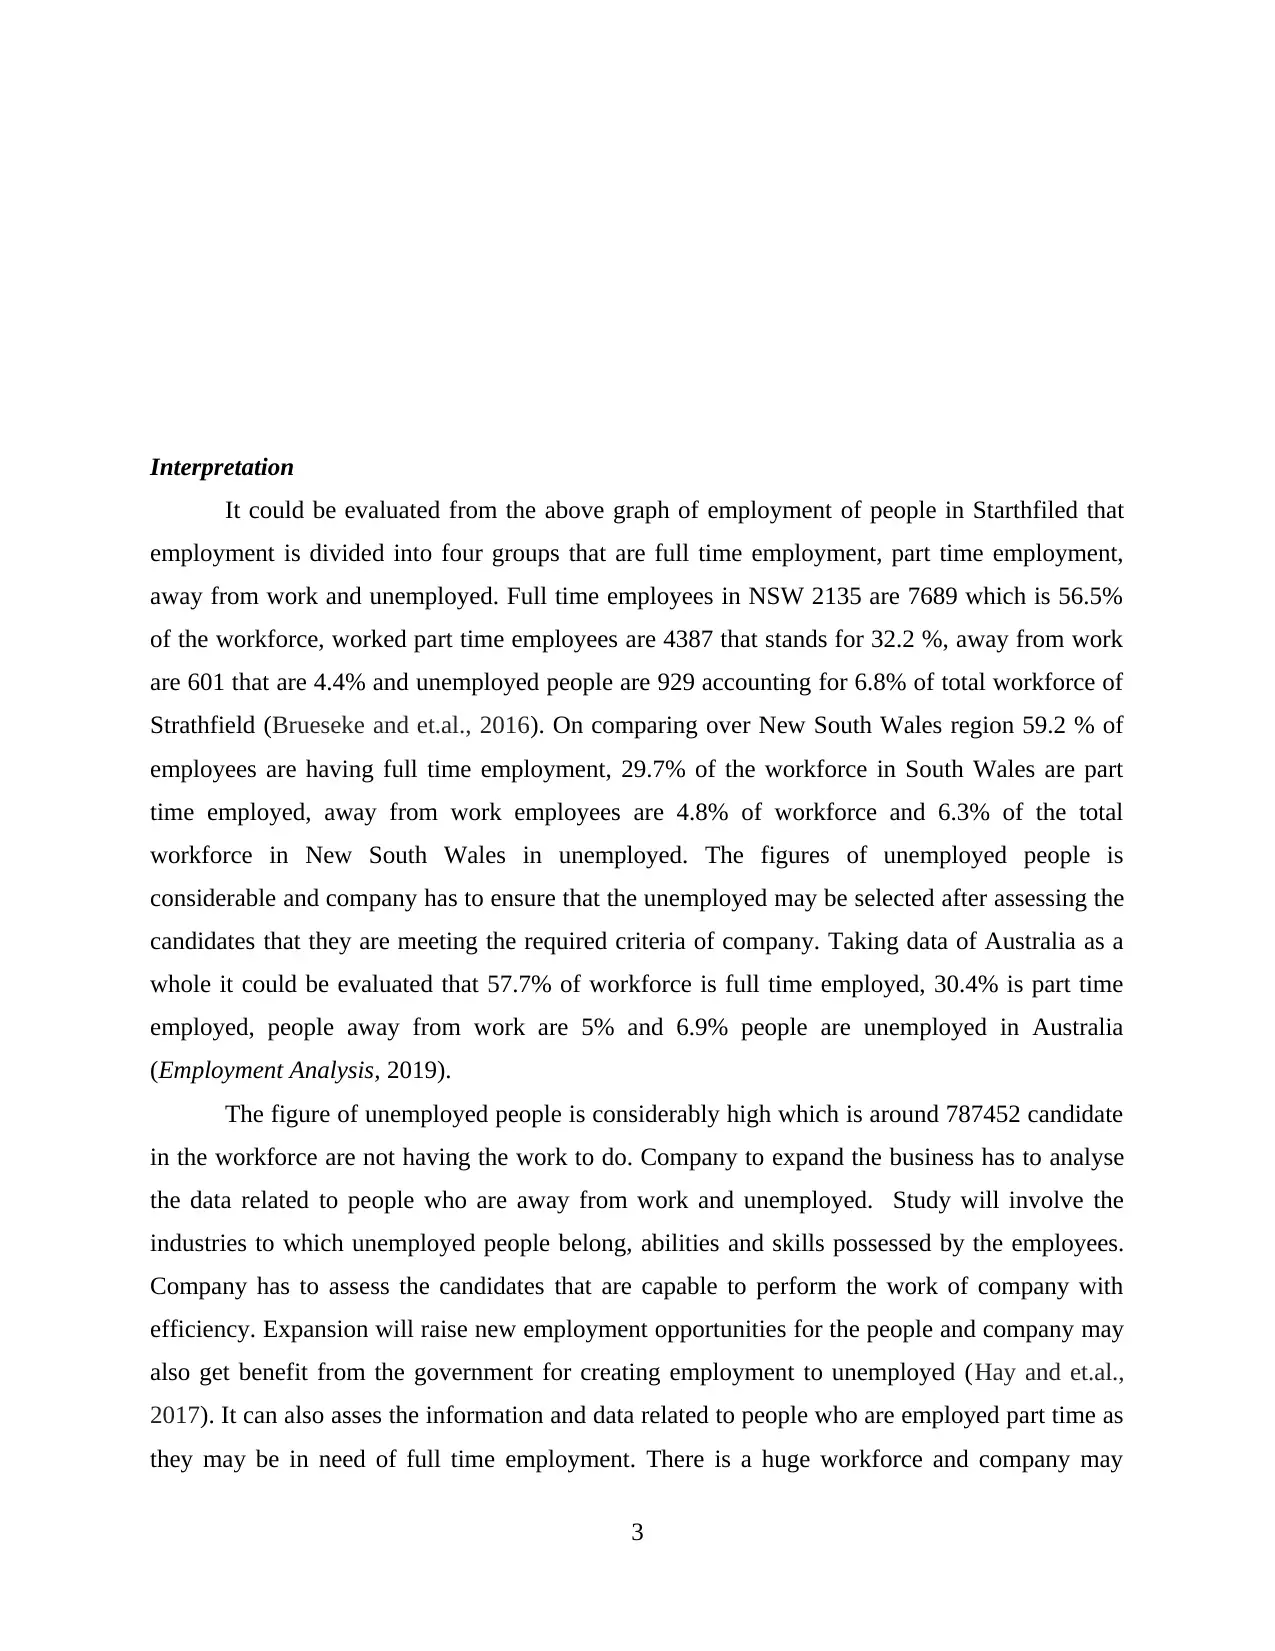
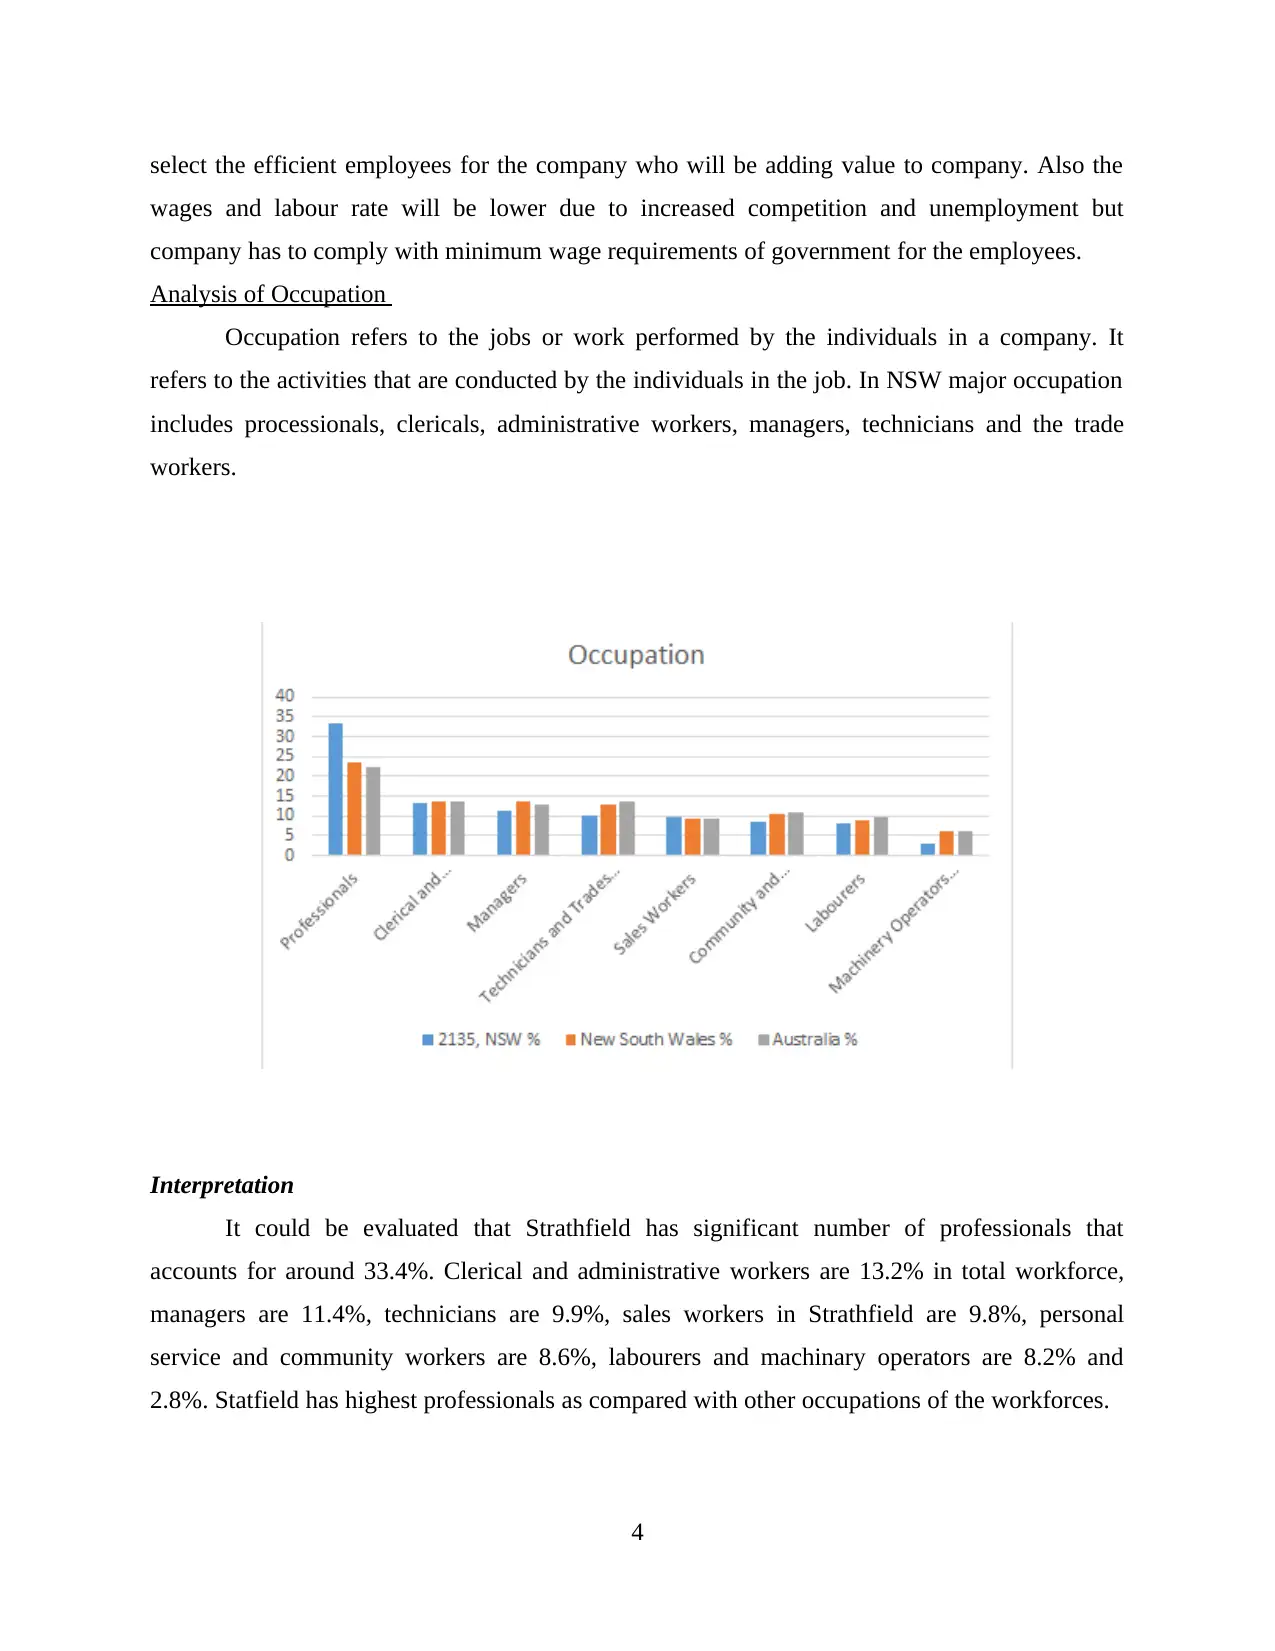
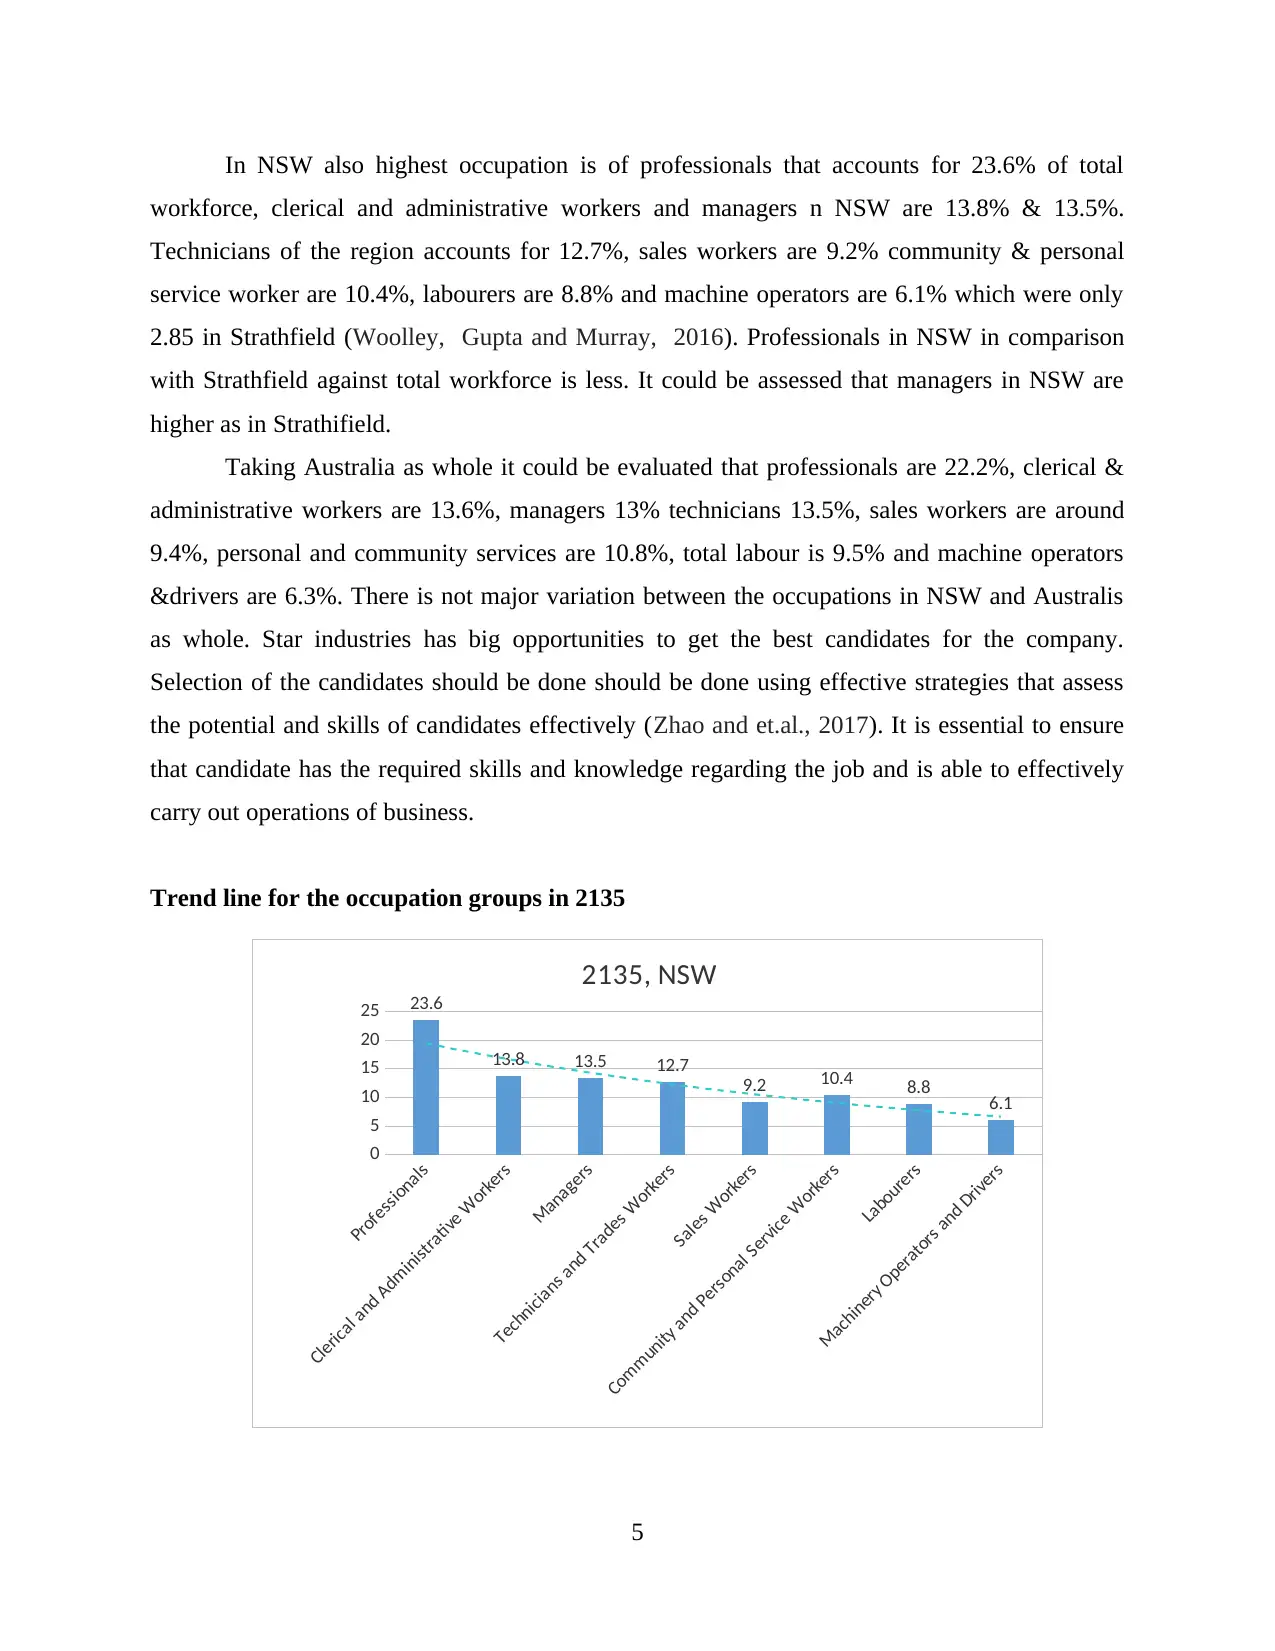
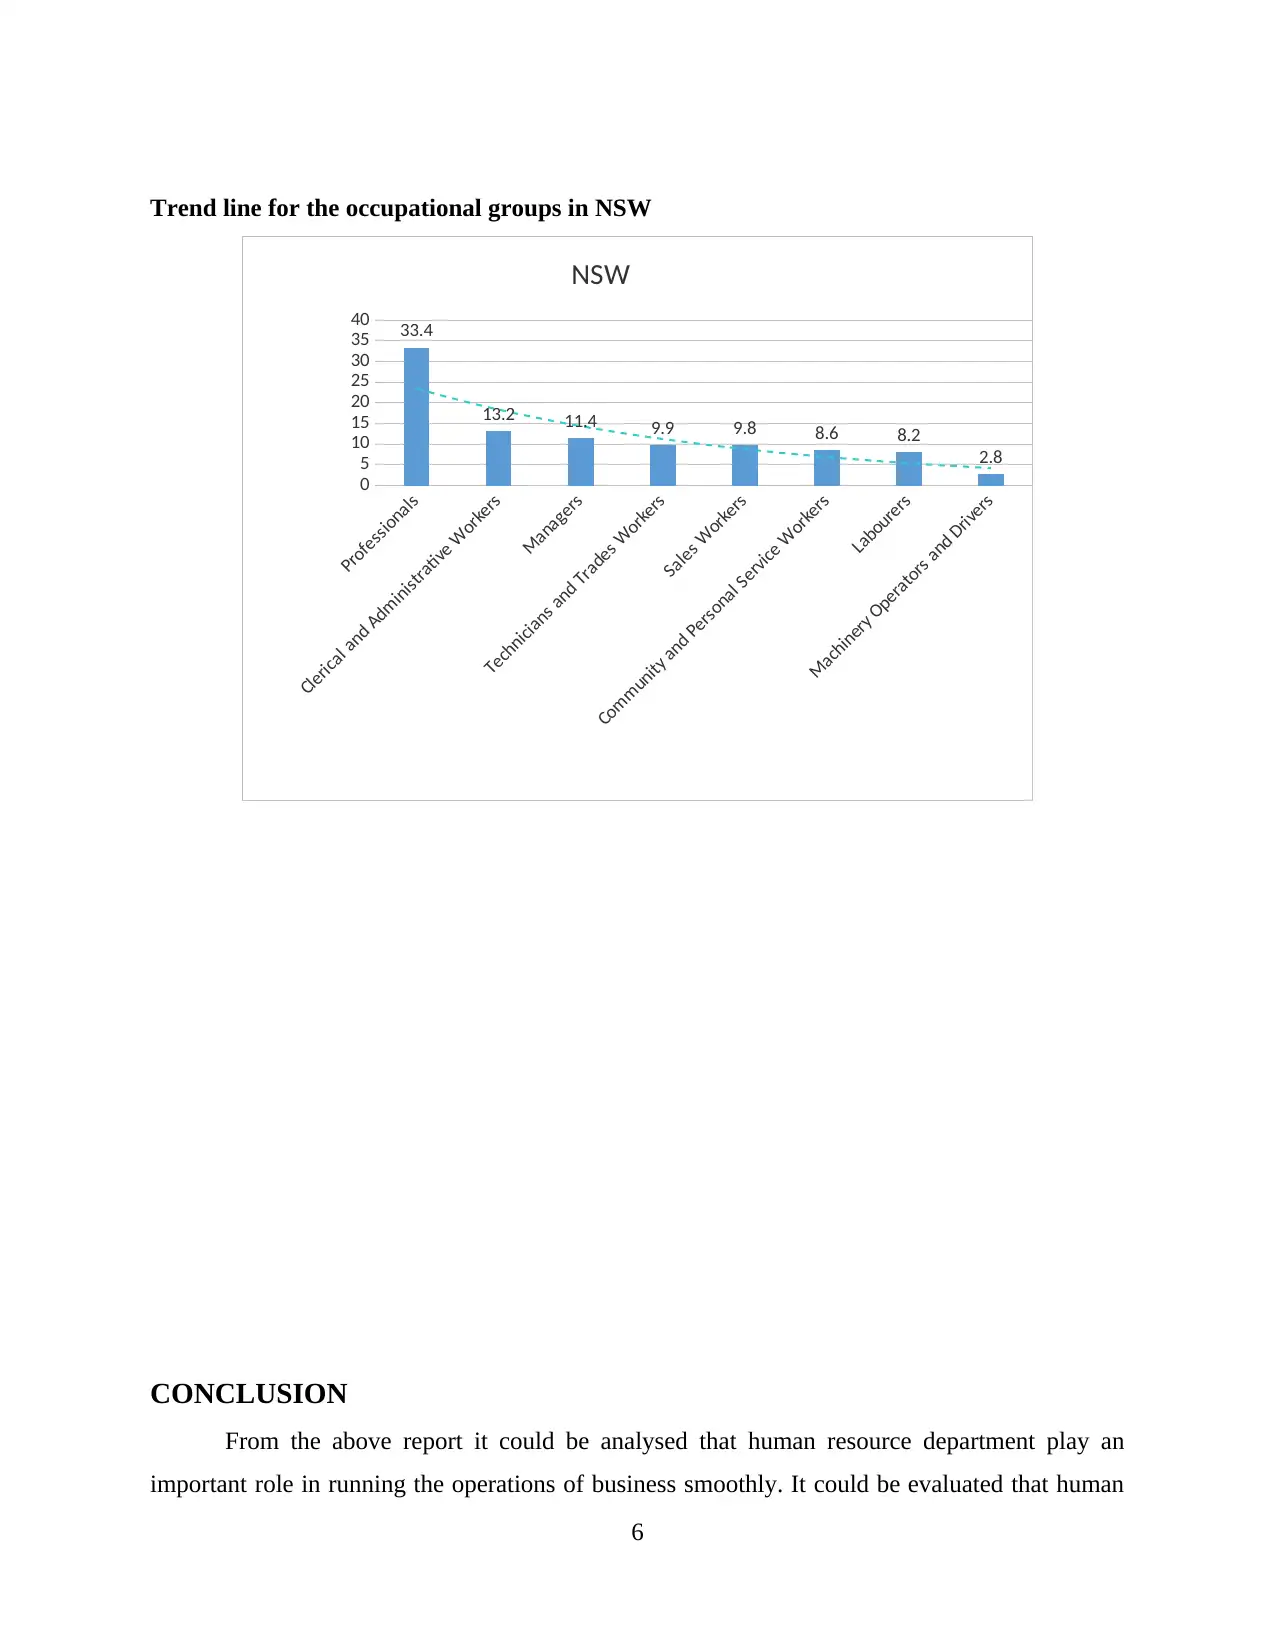
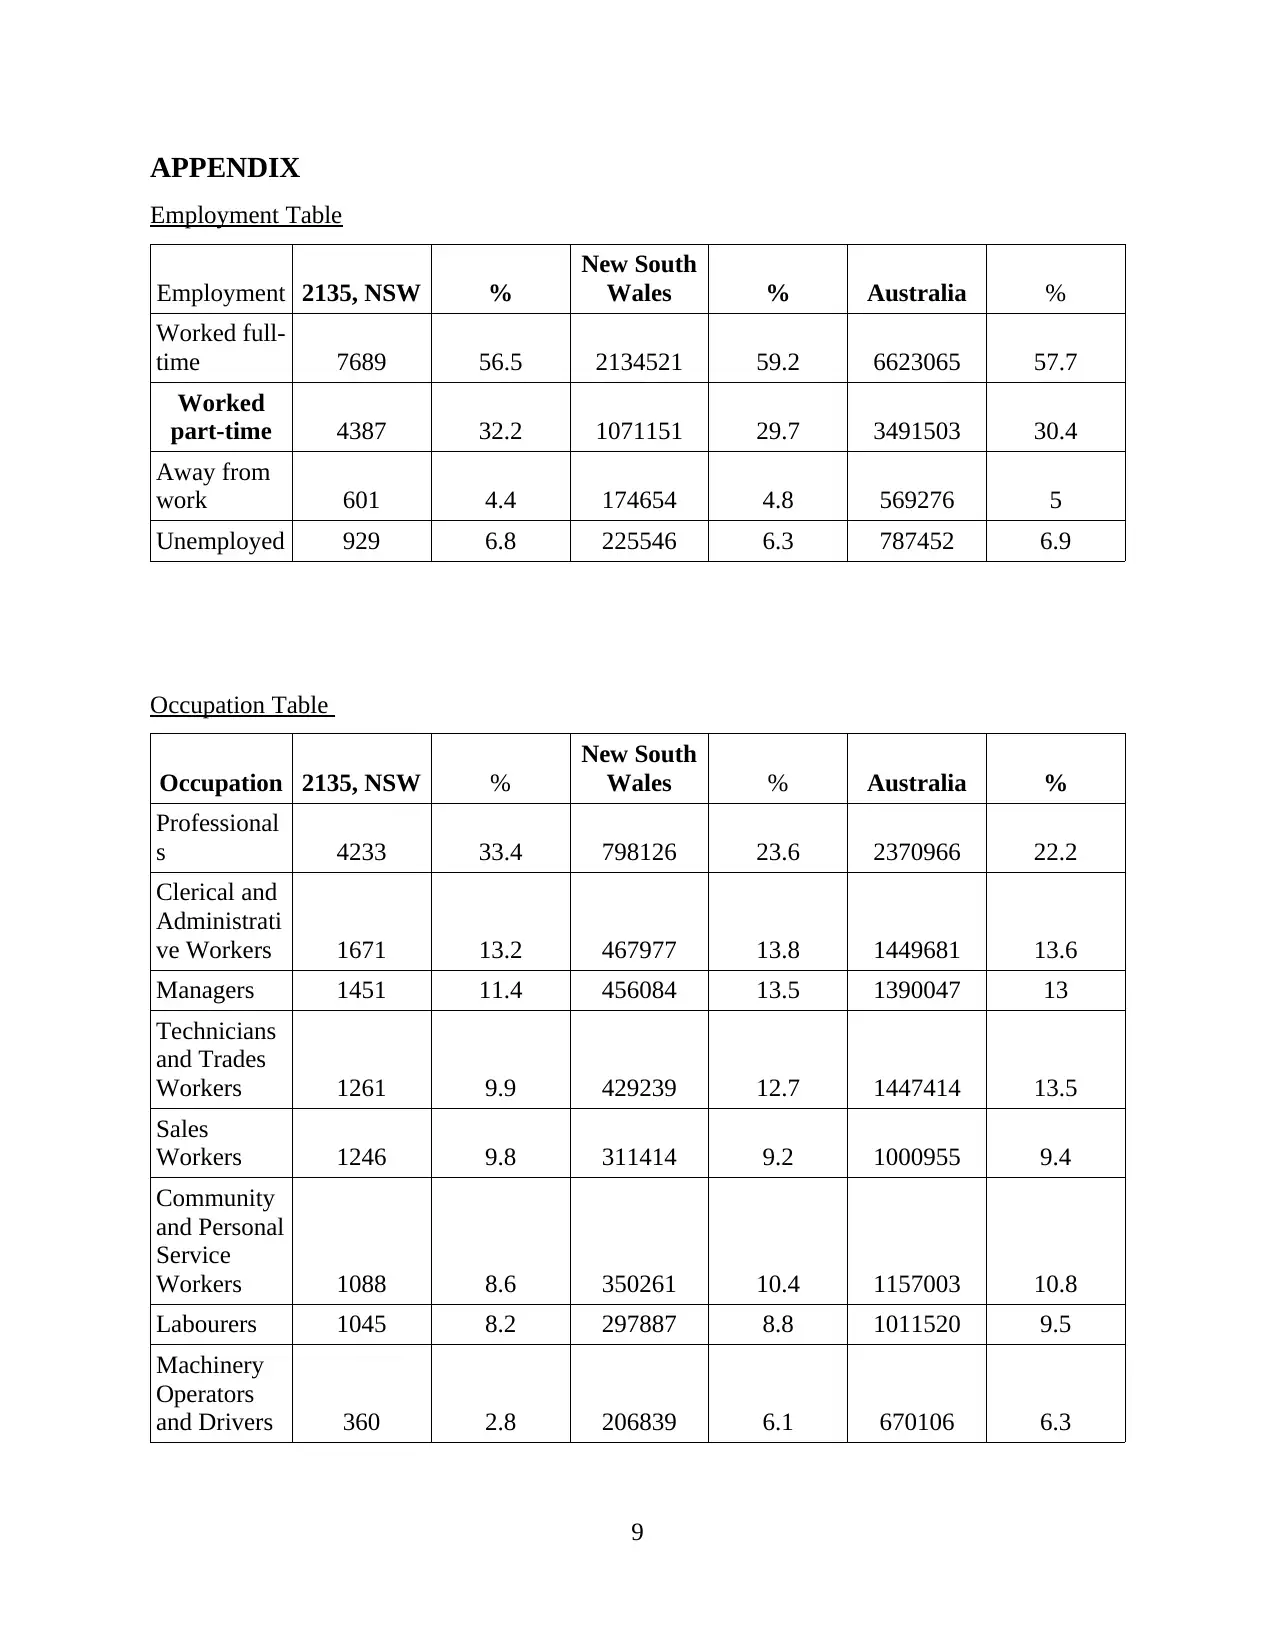
This report, prepared for Star Industries, analyzes workforce data to support a business expansion plan. It begins with an introduction to the responsibilities of HR practitioners, including recruitment, training, and data analysis. The report then delves into the types of workforce data available and the role of IT in analyzing this data. Part 2 focuses on accessing and analyzing data, including employment analysis, which examines full-time, part-time, and unemployment rates in Strathfield, NSW, and Australia. The report also analyzes occupational data, identifying key occupations and comparing them across different regions. The conclusion emphasizes the importance of HR in business operations and the need for effective data analysis to make informed decisions. The report uses data from the Australian Bureau of Statistics and includes tables and graphs to support the analysis, providing insights into workforce demographics and trends relevant to Star Industries' expansion strategy.
Contribute Materials
Your contribution can guide someone’s learning journey. Share your
documents today.

BSBHRM 404- Assessment 2
Secure Best Marks with AI Grader
Need help grading? Try our AI Grader for instant feedback on your assignments.

TABLE OF CONTENTS
INTRODUCTION ..........................................................................................................................1
PART 1............................................................................................................................................1
Responsibilities and roles of HR practitioners.............................................................................1
8 Types of workforce data Human resource professional access and source of data- ................1
Information technology help analyse HR data.............................................................................1
PART 2............................................................................................................................................2
Accessing and Analysing Data ...................................................................................................2
Employment Analysis .................................................................................................................2
Analysis of Occupation ...............................................................................................................3
CONCLUSION ...............................................................................................................................4
REFERENCES................................................................................................................................5

INTRODUCTION
Human resource is responsible for providing the company with required workforce. It has
number of responsibilities such as recruitment & selection, hiring, training, promoting,
remuneration and firing the employees. It ensures that company is available with required
workforce for running the operations of business. Human resources analyses the data and search
for the best candidates for the company that will add value to the business organisation. Present
report is based on Star Industries a manufacturing concern that is planning to expand the
business over five years. Below report provides the analysis of workforce data on population of
the Strathfield.
PART 1
Responsibilities and roles of HR practitioners
Human resource practitioner play essential role in company, they work as recruitment
specialist is accountable for recruiting new individuals to work within company. It includes
scouring new applicants, interviewing, attending work fairs, testing and screening potential
applicants. They may also accountable for handling employee relations, training sessions and
payroll. HR professional role is to find the best workers with relevant skills to fill a required
position.
8 Types of workforce data Human resource professional access and source of data-
Sources-
1. Job training programmes-
2. State unemployment records-
3. Colleges and schools-
4. Real information from job position sites-
5. Government Records
6. Census website of the state our country
7. From the news papers
8. Libraries and career centers
Information technology help analyse HR data
There is significant role of IT in providing the HR department with all the data and information
of their requirement. They could access the information from office without going anywhere to
1

gather data. It provides HR department with different tools and techniques that may help in
analysing the data efficiently. Using IT it could evaluate the detailed information in
understandable forms using graphs and charts that represent the data more appropriately to the
users. Using IT HR can make more effective decisions analysing the data of workforces.
PART 2
Accessing and Analysing Data
Star Industries is proposing to expand the business in the five years and has analysed the
data related to workforce on population of the Strathfield. The data related to workforce has been
gathered from Australian Bureau of Statistics. The data has been analysed for meeting the
demand of workforce of company in Strathfield for meeting the requirements of company.
Employment Analysis
Any company who is planning to expand the business is required to analyse the
workforce requirements for the expansion. Detailed analysis is required to recruit efficient
candidates for the company that will help in the growth of the enterprise and will be adding value
to the company.
2
Worked full-time Worked part-time Away from work Unemployed
0
10
20
30
40
50
60
70
Employment
2135, NSW % New South Wales % Australia %
Secure Best Marks with AI Grader
Need help grading? Try our AI Grader for instant feedback on your assignments.

Interpretation
It could be evaluated from the above graph of employment of people in Starthfiled that
employment is divided into four groups that are full time employment, part time employment,
away from work and unemployed. Full time employees in NSW 2135 are 7689 which is 56.5%
of the workforce, worked part time employees are 4387 that stands for 32.2 %, away from work
are 601 that are 4.4% and unemployed people are 929 accounting for 6.8% of total workforce of
Strathfield (Brueseke and et.al., 2016). On comparing over New South Wales region 59.2 % of
employees are having full time employment, 29.7% of the workforce in South Wales are part
time employed, away from work employees are 4.8% of workforce and 6.3% of the total
workforce in New South Wales in unemployed. The figures of unemployed people is
considerable and company has to ensure that the unemployed may be selected after assessing the
candidates that they are meeting the required criteria of company. Taking data of Australia as a
whole it could be evaluated that 57.7% of workforce is full time employed, 30.4% is part time
employed, people away from work are 5% and 6.9% people are unemployed in Australia
(Employment Analysis, 2019).
The figure of unemployed people is considerably high which is around 787452 candidate
in the workforce are not having the work to do. Company to expand the business has to analyse
the data related to people who are away from work and unemployed. Study will involve the
industries to which unemployed people belong, abilities and skills possessed by the employees.
Company has to assess the candidates that are capable to perform the work of company with
efficiency. Expansion will raise new employment opportunities for the people and company may
also get benefit from the government for creating employment to unemployed (Hay and et.al.,
2017). It can also asses the information and data related to people who are employed part time as
they may be in need of full time employment. There is a huge workforce and company may
3

select the efficient employees for the company who will be adding value to company. Also the
wages and labour rate will be lower due to increased competition and unemployment but
company has to comply with minimum wage requirements of government for the employees.
Analysis of Occupation
Occupation refers to the jobs or work performed by the individuals in a company. It
refers to the activities that are conducted by the individuals in the job. In NSW major occupation
includes processionals, clericals, administrative workers, managers, technicians and the trade
workers.
Interpretation
It could be evaluated that Strathfield has significant number of professionals that
accounts for around 33.4%. Clerical and administrative workers are 13.2% in total workforce,
managers are 11.4%, technicians are 9.9%, sales workers in Strathfield are 9.8%, personal
service and community workers are 8.6%, labourers and machinary operators are 8.2% and
2.8%. Statfield has highest professionals as compared with other occupations of the workforces.
4

In NSW also highest occupation is of professionals that accounts for 23.6% of total
workforce, clerical and administrative workers and managers n NSW are 13.8% & 13.5%.
Technicians of the region accounts for 12.7%, sales workers are 9.2% community & personal
service worker are 10.4%, labourers are 8.8% and machine operators are 6.1% which were only
2.85 in Strathfield (Woolley, Gupta and Murray, 2016). Professionals in NSW in comparison
with Strathfield against total workforce is less. It could be assessed that managers in NSW are
higher as in Strathifield.
Taking Australia as whole it could be evaluated that professionals are 22.2%, clerical &
administrative workers are 13.6%, managers 13% technicians 13.5%, sales workers are around
9.4%, personal and community services are 10.8%, total labour is 9.5% and machine operators
&drivers are 6.3%. There is not major variation between the occupations in NSW and Australis
as whole. Star industries has big opportunities to get the best candidates for the company.
Selection of the candidates should be done should be done using effective strategies that assess
the potential and skills of candidates effectively (Zhao and et.al., 2017). It is essential to ensure
that candidate has the required skills and knowledge regarding the job and is able to effectively
carry out operations of business.
Trend line for the occupation groups in 2135
5
Professionals
Clerical and Administrative Workers
Managers
Technicians and Trades Workers
Sales Workers
Community and Personal Service Workers
Labourers
Machinery Operators and Drivers
0
5
10
15
20
25 23.6
13.8 13.5 12.7
9.2 10.4 8.8 6.1
2135, NSW
Paraphrase This Document
Need a fresh take? Get an instant paraphrase of this document with our AI Paraphraser

Trend line for the occupational groups in NSW
CONCLUSION
From the above report it could be analysed that human resource department play an
important role in running the operations of business smoothly. It could be evaluated that human
6
Professionals
Clerical and Administrative Workers
Managers
Technicians and Trades Workers
Sales Workers
Community and Personal Service Workers
Labourers
Machinery Operators and Drivers
0
5
10
15
20
25
30
35
40 33.4
13.2 11.4 9.9 9.8 8.6 8.2
2.8
NSW

resources has to assess the data from different sources and assess the opportunities and threats
associated with the business. It ensures that best employees for the company are recruited after
carrying out proper selection process.
7
associated with the business. It ensures that best employees for the company are recruited after
carrying out proper selection process.
7

REFERENCES
Books and Journals
Brueseke, T., A.,and et.al., 2016. Workforce analysis of female pelvic medicine and
reconstructive surgery, 2015 to 2045. Female pelvic medicine & reconstructive
surgery. 22(5). pp.385-389.
Hay, M., and et.al., 2017. Selecting for a sustainable workforce to meet the future healthcare
needs of rural communities in Australia. Advances in Health Sciences Education. 22(2).
pp.533-551.
Woolley, T., Gupta, T.S. and Murray, R., 2016. James Cook University's decentralised medical
training model: an important part of the rural workforce pipeline in northern Australia.
Zhao, Y., and et.al., 2017. Long-term trends in supply and sustainability of the health workforce
in remote Aboriginal communities in the Northern Territory of Australia. BMC health
services research. 17(1). pp.1-10.
Online
Employment Analysis. 2019. [Online]. Available through :
<https://quickstats.censusdata.abs.gov.au/census_services/getproduct/census/2016/quickstat/
POA2135?opendocument>.
8
Secure Best Marks with AI Grader
Need help grading? Try our AI Grader for instant feedback on your assignments.

APPENDIX
Employment Table
Employment 2135, NSW %
New South
Wales % Australia %
Worked full-
time 7689 56.5 2134521 59.2 6623065 57.7
Worked
part-time 4387 32.2 1071151 29.7 3491503 30.4
Away from
work 601 4.4 174654 4.8 569276 5
Unemployed 929 6.8 225546 6.3 787452 6.9
Occupation Table
Occupation 2135, NSW %
New South
Wales % Australia %
Professional
s 4233 33.4 798126 23.6 2370966 22.2
Clerical and
Administrati
ve Workers 1671 13.2 467977 13.8 1449681 13.6
Managers 1451 11.4 456084 13.5 1390047 13
Technicians
and Trades
Workers 1261 9.9 429239 12.7 1447414 13.5
Sales
Workers 1246 9.8 311414 9.2 1000955 9.4
Community
and Personal
Service
Workers 1088 8.6 350261 10.4 1157003 10.8
Labourers 1045 8.2 297887 8.8 1011520 9.5
Machinery
Operators
and Drivers 360 2.8 206839 6.1 670106 6.3
9

10
1 out of 12
Related Documents

Your All-in-One AI-Powered Toolkit for Academic Success.
 +13062052269
info@desklib.com
Available 24*7 on WhatsApp / Email
Unlock your academic potential
© 2024  |  Zucol Services PVT LTD  |  All rights reserved.