BUSN20019: Project on Working Capital and Profitability
VerifiedAdded on 2020/09/27
|18
|4777
|378
Project
AI Summary
This project report investigates the relationship between working capital management and profitability in ASX-listed construction companies in Australia. The study utilizes the cash conversion cycle (CCC) and its components (Average Collection Period, Average Payable Period, and Inventory Turnover) to measure working capital, with Return on Total Assets (ROTA) as the profitability measure. Secondary data from four ASX-listed construction firms were analyzed using Pearson’s Correlation and Linear Regression. The results reveal a negative relationship between working capital and profitability, although the statistical significance is not established. The research highlights a statistically significant negative correlation between the average collection period and profitability, suggesting that firms should focus on reducing this period to enhance profitability. The report includes an introduction, literature review, methodology, findings, discussion, and conclusion, along with limitations and suggestions for future research.
Assignment 2
BUSN20019: Professional Project
Term 2, 2018
A Project Report
On
Working Capital Management and its Impact on Profitability:
Evidence from ASX listed Construction Firms
BUSN20019: Professional Project
Term 2, 2018
A Project Report
On
Working Capital Management and its Impact on Profitability:
Evidence from ASX listed Construction Firms
Paraphrase This Document
Need a fresh take? Get an instant paraphrase of this document with our AI Paraphraser
Executive Summary
This research paper examine the relationship between working capital management and
profitability in ASX listed construction companies in Australia. Working capital management
has been measured using cash conversion cycle (CCC) and along with it the other
components such as Average Collection Period, Average Payable Period and Inventory
Turnover in days are analysed. The return on total assets (ROTA) is used as a measure of
profitability and is considered as a dependent variable.
To examine the statistical significance between dependent and independent variables,
Pearson’s Correlation and Linear Regression analysis were performed on secondary data
collected from sample of 4 ASX listed construction companies. The results indicate that
working capital and profitability has no statistical significance however both have negative
relationship. The research shows that average collection period is statistically negatively
significance to the profitability. So, in order to increase the profitability, the firms should
focus more on reducing the average collection period.
1 | P a g e
Contents
1.0 Introduction.....................................................................................................................3
1.1 Problem Statement.......................................................................................................3
1.2 Research Aim, Objectives and Research Questions....................................................4
2. Conceptual Framework..........................................................................................................4
2.1 Working Capital Management.........................................................................................4
2,2 Profitability.......................................................................................................................5
3.0 Literature Review............................................................................................................5
4.0 Methodology........................................................................................................................8
4.1 Data Collection.................................................................................................................8
4.2 Data Analysis...............................................................................................................8
5.0 Findings and analysis...........................................................................................................9
5.1 Descriptive Statistics........................................................................................................9
5.2 Bivariate Correlations Results........................................................................................10
5.3 Regression Analysis Results...........................................................................................11
6.0 Discussion..........................................................................................................................12
7.0 Conclusion..........................................................................................................................13
8.0 Limitations.........................................................................................................................13
9.0 Future research...................................................................................................................14
References................................................................................................................................15
2 | P a g e
⊘ This is a preview!⊘
Do you want full access?
Subscribe today to unlock all pages.
Trusted by 1+ million students worldwide
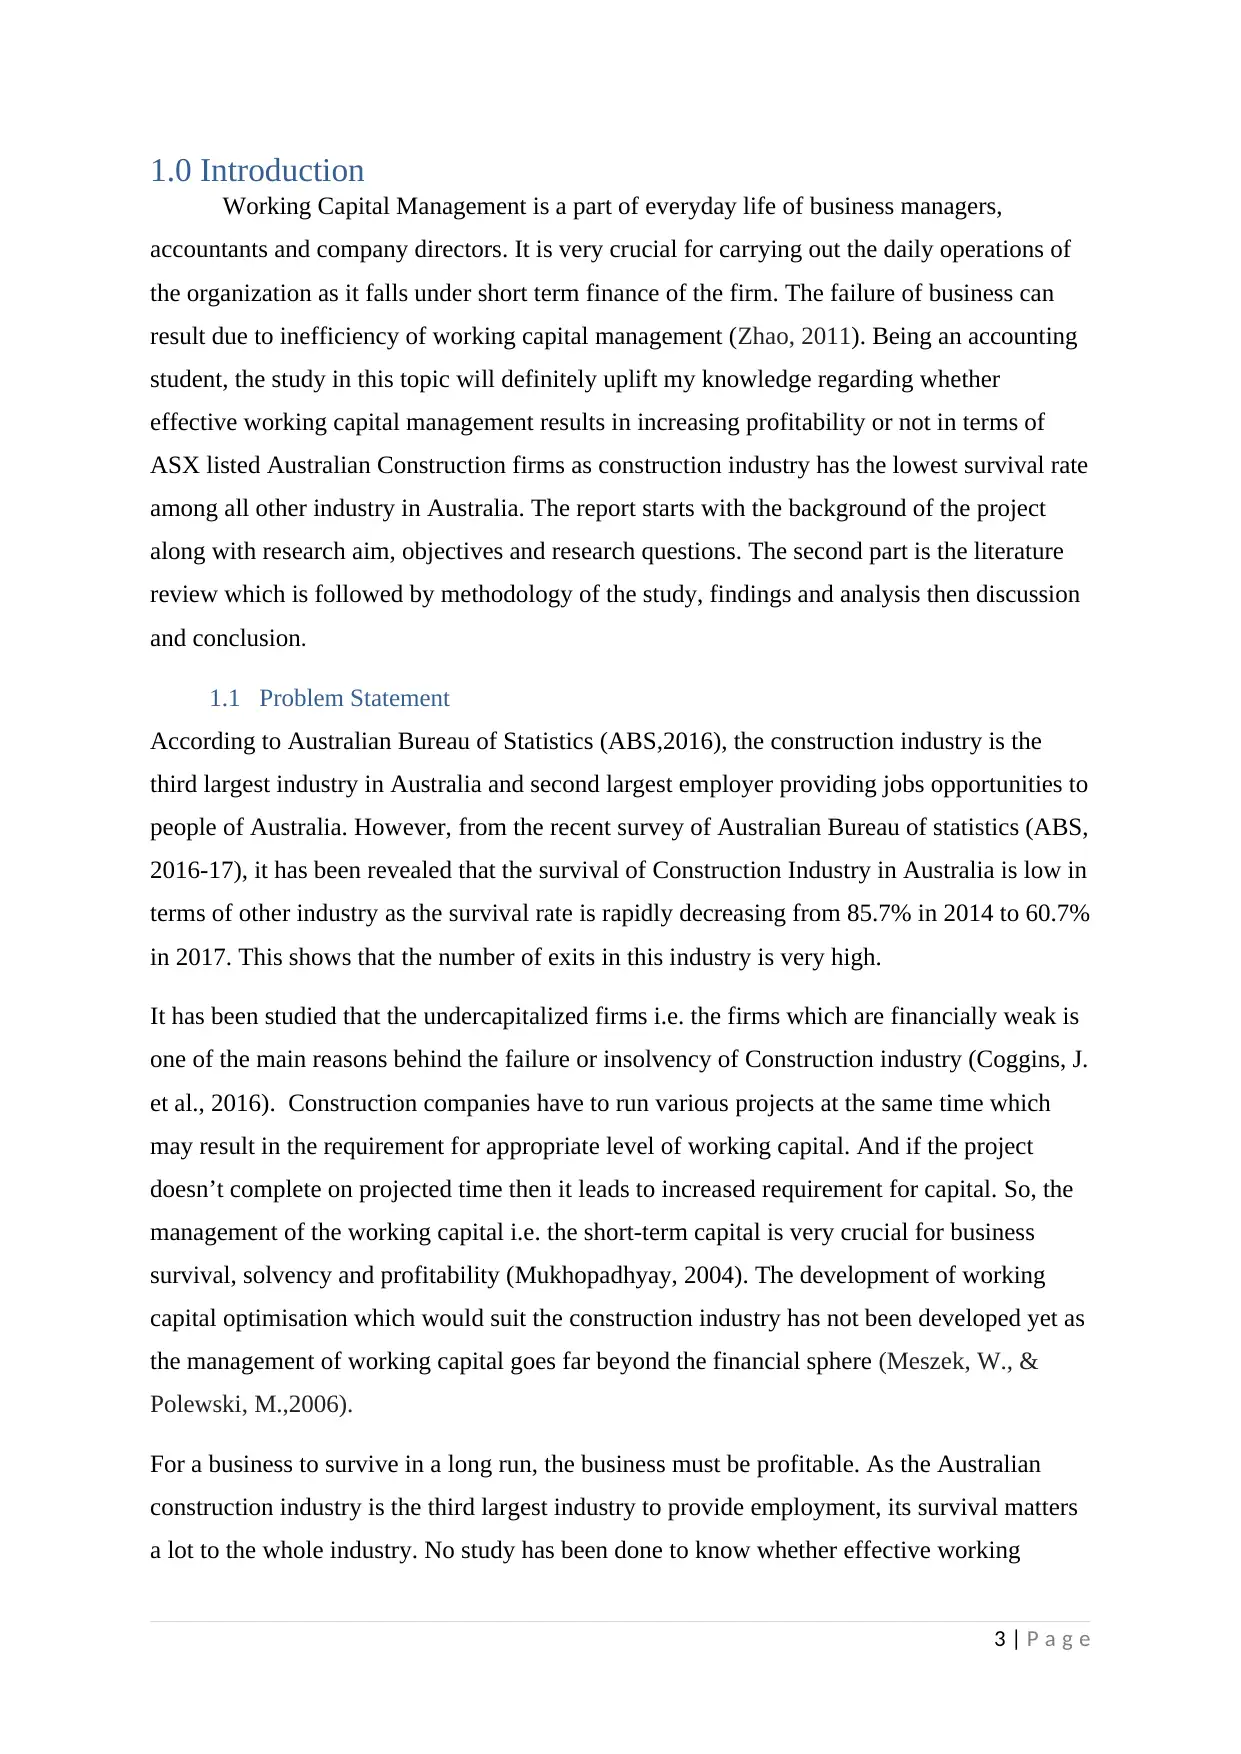
1.0 Introduction
Working Capital Management is a part of everyday life of business managers,
accountants and company directors. It is very crucial for carrying out the daily operations of
the organization as it falls under short term finance of the firm. The failure of business can
result due to inefficiency of working capital management (Zhao, 2011). Being an accounting
student, the study in this topic will definitely uplift my knowledge regarding whether
effective working capital management results in increasing profitability or not in terms of
ASX listed Australian Construction firms as construction industry has the lowest survival rate
among all other industry in Australia. The report starts with the background of the project
along with research aim, objectives and research questions. The second part is the literature
review which is followed by methodology of the study, findings and analysis then discussion
and conclusion.
1.1 Problem Statement
According to Australian Bureau of Statistics (ABS,2016), the construction industry is the
third largest industry in Australia and second largest employer providing jobs opportunities to
people of Australia. However, from the recent survey of Australian Bureau of statistics (ABS,
2016-17), it has been revealed that the survival of Construction Industry in Australia is low in
terms of other industry as the survival rate is rapidly decreasing from 85.7% in 2014 to 60.7%
in 2017. This shows that the number of exits in this industry is very high.
It has been studied that the undercapitalized firms i.e. the firms which are financially weak is
one of the main reasons behind the failure or insolvency of Construction industry (Coggins, J.
et al., 2016). Construction companies have to run various projects at the same time which
may result in the requirement for appropriate level of working capital. And if the project
doesn’t complete on projected time then it leads to increased requirement for capital. So, the
management of the working capital i.e. the short-term capital is very crucial for business
survival, solvency and profitability (Mukhopadhyay, 2004). The development of working
capital optimisation which would suit the construction industry has not been developed yet as
the management of working capital goes far beyond the financial sphere (Meszek, W., &
Polewski, M.,2006).
For a business to survive in a long run, the business must be profitable. As the Australian
construction industry is the third largest industry to provide employment, its survival matters
a lot to the whole industry. No study has been done to know whether effective working
3 | P a g e
Paraphrase This Document
Need a fresh take? Get an instant paraphrase of this document with our AI Paraphraser
capital management will lead to increased profitability of ASX listed Construction
Companies.
1.2 Research Aim, Objectives and Research Questions
The aim of this research is to examine the relationship between working capital
management and profitability of ASX listed construction firms.
Some specific research objectives are as follows:
a) To know whether there is significant relationship between working capital
management and firm’s profitability
b) To know how working capital components such as cash conversion cycle
(CCC), average collection policy (ACP), average receivable period (ARP),
Inventory Turnover in Days (ITO) affects profitability.
The research questions to achieve the aim and objectives are:
(a) Is there any significant relationship between working capital management
and profitability in ASX listed Construction Companies?
(b) Does effective management of the working capital result in increased
profitability in ASX listed Construction Companies?
2. Conceptual Framework
2.1 Working Capital Management
Working Capital Management is one of the most important aspect of financial
management a business organization without which the company cannot operate
(Deloof, 2013). The company’s investment on short term assets such as cash,
account receivables, inventories and other short-term assets comprises the
working capital. In other words, it is the management of current assets and
current liabilities so as to maximize the return on assets efficiently and effectively
(Makori, 2013). Many researchers suggest Cash Conversion Cycle (CCC) as the
best measure for the measurement of working capital (Baños et al., 2012). As per
Nobanee et al. (2011), the total time it takes for a company to convert the cash it
has invested in its daily operations to cash received from final goods and services
is known as cash conversion cycle (CCC). CCC is calculated as:
CCC= Average collection period (ACP)+Inventory Turnover Days (ITD)-
Average Payable Period (APP)
4 | P a g e
All the above variables are the independent variables for the study.
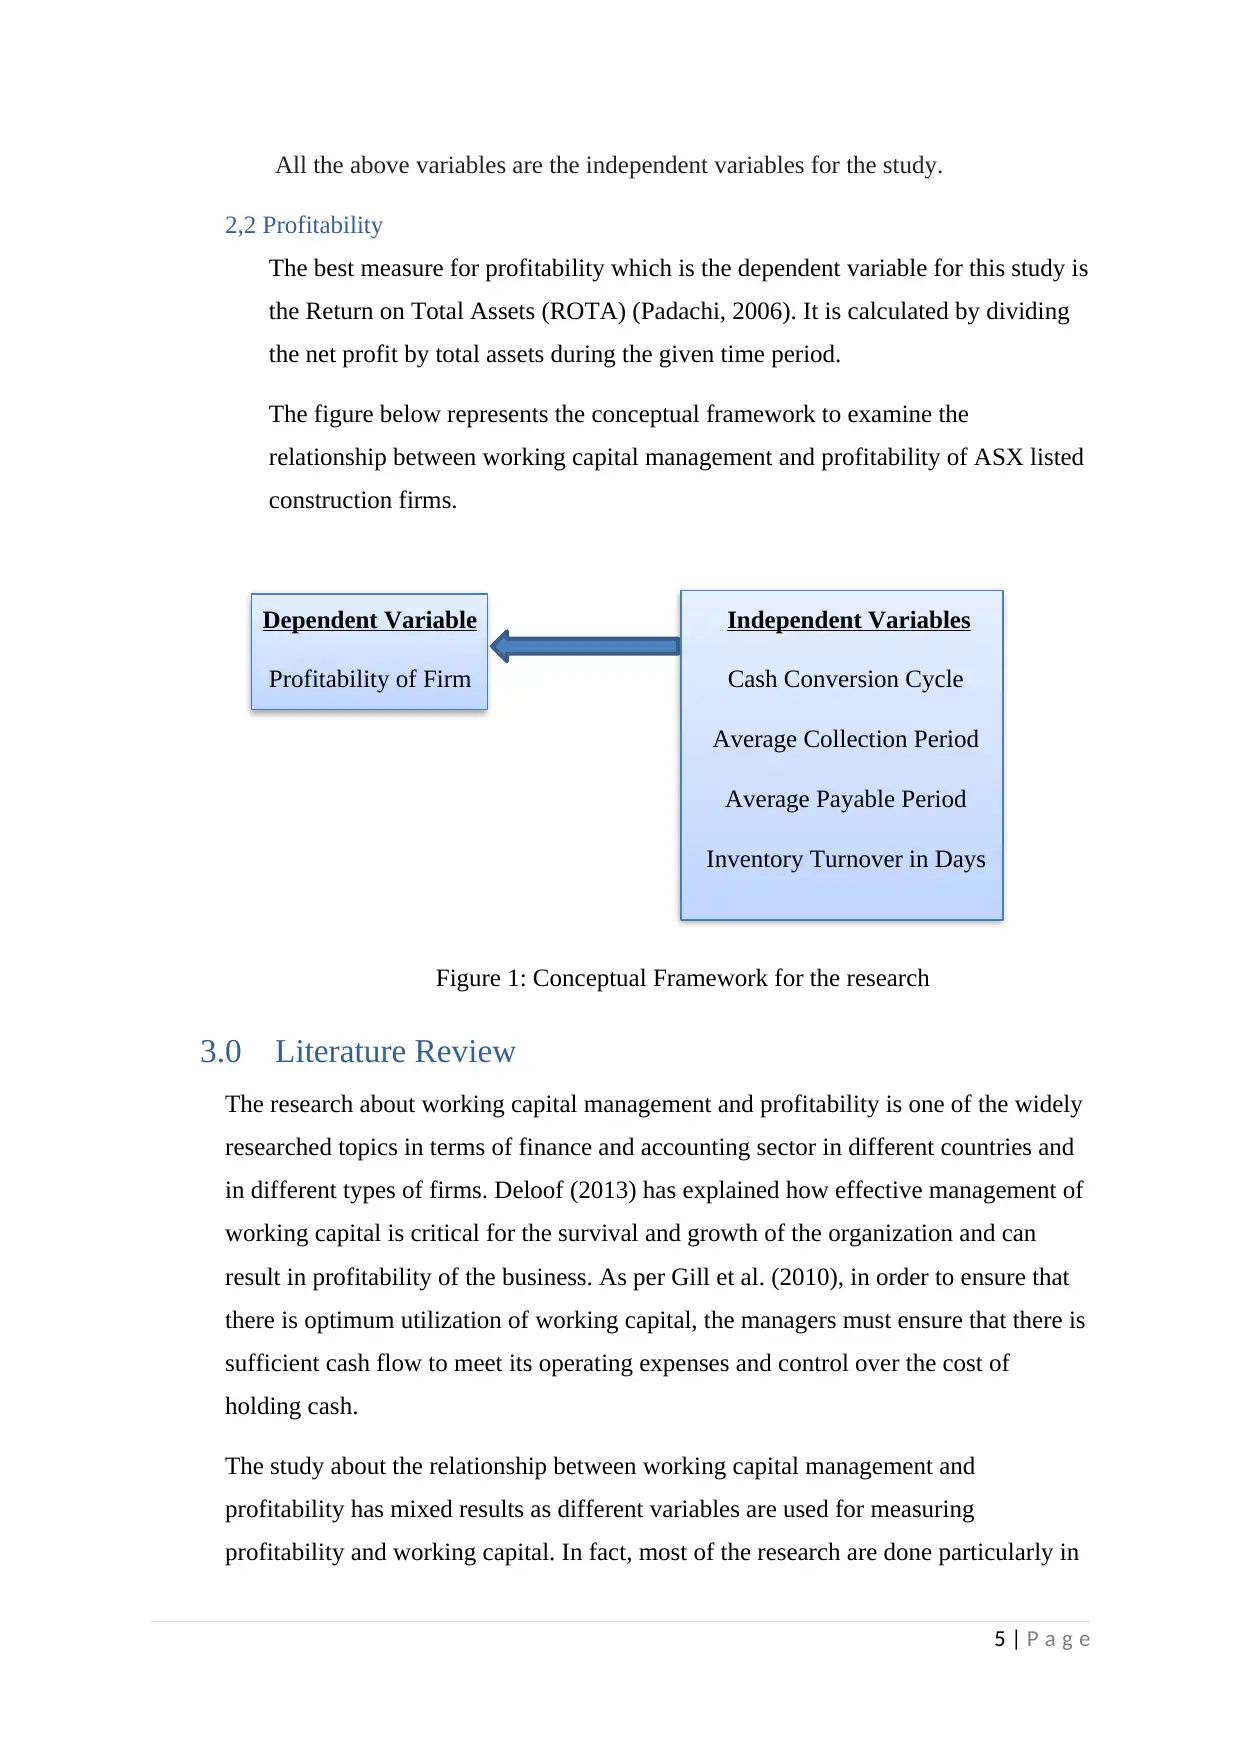
2,2 Profitability
The best measure for profitability which is the dependent variable for this study is
the Return on Total Assets (ROTA) (Padachi, 2006). It is calculated by dividing
the net profit by total assets during the given time period.
The figure below represents the conceptual framework to examine the
relationship between working capital management and profitability of ASX listed
construction firms.
Dependent Variable Independent Variables
Profitability of Firm Cash Conversion Cycle
Average Collection Period
Average Payable Period
Inventory Turnover in Days
Figure 1: Conceptual Framework for the research
3.0 Literature Review
The research about working capital management and profitability is one of the widely
researched topics in terms of finance and accounting sector in different countries and
in different types of firms. Deloof (2013) has explained how effective management of
working capital is critical for the survival and growth of the organization and can
result in profitability of the business. As per Gill et al. (2010), in order to ensure that
there is optimum utilization of working capital, the managers must ensure that there is
sufficient cash flow to meet its operating expenses and control over the cost of
holding cash.
The study about the relationship between working capital management and
profitability has mixed results as different variables are used for measuring
profitability and working capital. In fact, most of the research are done particularly in
5 | P a g e
⊘ This is a preview!⊘
Do you want full access?
Subscribe today to unlock all pages.
Trusted by 1+ million students worldwide
manufacturing firms only and the methodology for the research between those two
variables are also different. Therefore, major gaps have been identified in the section
below so as to be crystal clear about the main aims and objectives of this research.
The effective management of the working capital is possible by considering all the
components of working capital and they are accounts receivable, accounts payable
and inventory (Karaduman et al. 2011). Besides, efficient working capital can be
achieved if CCC is low such that the business can easily convert its investment to
cash received from selling goods and services (Raheman & Nasr, 2007).
According to Bauer (2007), the shorter Average Collection Period (ACP) meaning the
timely receipts from suppliers will improve the firm’s liquidity leading to increased
financial performance. On one hand, the increase in account receivable period through
credit sales will risk the business and on the other hand the decrease in ACP will
effect relationship with suppliers (Moran, 2011). In terms of Inventory turnover
period, holding inventory for a long time can lead to increased carrying costs and
holding up of cash (Kroes & Manikas, 2014). And lower inventory levels can reduce
the sales opportunity a business may have. So, optimal management of inventory is
vital for keeping up the sales. Furthermore, the lesser the average payable period, the
more cash will be available on hold resulting in increased liquidity. However, due to
this the firm can miss early discounts and suppliers may have negative impacts on the
business (Fawcett et al., 2010). Therefore, the management of all these working
capital components is very important for business success and will benefit the
business.
Lazaridis & Tryfonidis (2006) researched about relationship between the corporate
profitability and working capital management of Athens Stock Exchange (ASE) listed
131 firms and found out that there is statistically significant relationship between
them. Here, the profitability was measured through gross operating profit. In this
study, they proved that there exist negative relationship between profitability and cash
conversion cycle. In addition to that, it was concluded that the less profitable firms
will try to reduce their cash gap by decreasing their accounts receivable as both
accounts receivables and profitability had negative relationship.
In the research conducted in United States by Gill et al. (2010) among 88 firms listed
on New York Exchange (NYE) from 2005 to 2007, they found that there is negative
6 | P a g e
Paraphrase This Document
Need a fresh take? Get an instant paraphrase of this document with our AI Paraphraser
relationship between account receivable period and profitability. The profitability
which was measured through gross operating profit had a positive relationship
between cash conversion cycle.
There has been some contradicting findings in relation to the working capital
components and profitability. A study on 263 non-financial firms listed on Bombay
Stock Exchange for the period 2000 to 2008 exhibits the positive relationship between
working capital management and profitability like previous studies done by many
researchers revealed. However, average days in receivable had positive relationship
with the profitability unlike previous studies in working capital and profitability
(Sharma & Kumar, 2011). Padachi (2006) study of 58 small manufacturing firms in
Mauritius stated that there was positive relationship between the profitability and
CCC where profitability was measured by Return on Assets (ROA). Kroes & Manikas
(2014), revealed that in terms of large manufacturing US firms, there was
insignificant relationship between working capital measured through CCC and
profitability.
All the above reviews shows that different researchers has come up with different
results in relation to the working capital, its component and profitability. On top of
that, there is no study on the Australian Firms regarding working capital management
and profitability. In terms of Australia, assets structure, growth and profitability were
revealed as determinants of capital structure and financing of small and medium
enterprises (Cassar, 2003). But no research was conducted on ASX listed firms in
relation to working capital management and profitability. So, this research aims to
know the relationship between working capital and profitability of ASX listed
construction firms as the construction industry is now facing survival difficulty.
The hypothesis developed to conduct the research are:
H0: There is significant relationship between working capital management and
profitability
H1: There is non-significant relationship between working capital management and
profitability.
7 | P a g e
4.0 Methodology
4.1 Data Collection
The data for this research was collected from all the secondary sources. The statistics
about the construction industry was collected from Australian Bureau of Statistics
website: http://www.abs.gov.au/AUSSTATS/abs@.nsf/DetailsPage/8165.0Jun
%202013%20to%20Jun%202017?OpenDocument
The website of ASX (https://www.asx.com.au) and Ibis World (accessed from CQU
university’s computer) (https://www.ibisworld.com.au/) was used to explore more
about the selected construction companies in Australia. The annual report of the
selected 4 construction firms available from the respective company’s website for 12
years period i.e. from 2005-2017 was used. At first all the detail about the net profit,
total assets, opening and ending inventory, opening and ending account receivable,
opening and ending account payable, costs of sale, sales revenue were derived from
their financial statements. Then, Return on Assets (ROA), Average Collection Period
(ACP), Inventory Turnover in days (ITO), Average Payable Period (APP) and Cash
conversion Cycle (CCC) is calculated using their respective formulas in an excel
sheet. A total of 48 observations was formed and analysed.
4.2 Data Analysis
To find the answer to the research questions, quantitative data analysis method
was used where all the data related to the dependent variable (ROTA) and
independent variables (CCC, ACP, ITO in days, APP) were analysed. At first
descriptive analysis was done to know about the relevant phenomena of cash
conversion cycle (CCC) and other variables in an SPSS software (Raheman,
2007). Then, analysis is done using Pearson’s Bivariate Correlation to know
degree of association between variables and then linear regression analysis is done
8 | P a g e
⊘ This is a preview!⊘
Do you want full access?
Subscribe today to unlock all pages.
Trusted by 1+ million students worldwide
5.0 Findings and analysis
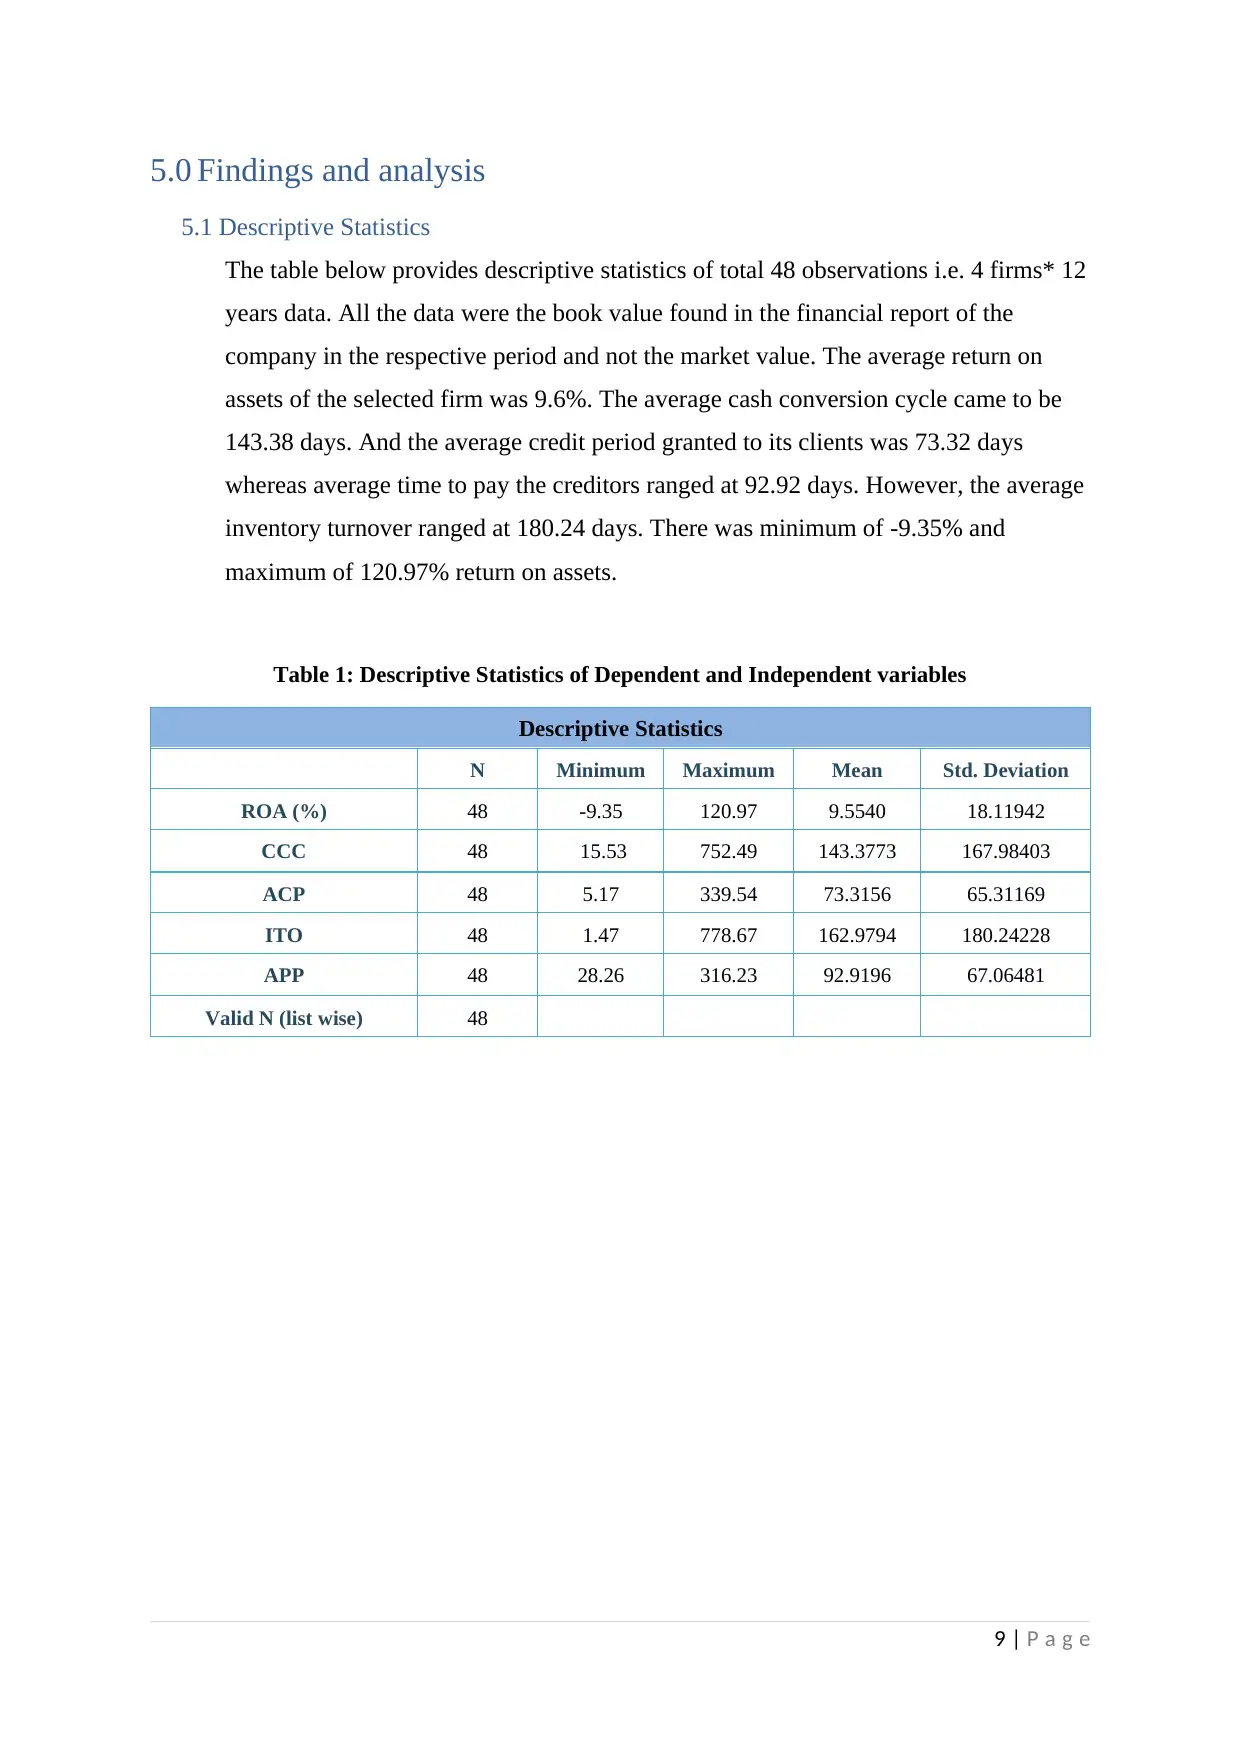
5.1 Descriptive Statistics
The table below provides descriptive statistics of total 48 observations i.e. 4 firms* 12
years data. All the data were the book value found in the financial report of the
company in the respective period and not the market value. The average return on
assets of the selected firm was 9.6%. The average cash conversion cycle came to be
143.38 days. And the average credit period granted to its clients was 73.32 days
whereas average time to pay the creditors ranged at 92.92 days. However, the average
inventory turnover ranged at 180.24 days. There was minimum of -9.35% and
maximum of 120.97% return on assets.
Table 1: Descriptive Statistics of Dependent and Independent variables
Descriptive Statistics
N Minimum Maximum Mean Std. Deviation
ROA (%) 48 -9.35 120.97 9.5540 18.11942
CCC 48 15.53 752.49 143.3773 167.98403
ACP 48 5.17 339.54 73.3156 65.31169
ITO 48 1.47 778.67 162.9794 180.24228
APP 48 28.26 316.23 92.9196 67.06481
Valid N (list wise) 48
9 | P a g e
Paraphrase This Document
Need a fresh take? Get an instant paraphrase of this document with our AI Paraphraser
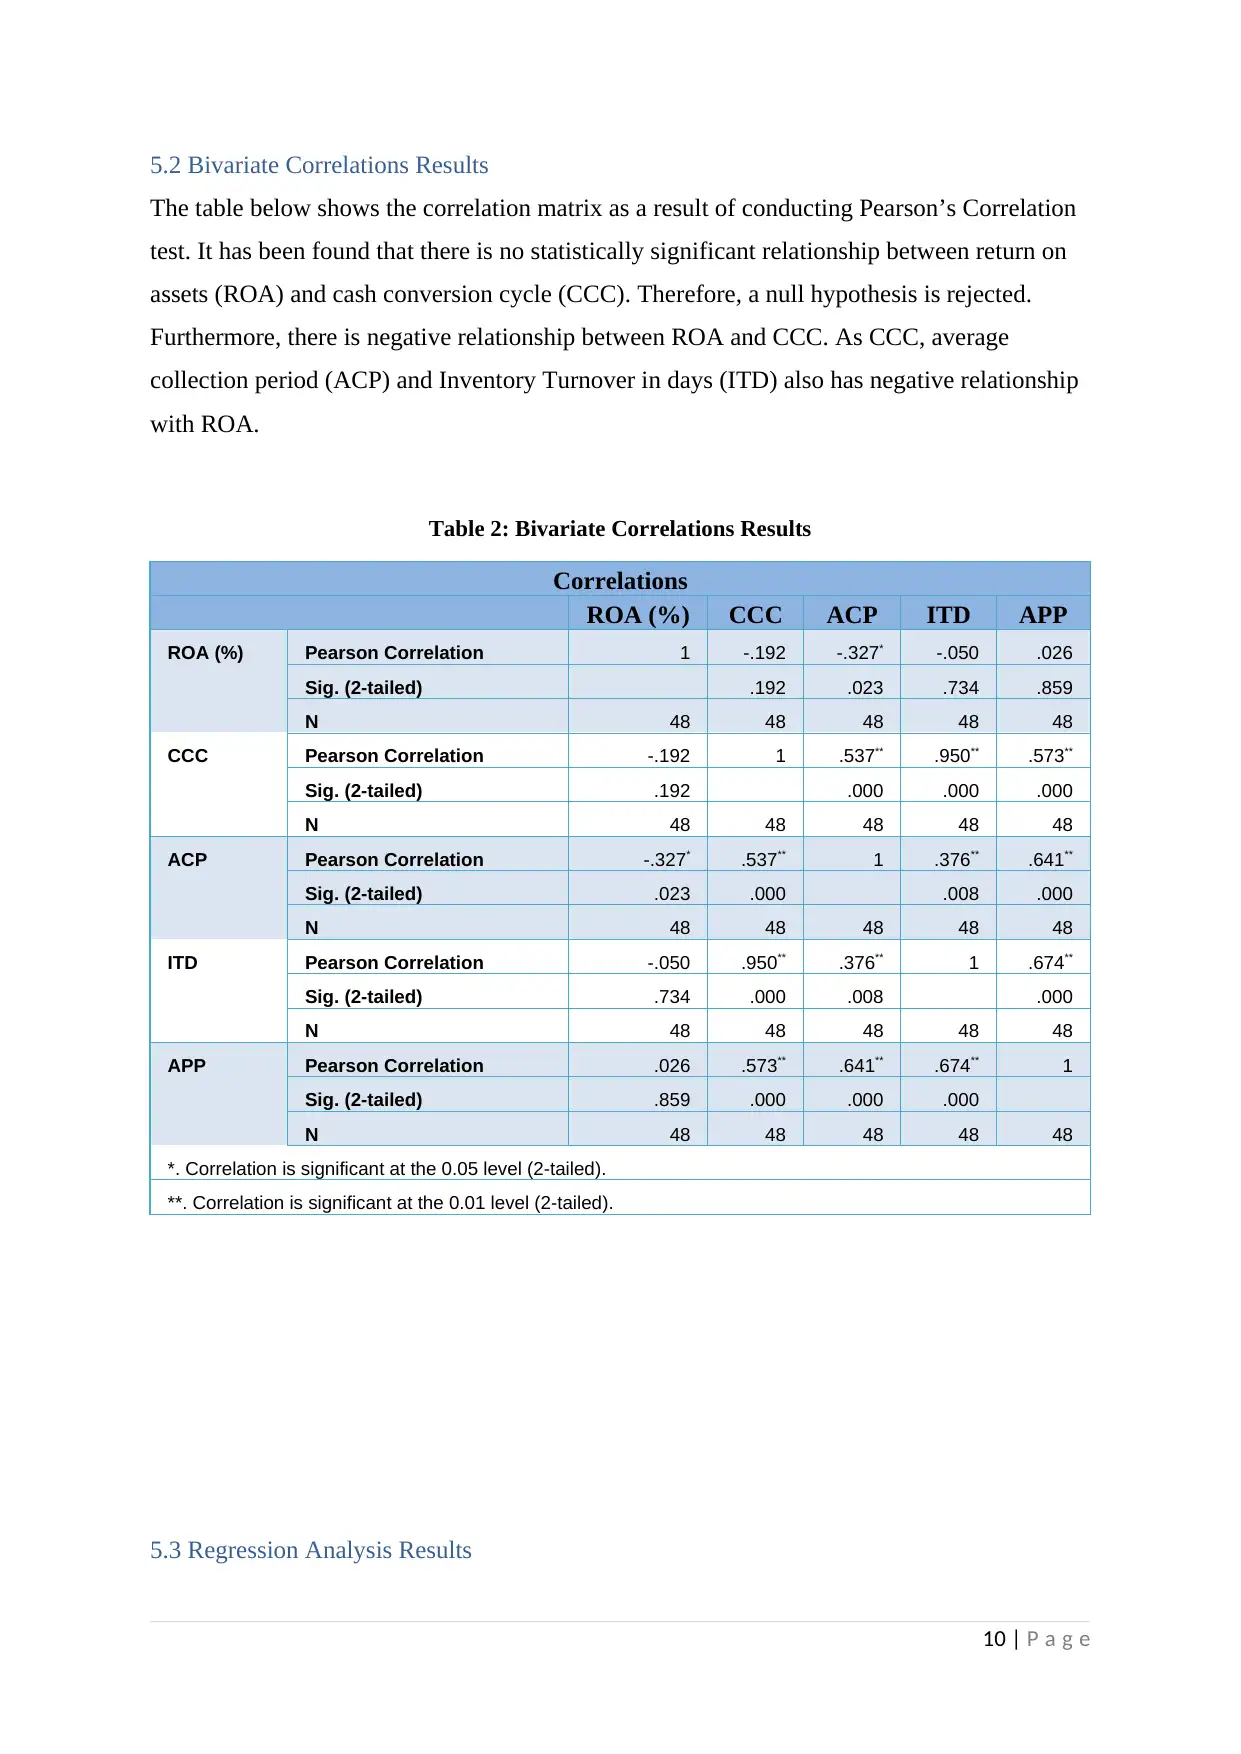
5.2 Bivariate Correlations Results
The table below shows the correlation matrix as a result of conducting Pearson’s Correlation
test. It has been found that there is no statistically significant relationship between return on
assets (ROA) and cash conversion cycle (CCC). Therefore, a null hypothesis is rejected.
Furthermore, there is negative relationship between ROA and CCC. As CCC, average
collection period (ACP) and Inventory Turnover in days (ITD) also has negative relationship
with ROA.
Table 2: Bivariate Correlations Results
Correlations
ROA (%) CCC ACP ITD APP
ROA (%) Pearson Correlation 1 -.192 -.327* -.050 .026
Sig. (2-tailed) .192 .023 .734 .859
N 48 48 48 48 48
CCC Pearson Correlation -.192 1 .537** .950** .573**
Sig. (2-tailed) .192 .000 .000 .000
N 48 48 48 48 48
ACP Pearson Correlation -.327* .537** 1 .376** .641**
Sig. (2-tailed) .023 .000 .008 .000
N 48 48 48 48 48
ITD Pearson Correlation -.050 .950** .376** 1 .674**
Sig. (2-tailed) .734 .000 .008 .000
N 48 48 48 48 48
APP Pearson Correlation .026 .573** .641** .674** 1
Sig. (2-tailed) .859 .000 .000 .000
N 48 48 48 48 48
*. Correlation is significant at the 0.05 level (2-tailed).
**. Correlation is significant at the 0.01 level (2-tailed).
5.3 Regression Analysis Results
10 | P a g e
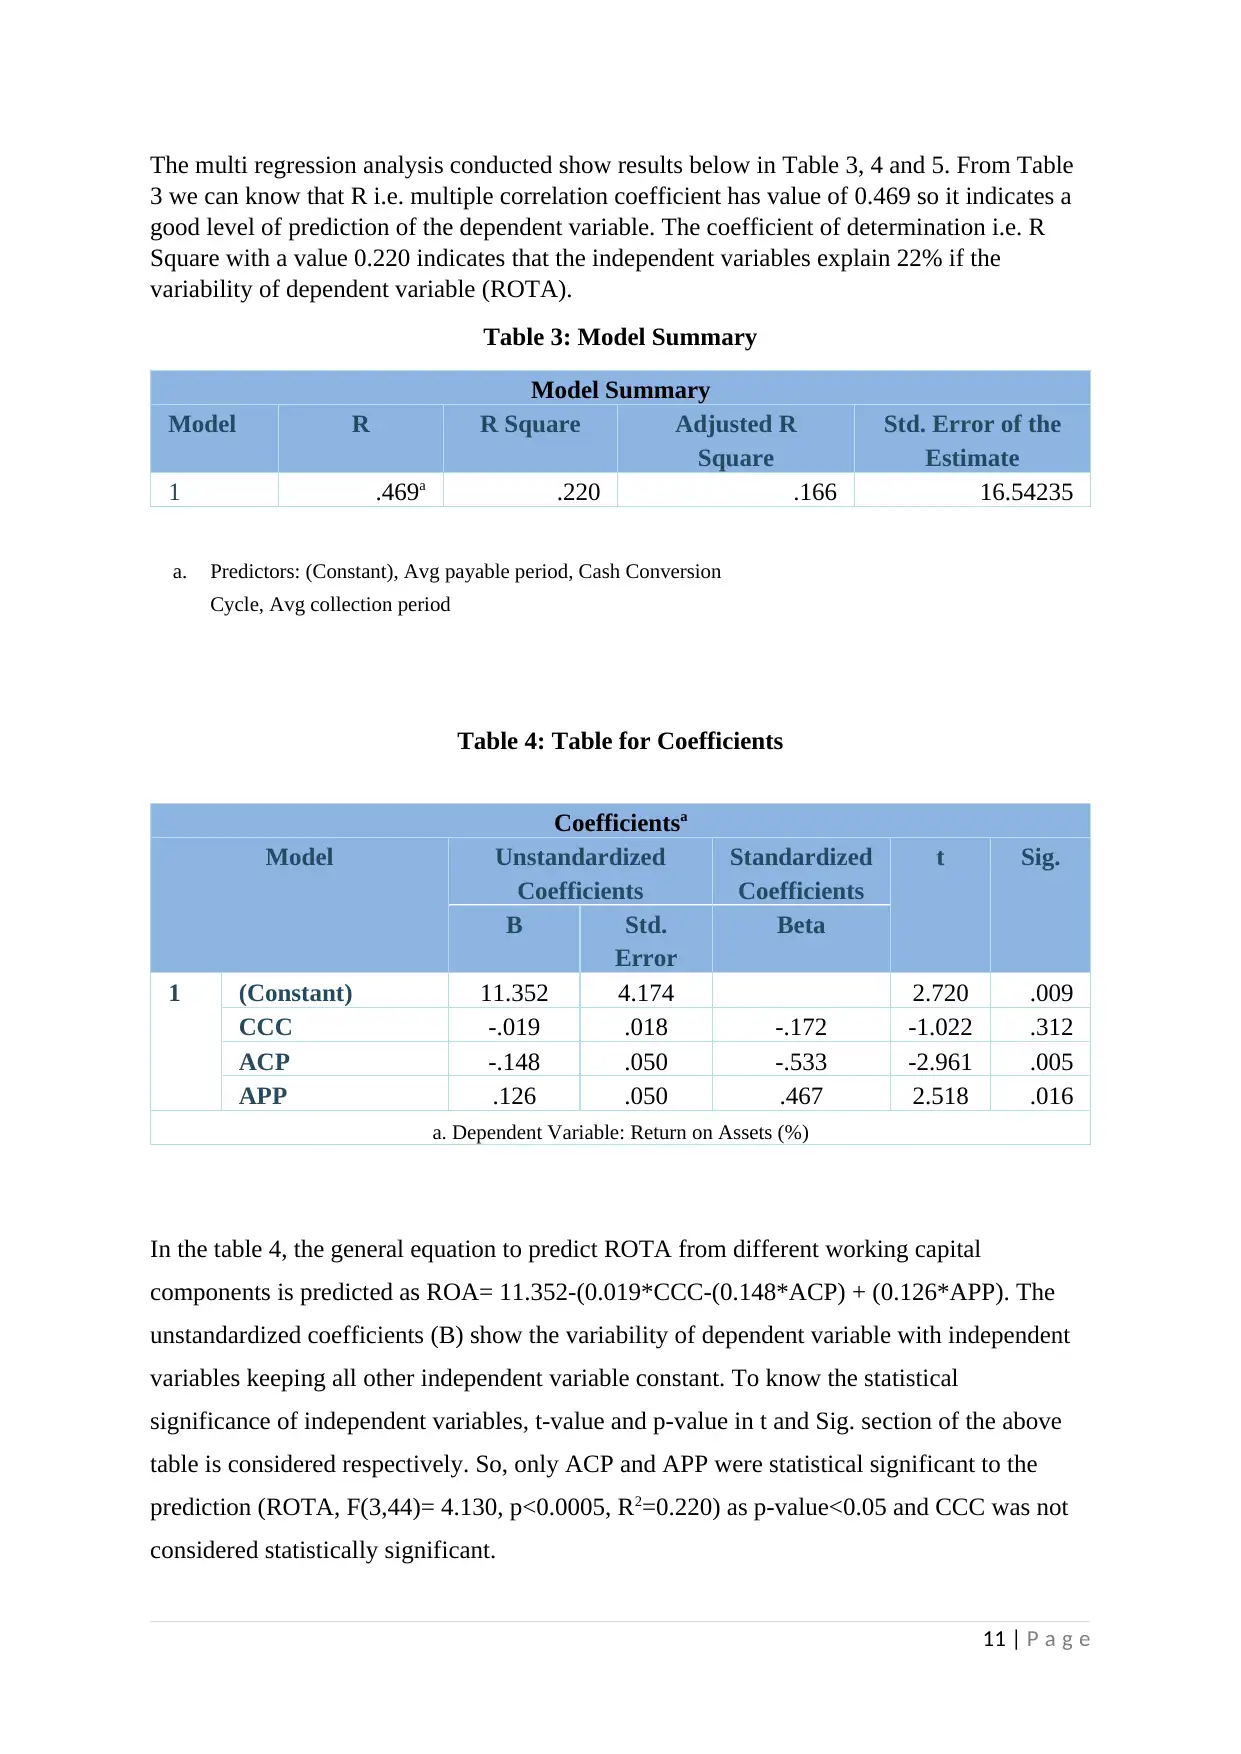
The multi regression analysis conducted show results below in Table 3, 4 and 5. From Table
3 we can know that R i.e. multiple correlation coefficient has value of 0.469 so it indicates a
good level of prediction of the dependent variable. The coefficient of determination i.e. R
Square with a value 0.220 indicates that the independent variables explain 22% if the
variability of dependent variable (ROTA).
Table 3: Model Summary
Model Summary
Model R R Square Adjusted R
Square
Std. Error of the
Estimate
1 .469a .220 .166 16.54235
a. Predictors: (Constant), Avg payable period, Cash Conversion
Cycle, Avg collection period
Table 4: Table for Coefficients
Coefficientsa
Model Unstandardized
Coefficients
Standardized
Coefficients
t Sig.
B Std.
Error
Beta
1 (Constant) 11.352 4.174 2.720 .009
CCC -.019 .018 -.172 -1.022 .312
ACP -.148 .050 -.533 -2.961 .005
APP .126 .050 .467 2.518 .016
a. Dependent Variable: Return on Assets (%)
In the table 4, the general equation to predict ROTA from different working capital
components is predicted as ROA= 11.352-(0.019*CCC-(0.148*ACP) + (0.126*APP). The
unstandardized coefficients (B) show the variability of dependent variable with independent
variables keeping all other independent variable constant. To know the statistical
significance of independent variables, t-value and p-value in t and Sig. section of the above
table is considered respectively. So, only ACP and APP were statistical significant to the
prediction (ROTA, F(3,44)= 4.130, p<0.0005, R2=0.220) as p-value<0.05 and CCC was not
considered statistically significant.
11 | P a g e
⊘ This is a preview!⊘
Do you want full access?
Subscribe today to unlock all pages.
Trusted by 1+ million students worldwide
1 out of 18
Related Documents


Your All-in-One AI-Powered Toolkit for Academic Success.
+13062052269
info@desklib.com
Available 24*7 on WhatsApp / Email
![[object Object]](/_next/static/media/star-bottom.7253800d.svg)
Unlock your academic potential
Copyright © 2020–2026 A2Z Services. All Rights Reserved. Developed and managed by ZUCOL.