Econ 399 Term Paper: Workplace Relations and Discrimination Report
VerifiedAdded on 2022/08/18
|17
|4473
|10
Report
AI Summary
This report, prepared for an Econ 399 course at MacEwan University, examines workplace discrimination, specifically focusing on gender and age-based disparities in salary. The study begins with an introduction and literature review, summarizing existing research on discrimination. The methodology section details the use of statistical analysis, including correlation and regression models, using R programming to analyze a dataset. The results section presents the findings, demonstrating a positive correlation between age and salary, and analyzes the significance of age and service as predictors of salary. The analysis reveals the significance of age in determining salary, while service is found to be insignificant. The report concludes by summarizing the key findings and their implications, addressing the presence of discrimination in the workplace. The paper follows APA formatting guidelines and includes references.
Running head: WORKPLACE RELATIONS AND DISCRIMINATION
Workplace Relations and Discrimination
Student’s Name
Institution
Date
Workplace Relations and Discrimination
Student’s Name
Institution
Date
Paraphrase This Document
Need a fresh take? Get an instant paraphrase of this document with our AI Paraphraser
WORKPLACE RELATIONS AND DISCRIMINATION 2
Table of Contents
Introduction......................................................................................................................................3
Literature review..............................................................................................................................3
Gender discrimination at workplace............................................................................................4
Age discrimination at workplace.................................................................................................5
Data analysis....................................................................................................................................7
Summary statistics.......................................................................................................................7
Inferential statistics......................................................................................................................8
Testing age discrimination...........................................................................................................8
Modelling relationship between Age and Salary.........................................................................8
Gender and salary.......................................................................................................................10
Discussion......................................................................................................................................11
Conclusion.....................................................................................................................................11
References......................................................................................................................................12
Appendix........................................................................................................................................14
WORKPLACE RELATIONS AND DISCRIMINATION 3
Introduction
Non-discrimination enshrined in many international legal instruments ( the Universal
Declaration of Human Rights on December 10, 1948 , the ILO Declaration on Fundamental
Principles and Rights at Work of 19 June 1998 , and others. At the same time, despite the fact
that the issue of discrimination is one of the most important when it comes to ensuring the
equality of citizens' rights to work, the state does not yet find this issue of recognition. There is
even no official statistics on discrimination. Not a single state body keeps records that would
make it possible to understand what pattern is emerging in a country with discrimination. This is
because the main indicator of its presence or absence is court decisions (Tesfaye, 2011). And
there exists a minimum cases dealing with the issue of discrimination. Nevertheless, according to
the expert, in practice discrimination is quite common, and it manifests itself in various forms
and concerns various aspects of work from hiring and dismissal to remuneration (Shikha &
Yuvika 2014). So, employees for the trial period are often set lower salaries than colleagues, and
employees with equal qualifications and holding the same position are paid different salaries. In
terms of hiring, for example, the modern employer never indicates the true reason for the refusal
- he usually motivates his decision either by the lack of a suitable vacancy or by the lack of the
required professional qualities of the applicant (Konrad, Cannings & Goldberg 2010). At the
same time, it is quite difficult to prove the fact of discrimination in practice, and therefore cases
of discrimination are considered extremely rarely in favor of the employee. The main types of
workplace discrimination is by gender and age.
Literature review
Discrimination is an unequal attitude towards people based on their personal qualities,
which may include age, gender, sexual orientation, nationality or physical characteristics.
According to Glick (2013), discrimination usually refers to a negative attitude, but it may also be
⊘ This is a preview!⊘
Do you want full access?
Subscribe today to unlock all pages.
Trusted by 1+ million students worldwide
WORKPLACE RELATIONS AND DISCRIMINATION 4
in favor of certain groups. Discrimination is an umbrella term for a wide range of phenomena.
These are legislative practices that cut down the rights and opportunities of citizens, and
corporate barriers to advancement, and stereotypes of education that limit the worldview of
children and their future opportunities. Discrimination is so rooted that some of its
manifestations are considered the norm, for example, women's domestic duties, which are not
considered work by default and are not paid (Hitlan et al 2009). Similarly, the norm is not to trust
the competence of a woman in business negotiations and to expect the final decision from a man.
Glass ceiling (glass ceiling) - a term that appeared in the 1980s to refer to the obstacles that
women face in building a career, while these barriers are in no way related to their professional
qualities (Grant 2010). According to statistics, in the initial positions in large companies, men
and women are approximately equally divided, however, with each new rung of women, there
are fewer and fewer women reach the top positions - this is the glass ceiling (Hora, 2014). The
women themselves are often blamed for this, in two ways: on the one hand, they are poorly
asking for promotion, not as assertive as men, and on the other hand, if a woman shows firmness
enough to insist on her, others accuse her of aggressiveness (Good & Rudman 2010).
Gender discrimination at workplace
A study by de Lemus et al (2014) acknowledged that gender discrimination in the world
of work is a multilateral phenomenon with a large number of different manifestations.
Nevertheless, some researchers are convinced that discrimination is becoming the norm, while
others, on the contrary, deny the fact of its existence on the basis of sex (Rehman & Azam
2012). “Glass ceiling” is a term coined in the early 1980s to describe an invisible barrier
restricting a woman’s career advancement. This form of discrimination was described as “a
barrier so inconspicuous that it is transparent, but at the same time so strong that it prevents
women from advancing in the managerial hierarchy. De Pater et al (2010). Identify glass ceiling
Paraphrase This Document
Need a fresh take? Get an instant paraphrase of this document with our AI Paraphraser
WORKPLACE RELATIONS AND DISCRIMINATION 5
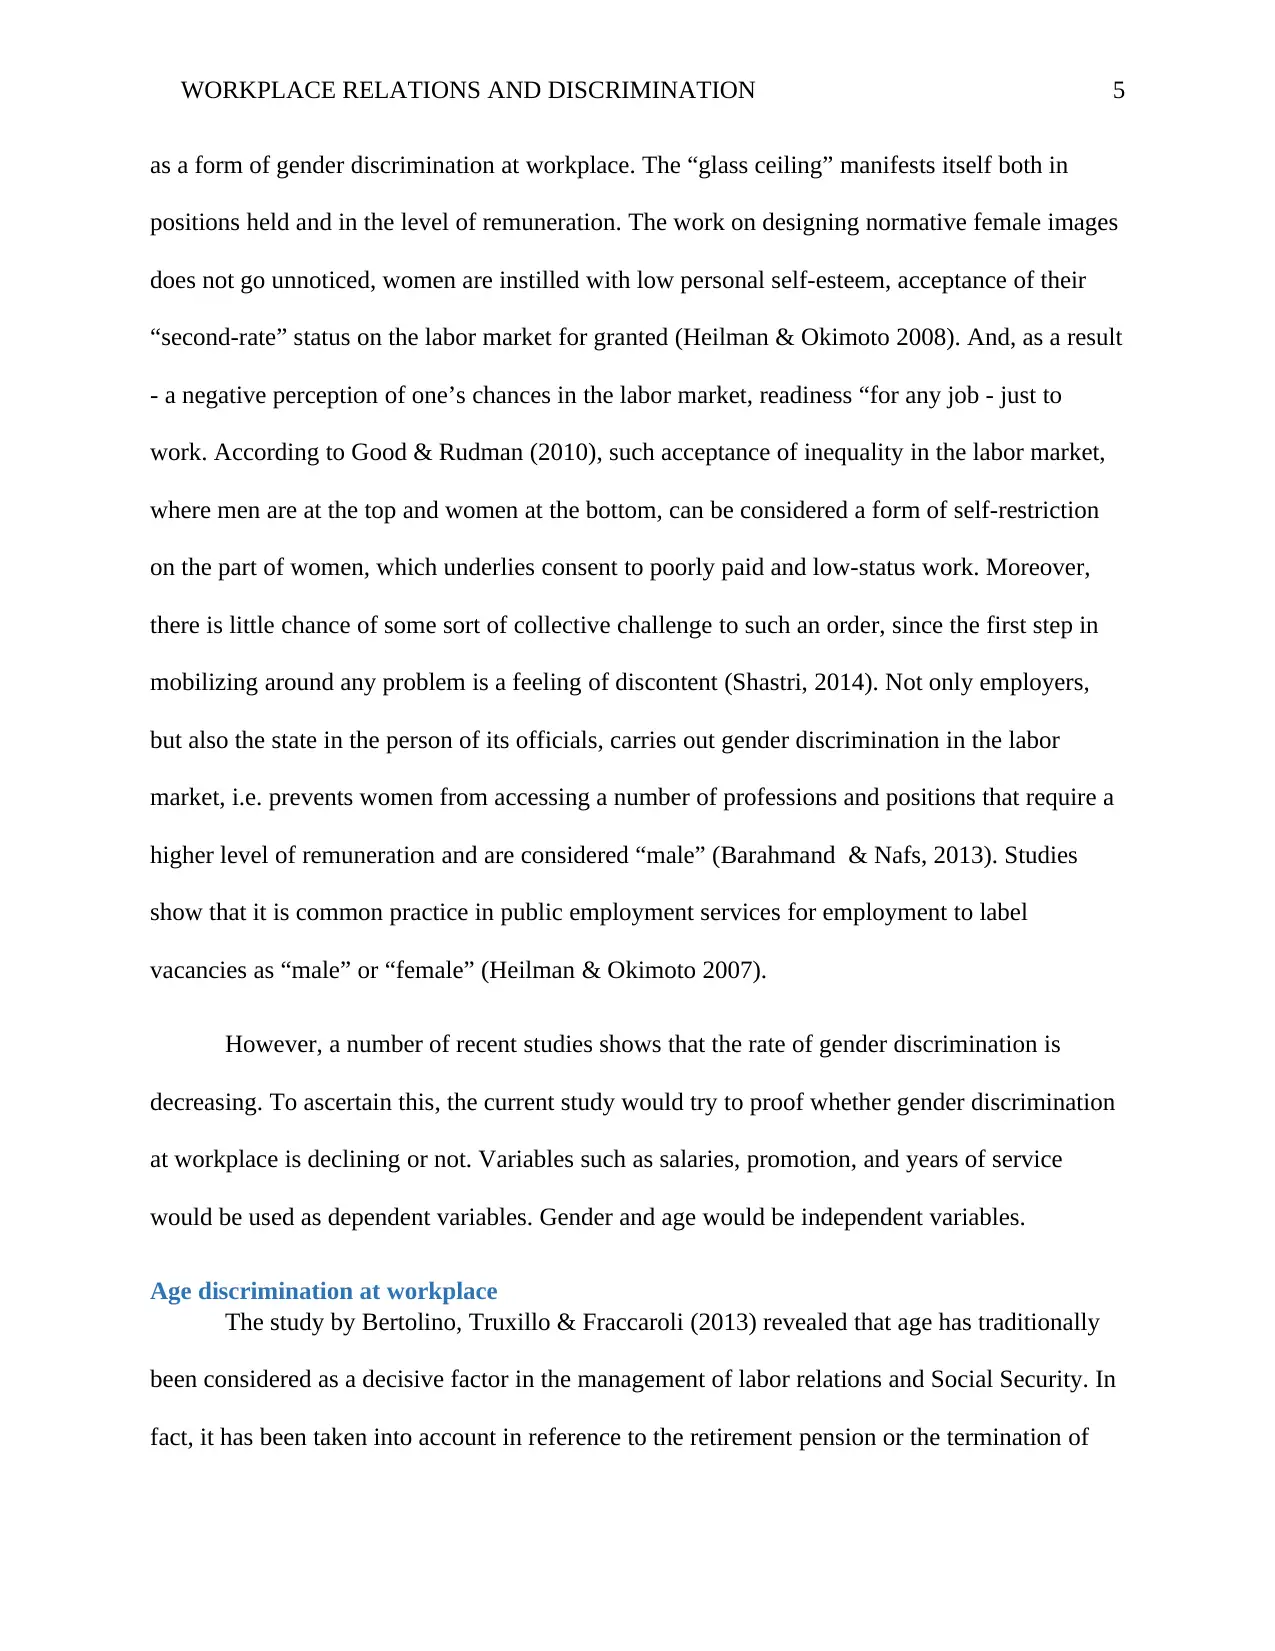
as a form of gender discrimination at workplace. The “glass ceiling” manifests itself both in
positions held and in the level of remuneration. The work on designing normative female images
does not go unnoticed, women are instilled with low personal self-esteem, acceptance of their
“second-rate” status on the labor market for granted (Heilman & Okimoto 2008). And, as a result
- a negative perception of one’s chances in the labor market, readiness “for any job - just to
work. According to Good & Rudman (2010), such acceptance of inequality in the labor market,
where men are at the top and women at the bottom, can be considered a form of self-restriction
on the part of women, which underlies consent to poorly paid and low-status work. Moreover,
there is little chance of some sort of collective challenge to such an order, since the first step in
mobilizing around any problem is a feeling of discontent (Shastri, 2014). Not only employers,
but also the state in the person of its officials, carries out gender discrimination in the labor
market, i.e. prevents women from accessing a number of professions and positions that require a
higher level of remuneration and are considered “male” (Barahmand & Nafs, 2013). Studies
show that it is common practice in public employment services for employment to label
vacancies as “male” or “female” (Heilman & Okimoto 2007).
However, a number of recent studies shows that the rate of gender discrimination is
decreasing. To ascertain this, the current study would try to proof whether gender discrimination
at workplace is declining or not. Variables such as salaries, promotion, and years of service
would be used as dependent variables. Gender and age would be independent variables.
Age discrimination at workplace
The study by Bertolino, Truxillo & Fraccaroli (2013) revealed that age has traditionally
been considered as a decisive factor in the management of labor relations and Social Security. In
fact, it has been taken into account in reference to the retirement pension or the termination of
WORKPLACE RELATIONS AND DISCRIMINATION 6
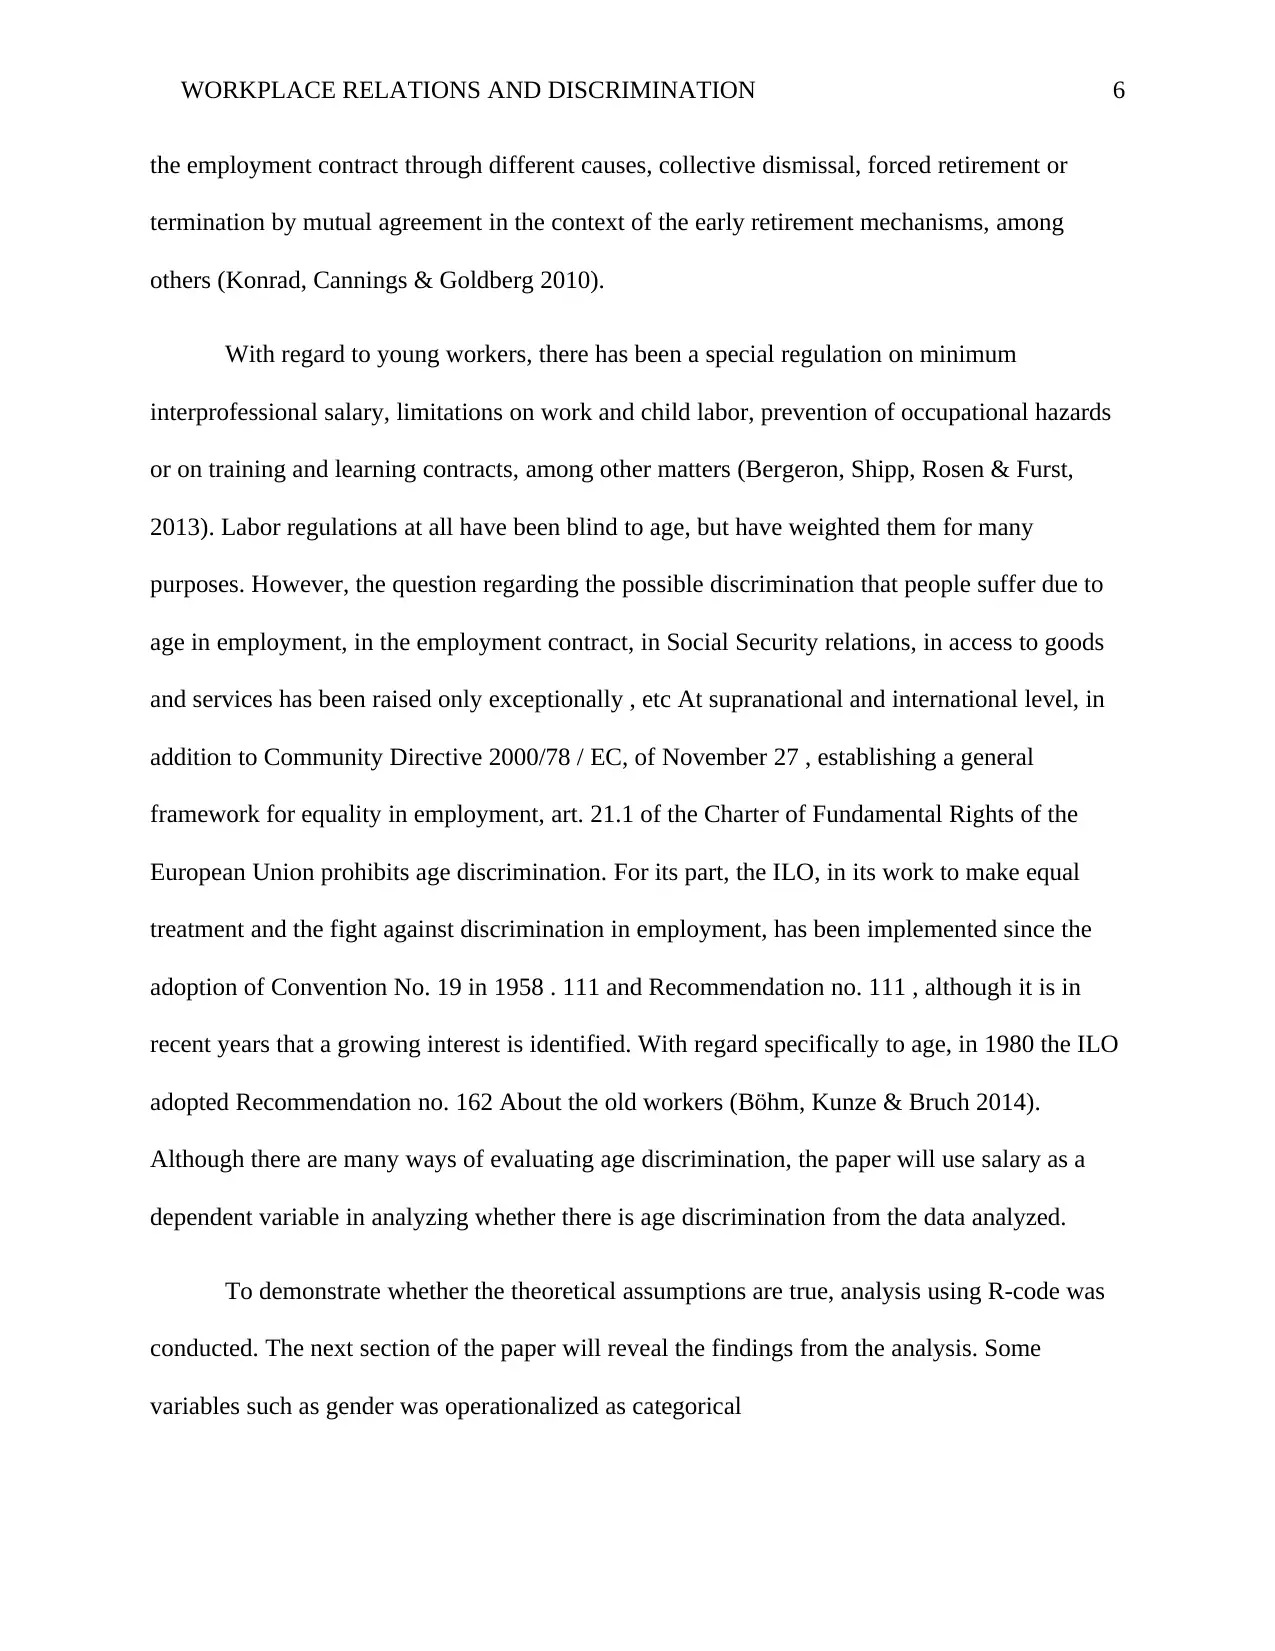
the employment contract through different causes, collective dismissal, forced retirement or
termination by mutual agreement in the context of the early retirement mechanisms, among
others (Konrad, Cannings & Goldberg 2010).
With regard to young workers, there has been a special regulation on minimum
interprofessional salary, limitations on work and child labor, prevention of occupational hazards
or on training and learning contracts, among other matters (Bergeron, Shipp, Rosen & Furst,
2013). Labor regulations at all have been blind to age, but have weighted them for many
purposes. However, the question regarding the possible discrimination that people suffer due to
age in employment, in the employment contract, in Social Security relations, in access to goods
and services has been raised only exceptionally , etc At supranational and international level, in
addition to Community Directive 2000/78 / EC, of November 27 , establishing a general
framework for equality in employment, art. 21.1 of the Charter of Fundamental Rights of the
European Union prohibits age discrimination. For its part, the ILO, in its work to make equal
treatment and the fight against discrimination in employment, has been implemented since the
adoption of Convention No. 19 in 1958 . 111 and Recommendation no. 111 , although it is in
recent years that a growing interest is identified. With regard specifically to age, in 1980 the ILO
adopted Recommendation no. 162 About the old workers (Böhm, Kunze & Bruch 2014).
Although there are many ways of evaluating age discrimination, the paper will use salary as a
dependent variable in analyzing whether there is age discrimination from the data analyzed.
To demonstrate whether the theoretical assumptions are true, analysis using R-code was
conducted. The next section of the paper will reveal the findings from the analysis. Some
variables such as gender was operationalized as categorical
⊘ This is a preview!⊘
Do you want full access?
Subscribe today to unlock all pages.
Trusted by 1+ million students worldwide
WORKPLACE RELATIONS AND DISCRIMINATION 7
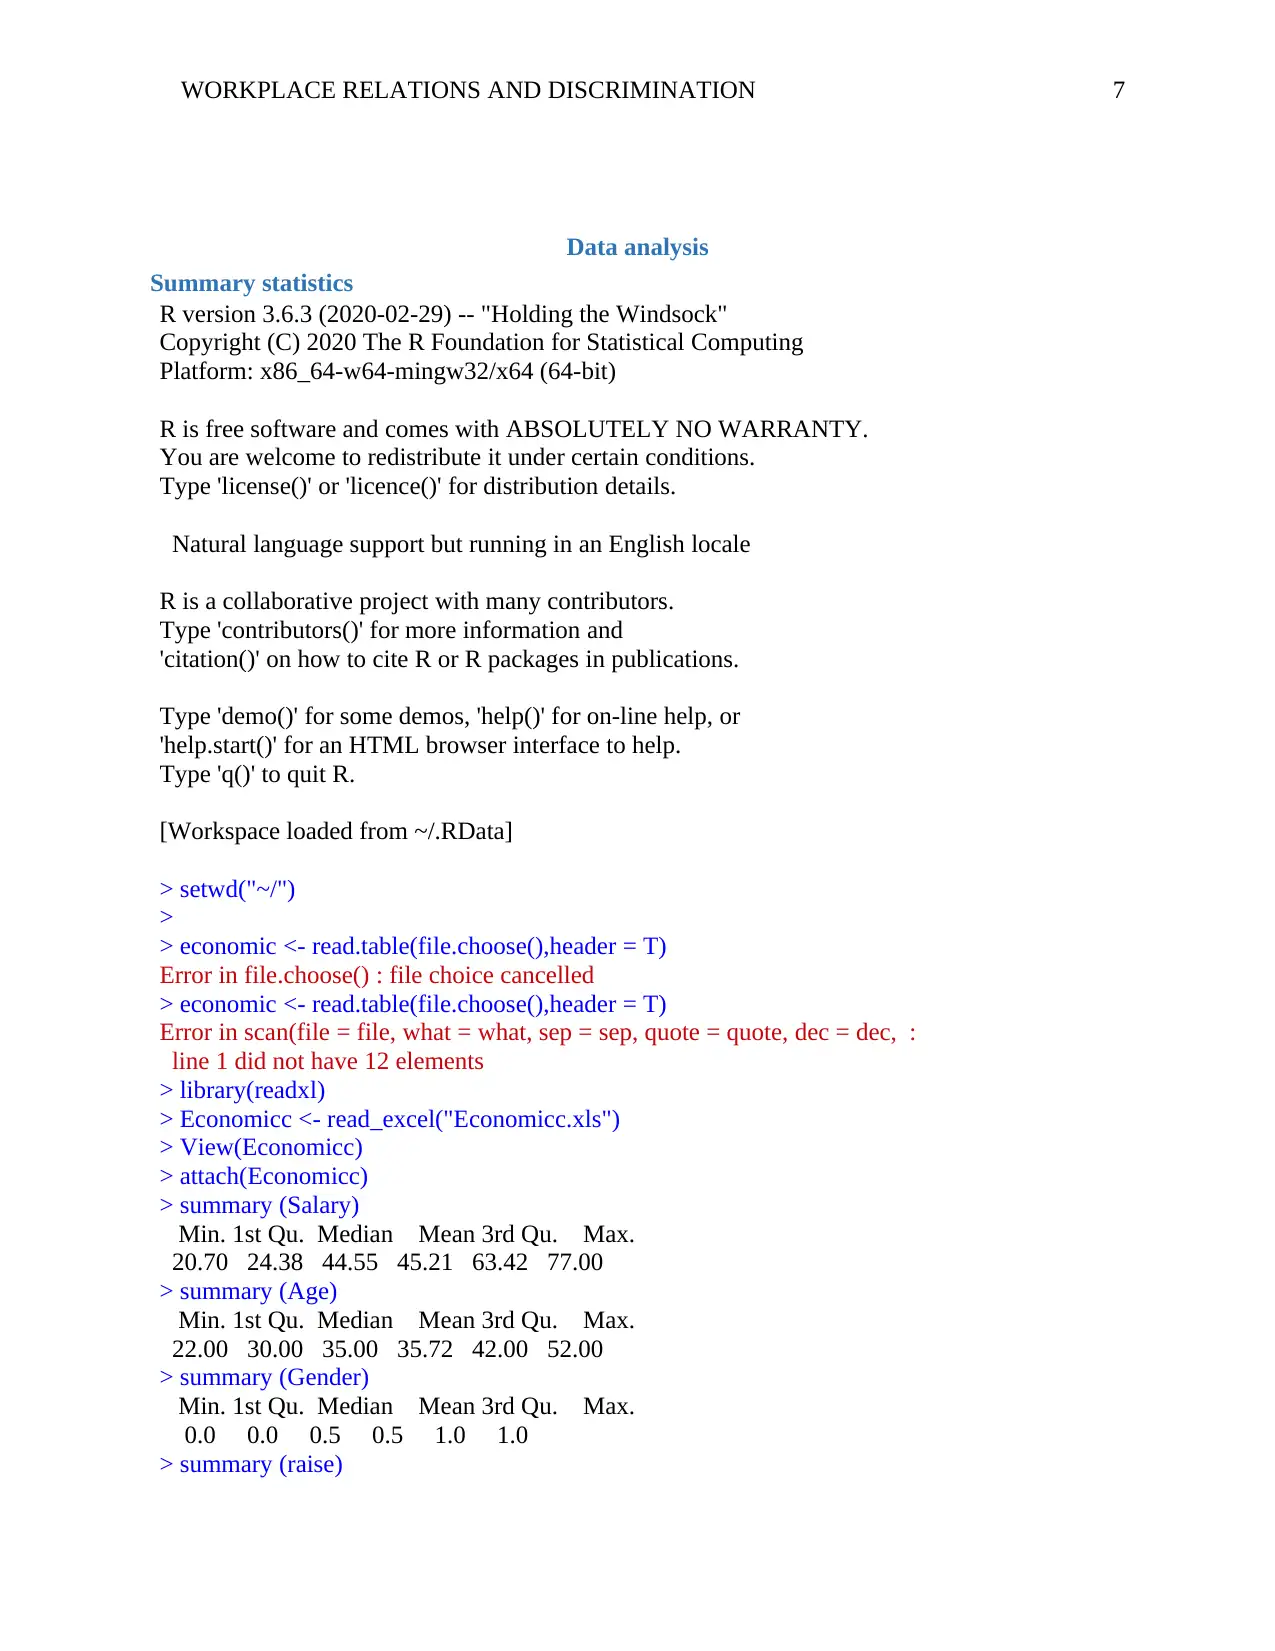
Data analysis
Summary statistics
R version 3.6.3 (2020-02-29) -- "Holding the Windsock"
Copyright (C) 2020 The R Foundation for Statistical Computing
Platform: x86_64-w64-mingw32/x64 (64-bit)
R is free software and comes with ABSOLUTELY NO WARRANTY.
You are welcome to redistribute it under certain conditions.
Type 'license()' or 'licence()' for distribution details.
Natural language support but running in an English locale
R is a collaborative project with many contributors.
Type 'contributors()' for more information and
'citation()' on how to cite R or R packages in publications.
Type 'demo()' for some demos, 'help()' for on-line help, or
'help.start()' for an HTML browser interface to help.
Type 'q()' to quit R.
[Workspace loaded from ~/.RData]
> setwd("~/")
>
> economic <- read.table(file.choose(),header = T)
Error in file.choose() : file choice cancelled
> economic <- read.table(file.choose(),header = T)
Error in scan(file = file, what = what, sep = sep, quote = quote, dec = dec, :
line 1 did not have 12 elements
> library(readxl)
> Economicc <- read_excel("Economicc.xls")
> View(Economicc)
> attach(Economicc)
> summary (Salary)
Min. 1st Qu. Median Mean 3rd Qu. Max.
20.70 24.38 44.55 45.21 63.42 77.00
> summary (Age)
Min. 1st Qu. Median Mean 3rd Qu. Max.
22.00 30.00 35.00 35.72 42.00 52.00
> summary (Gender)
Min. 1st Qu. Median Mean 3rd Qu. Max.
0.0 0.0 0.5 0.5 1.0 1.0
> summary (raise)
Paraphrase This Document
Need a fresh take? Get an instant paraphrase of this document with our AI Paraphraser
WORKPLACE RELATIONS AND DISCRIMINATION 8
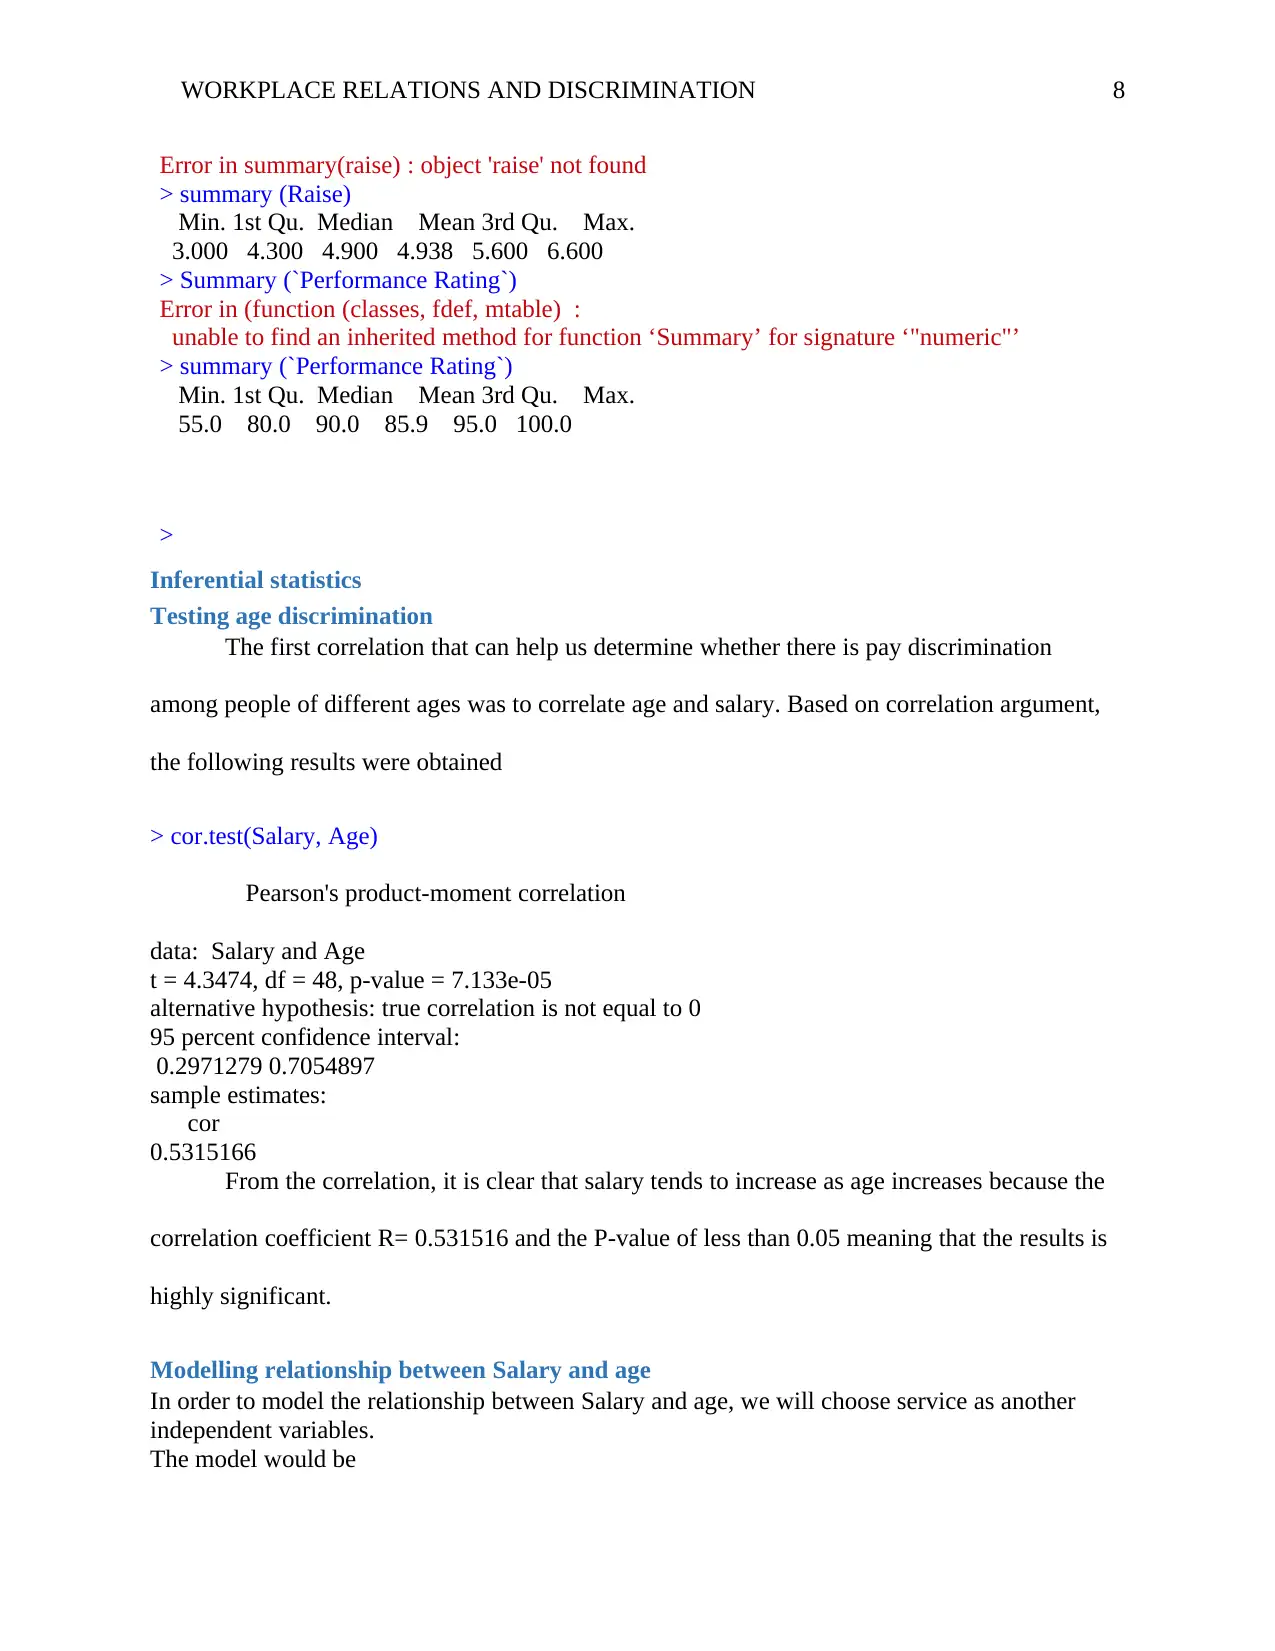
Error in summary(raise) : object 'raise' not found
> summary (Raise)
Min. 1st Qu. Median Mean 3rd Qu. Max.
3.000 4.300 4.900 4.938 5.600 6.600
> Summary (`Performance Rating`)
Error in (function (classes, fdef, mtable) :
unable to find an inherited method for function ‘Summary’ for signature ‘"numeric"’
> summary (`Performance Rating`)
Min. 1st Qu. Median Mean 3rd Qu. Max.
55.0 80.0 90.0 85.9 95.0 100.0
>
Inferential statistics
Testing age discrimination
The first correlation that can help us determine whether there is pay discrimination
among people of different ages was to correlate age and salary. Based on correlation argument,
the following results were obtained
> cor.test(Salary, Age)
Pearson's product-moment correlation
data: Salary and Age
t = 4.3474, df = 48, p-value = 7.133e-05
alternative hypothesis: true correlation is not equal to 0
95 percent confidence interval:
0.2971279 0.7054897
sample estimates:
cor
0.5315166
From the correlation, it is clear that salary tends to increase as age increases because the
correlation coefficient R= 0.531516 and the P-value of less than 0.05 meaning that the results is
highly significant.
Modelling relationship between Salary and age
In order to model the relationship between Salary and age, we will choose service as another
independent variables.
The model would be
WORKPLACE RELATIONS AND DISCRIMINATION 9
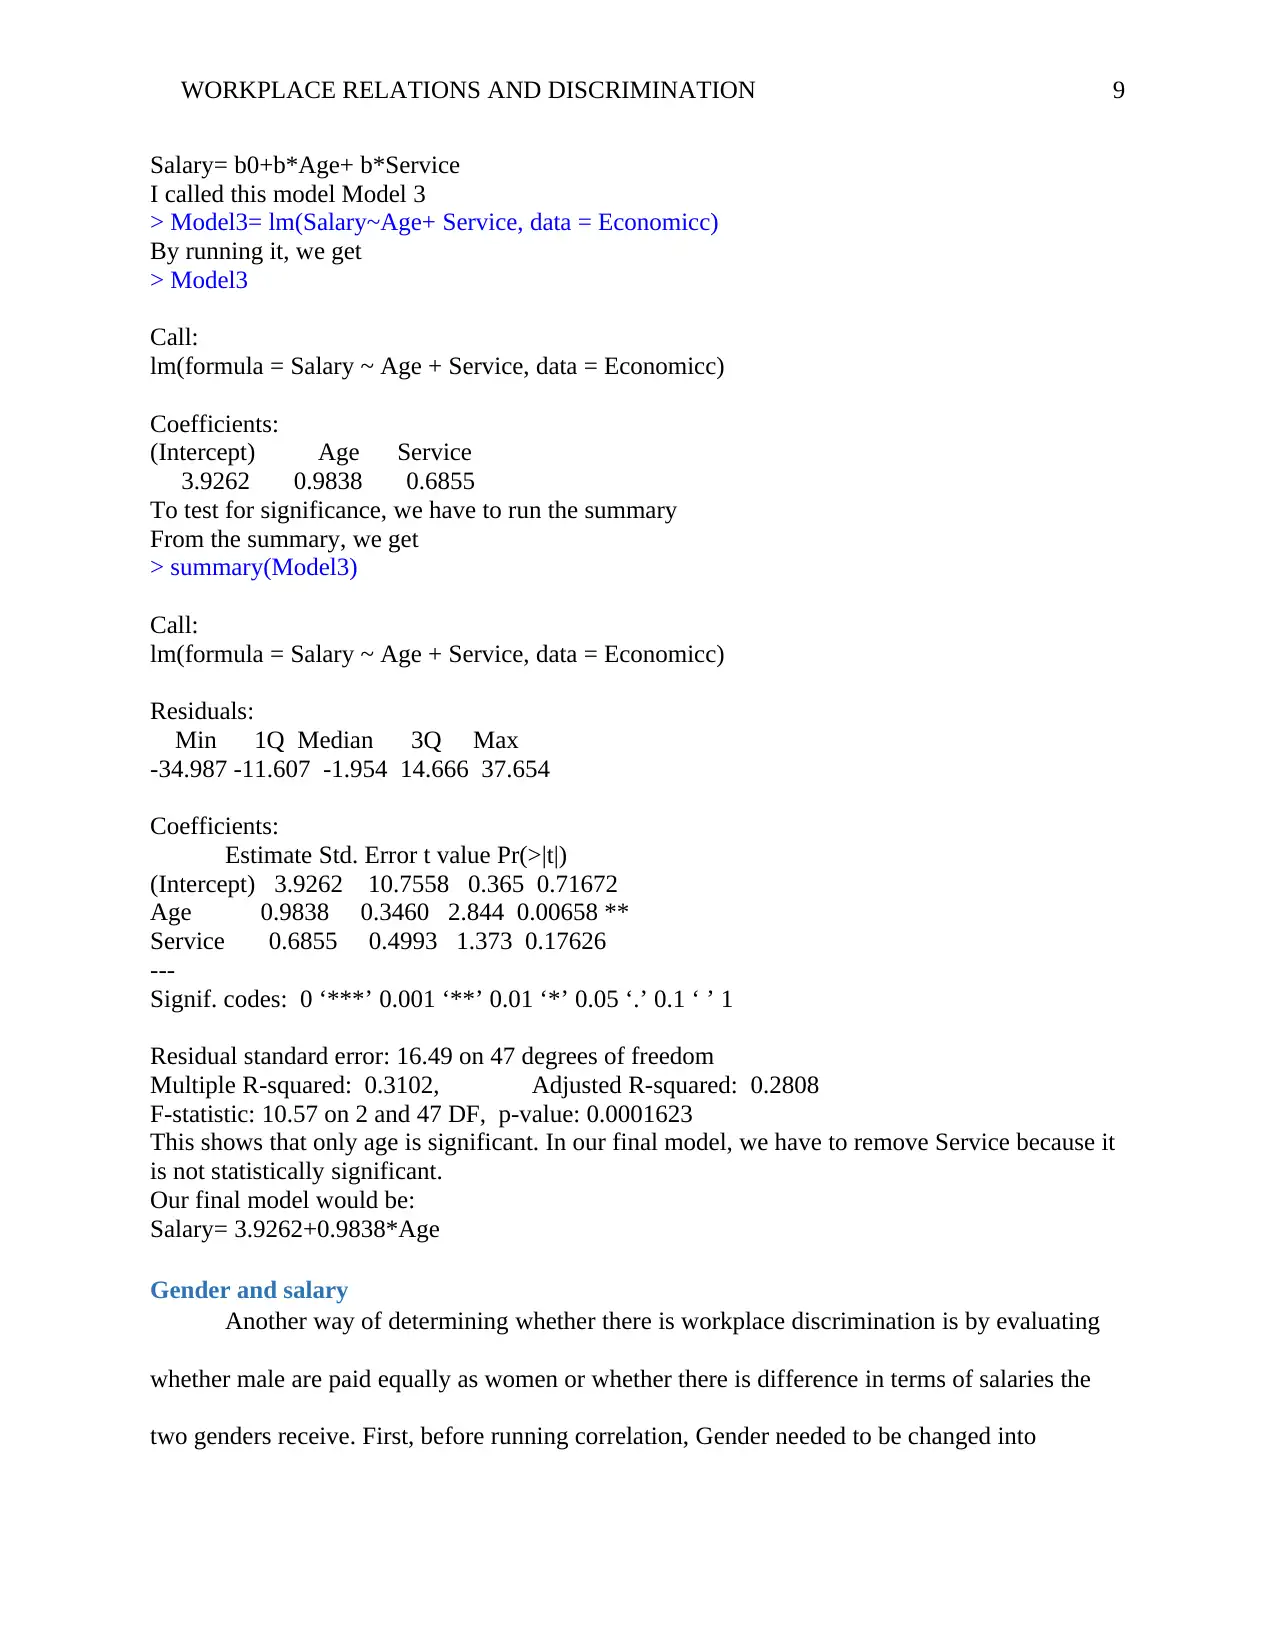
Salary= b0+b*Age+ b*Service
I called this model Model 3
> Model3= lm(Salary~Age+ Service, data = Economicc)
By running it, we get
> Model3
Call:
lm(formula = Salary ~ Age + Service, data = Economicc)
Coefficients:
(Intercept) Age Service
3.9262 0.9838 0.6855
To test for significance, we have to run the summary
From the summary, we get
> summary(Model3)
Call:
lm(formula = Salary ~ Age + Service, data = Economicc)
Residuals:
Min 1Q Median 3Q Max
-34.987 -11.607 -1.954 14.666 37.654
Coefficients:
Estimate Std. Error t value Pr(>|t|)
(Intercept) 3.9262 10.7558 0.365 0.71672
Age 0.9838 0.3460 2.844 0.00658 **
Service 0.6855 0.4993 1.373 0.17626
---
Signif. codes: 0 ‘***’ 0.001 ‘**’ 0.01 ‘*’ 0.05 ‘.’ 0.1 ‘ ’ 1
Residual standard error: 16.49 on 47 degrees of freedom
Multiple R-squared: 0.3102, Adjusted R-squared: 0.2808
F-statistic: 10.57 on 2 and 47 DF, p-value: 0.0001623
This shows that only age is significant. In our final model, we have to remove Service because it
is not statistically significant.
Our final model would be:
Salary= 3.9262+0.9838*Age
Gender and salary
Another way of determining whether there is workplace discrimination is by evaluating
whether male are paid equally as women or whether there is difference in terms of salaries the
two genders receive. First, before running correlation, Gender needed to be changed into
⊘ This is a preview!⊘
Do you want full access?
Subscribe today to unlock all pages.
Trusted by 1+ million students worldwide
WORKPLACE RELATIONS AND DISCRIMINATION 10
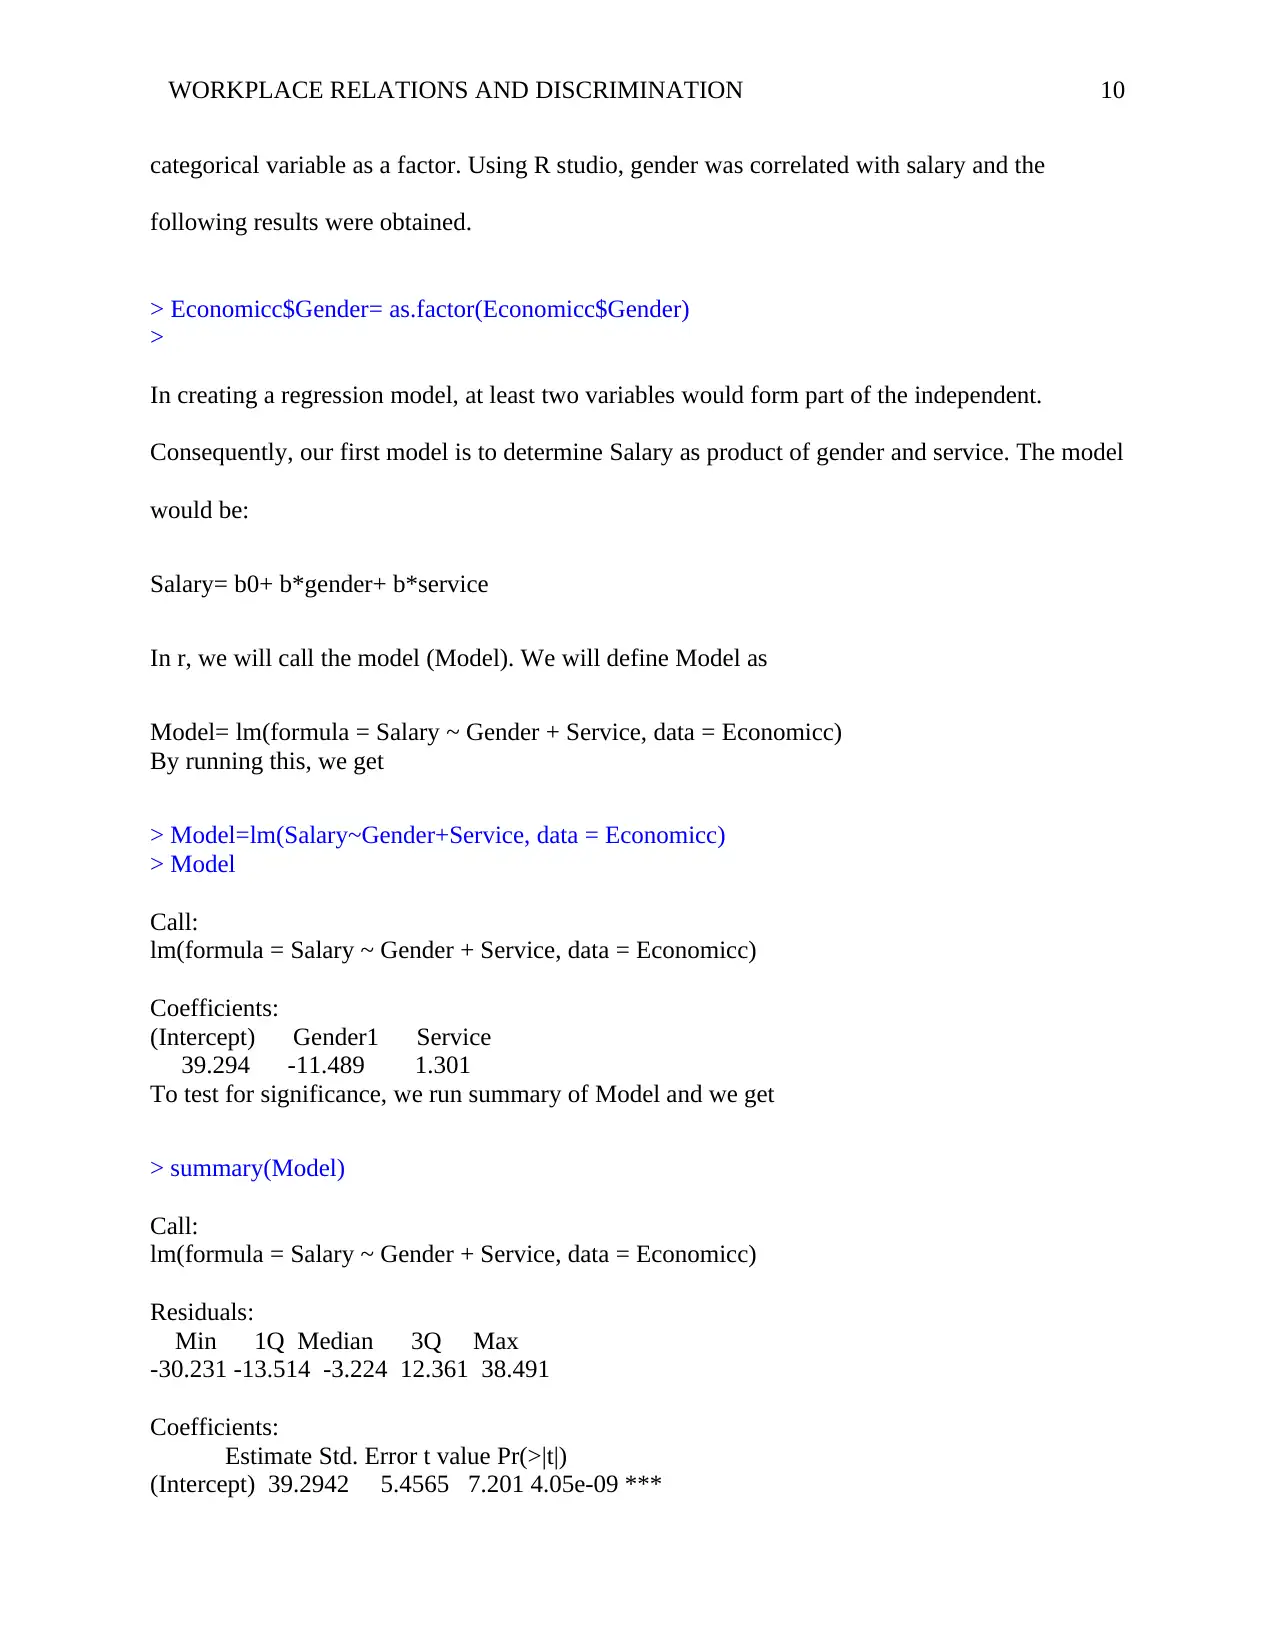
categorical variable as a factor. Using R studio, gender was correlated with salary and the
following results were obtained.
> Economicc$Gender= as.factor(Economicc$Gender)
>
In creating a regression model, at least two variables would form part of the independent.
Consequently, our first model is to determine Salary as product of gender and service. The model
would be:
Salary= b0+ b*gender+ b*service
In r, we will call the model (Model). We will define Model as
Model= lm(formula = Salary ~ Gender + Service, data = Economicc)
By running this, we get
> Model=lm(Salary~Gender+Service, data = Economicc)
> Model
Call:
lm(formula = Salary ~ Gender + Service, data = Economicc)
Coefficients:
(Intercept) Gender1 Service
39.294 -11.489 1.301
To test for significance, we run summary of Model and we get
> summary(Model)
Call:
lm(formula = Salary ~ Gender + Service, data = Economicc)
Residuals:
Min 1Q Median 3Q Max
-30.231 -13.514 -3.224 12.361 38.491
Coefficients:
Estimate Std. Error t value Pr(>|t|)
(Intercept) 39.2942 5.4565 7.201 4.05e-09 ***
Paraphrase This Document
Need a fresh take? Get an instant paraphrase of this document with our AI Paraphraser
WORKPLACE RELATIONS AND DISCRIMINATION 11
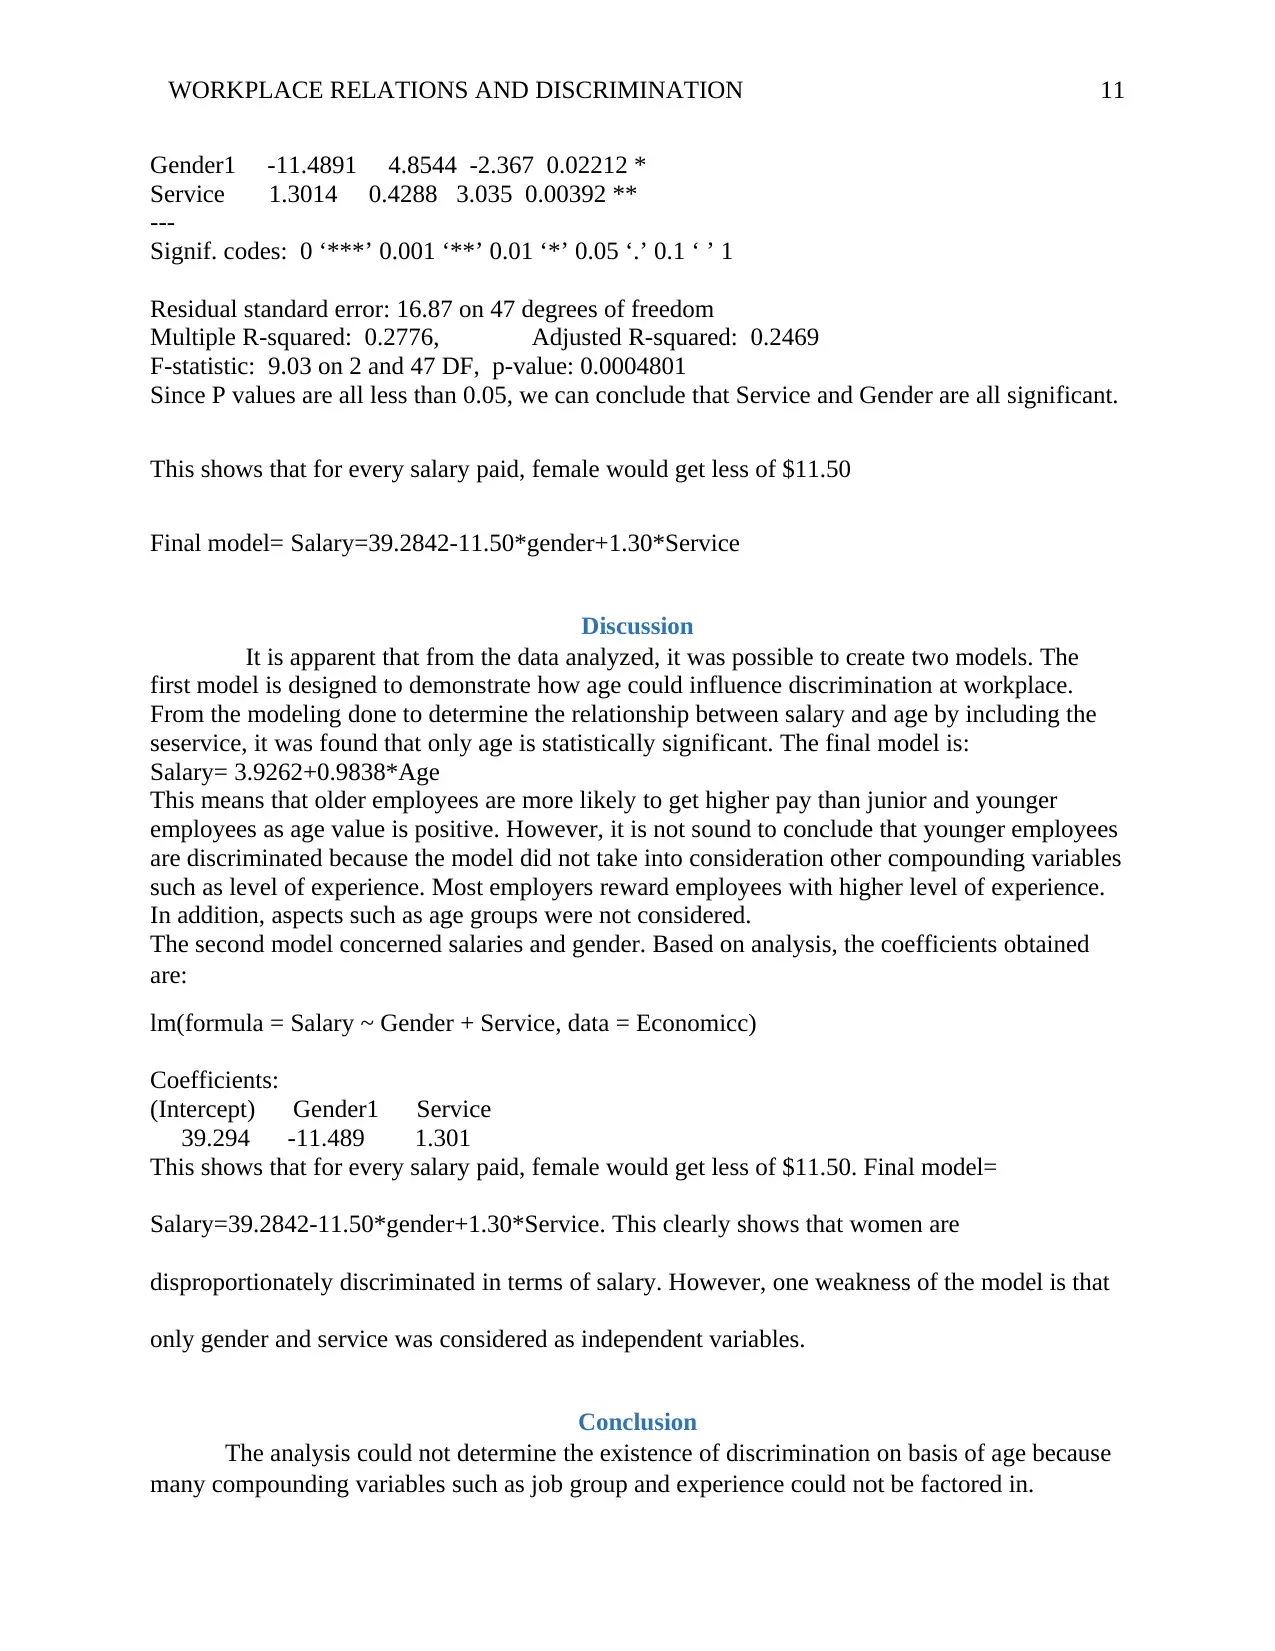
Gender1 -11.4891 4.8544 -2.367 0.02212 *
Service 1.3014 0.4288 3.035 0.00392 **
---
Signif. codes: 0 ‘***’ 0.001 ‘**’ 0.01 ‘*’ 0.05 ‘.’ 0.1 ‘ ’ 1
Residual standard error: 16.87 on 47 degrees of freedom
Multiple R-squared: 0.2776, Adjusted R-squared: 0.2469
F-statistic: 9.03 on 2 and 47 DF, p-value: 0.0004801
Since P values are all less than 0.05, we can conclude that Service and Gender are all significant.
This shows that for every salary paid, female would get less of $11.50
Final model= Salary=39.2842-11.50*gender+1.30*Service
Discussion
It is apparent that from the data analyzed, it was possible to create two models. The
first model is designed to demonstrate how age could influence discrimination at workplace.
From the modeling done to determine the relationship between salary and age by including the
seservice, it was found that only age is statistically significant. The final model is:
Salary= 3.9262+0.9838*Age
This means that older employees are more likely to get higher pay than junior and younger
employees as age value is positive. However, it is not sound to conclude that younger employees
are discriminated because the model did not take into consideration other compounding variables
such as level of experience. Most employers reward employees with higher level of experience.
In addition, aspects such as age groups were not considered.
The second model concerned salaries and gender. Based on analysis, the coefficients obtained
are:
lm(formula = Salary ~ Gender + Service, data = Economicc)
Coefficients:
(Intercept) Gender1 Service
39.294 -11.489 1.301
This shows that for every salary paid, female would get less of $11.50. Final model=
Salary=39.2842-11.50*gender+1.30*Service. This clearly shows that women are
disproportionately discriminated in terms of salary. However, one weakness of the model is that
only gender and service was considered as independent variables.
Conclusion
The analysis could not determine the existence of discrimination on basis of age because
many compounding variables such as job group and experience could not be factored in.
WORKPLACE RELATIONS AND DISCRIMINATION 12
However, the model on the relationship between salary and gender revealed that there is
discrimination in terms of how women and men are paid. Women are paid less than men.
However, the model on the relationship between salary and gender revealed that there is
discrimination in terms of how women and men are paid. Women are paid less than men.
⊘ This is a preview!⊘
Do you want full access?
Subscribe today to unlock all pages.
Trusted by 1+ million students worldwide
1 out of 17
Related Documents


Your All-in-One AI-Powered Toolkit for Academic Success.
+13062052269
info@desklib.com
Available 24*7 on WhatsApp / Email
![[object Object]](/_next/static/media/star-bottom.7253800d.svg)
Unlock your academic potential
Copyright © 2020–2026 A2Z Services. All Rights Reserved. Developed and managed by ZUCOL.