Financial Statement Analysis: A Comparative Study of Worldpay & Z1P Co

Verified

Added on  2023/06/11

|8
|1781
|328
Report
AI Summary
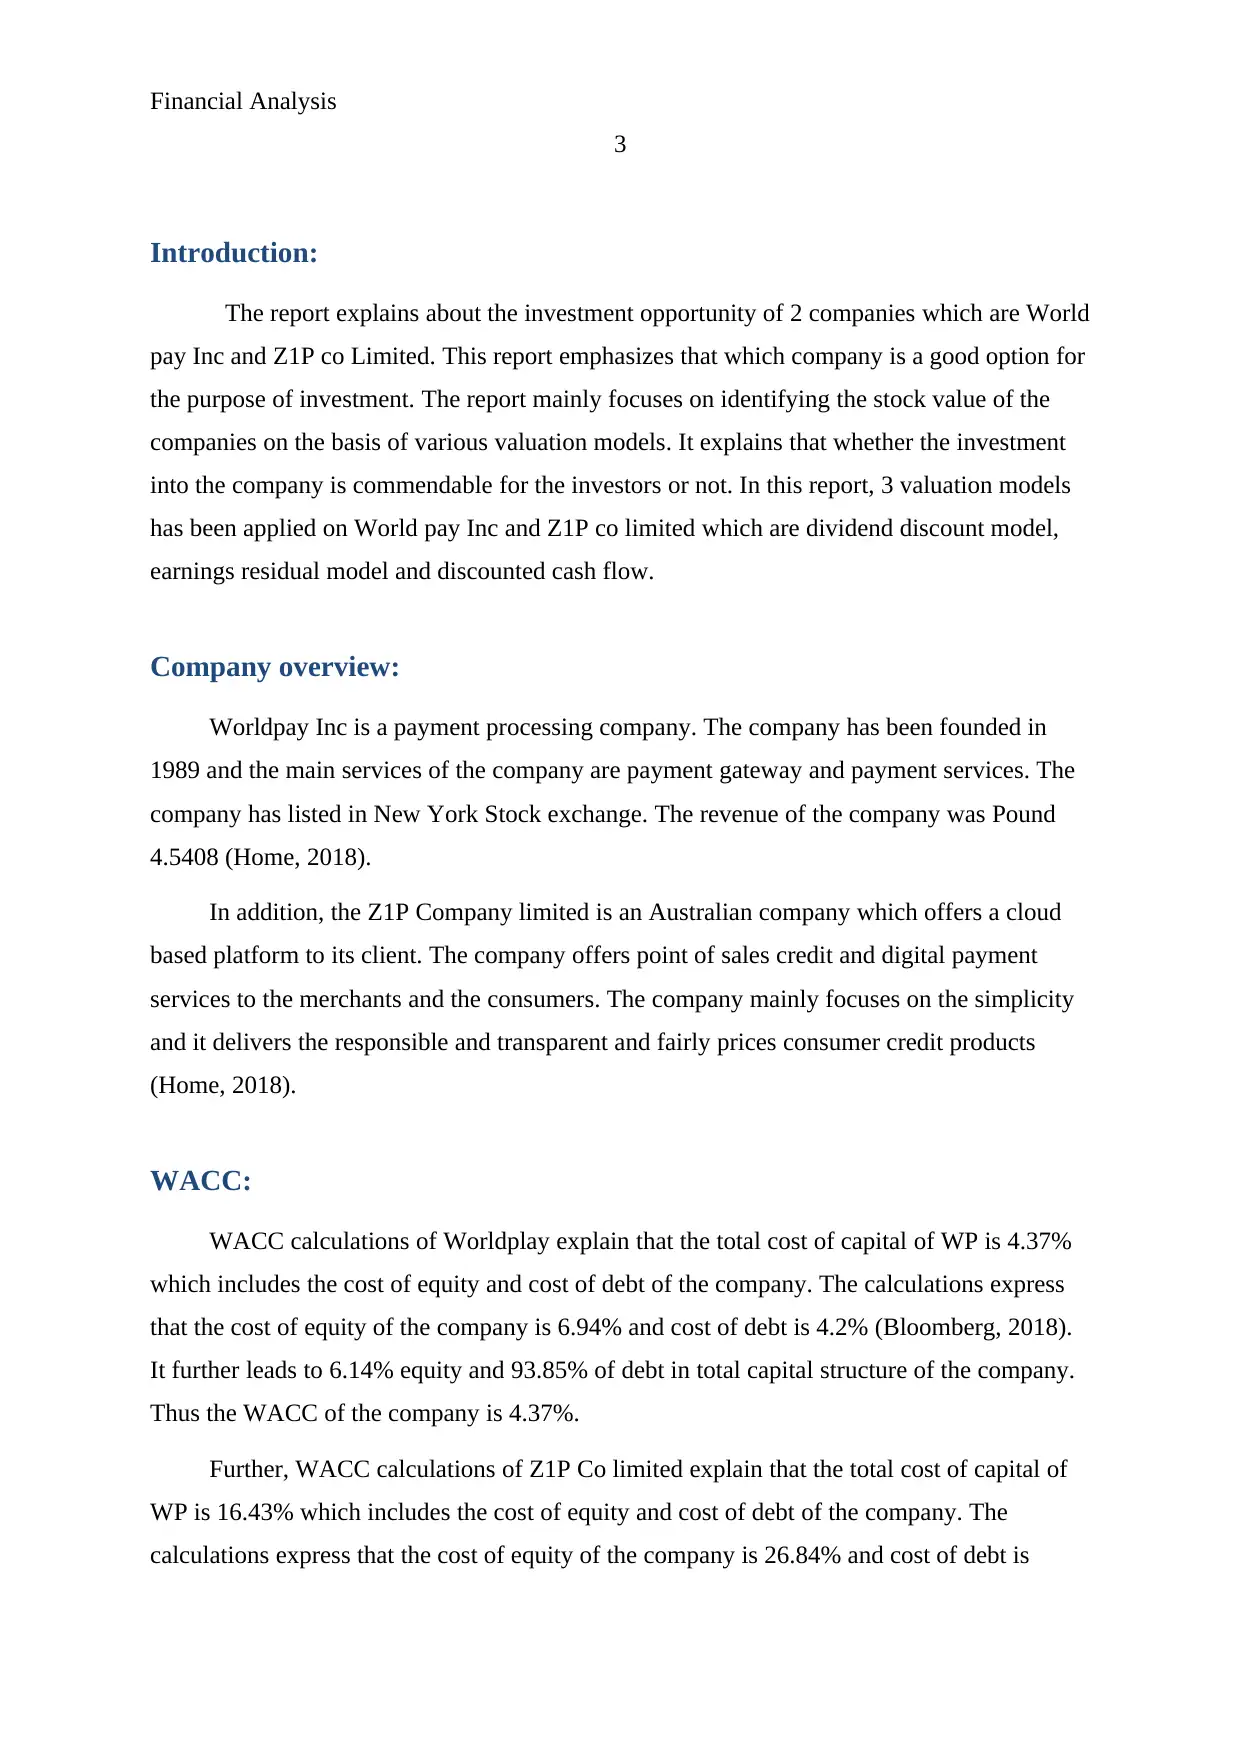
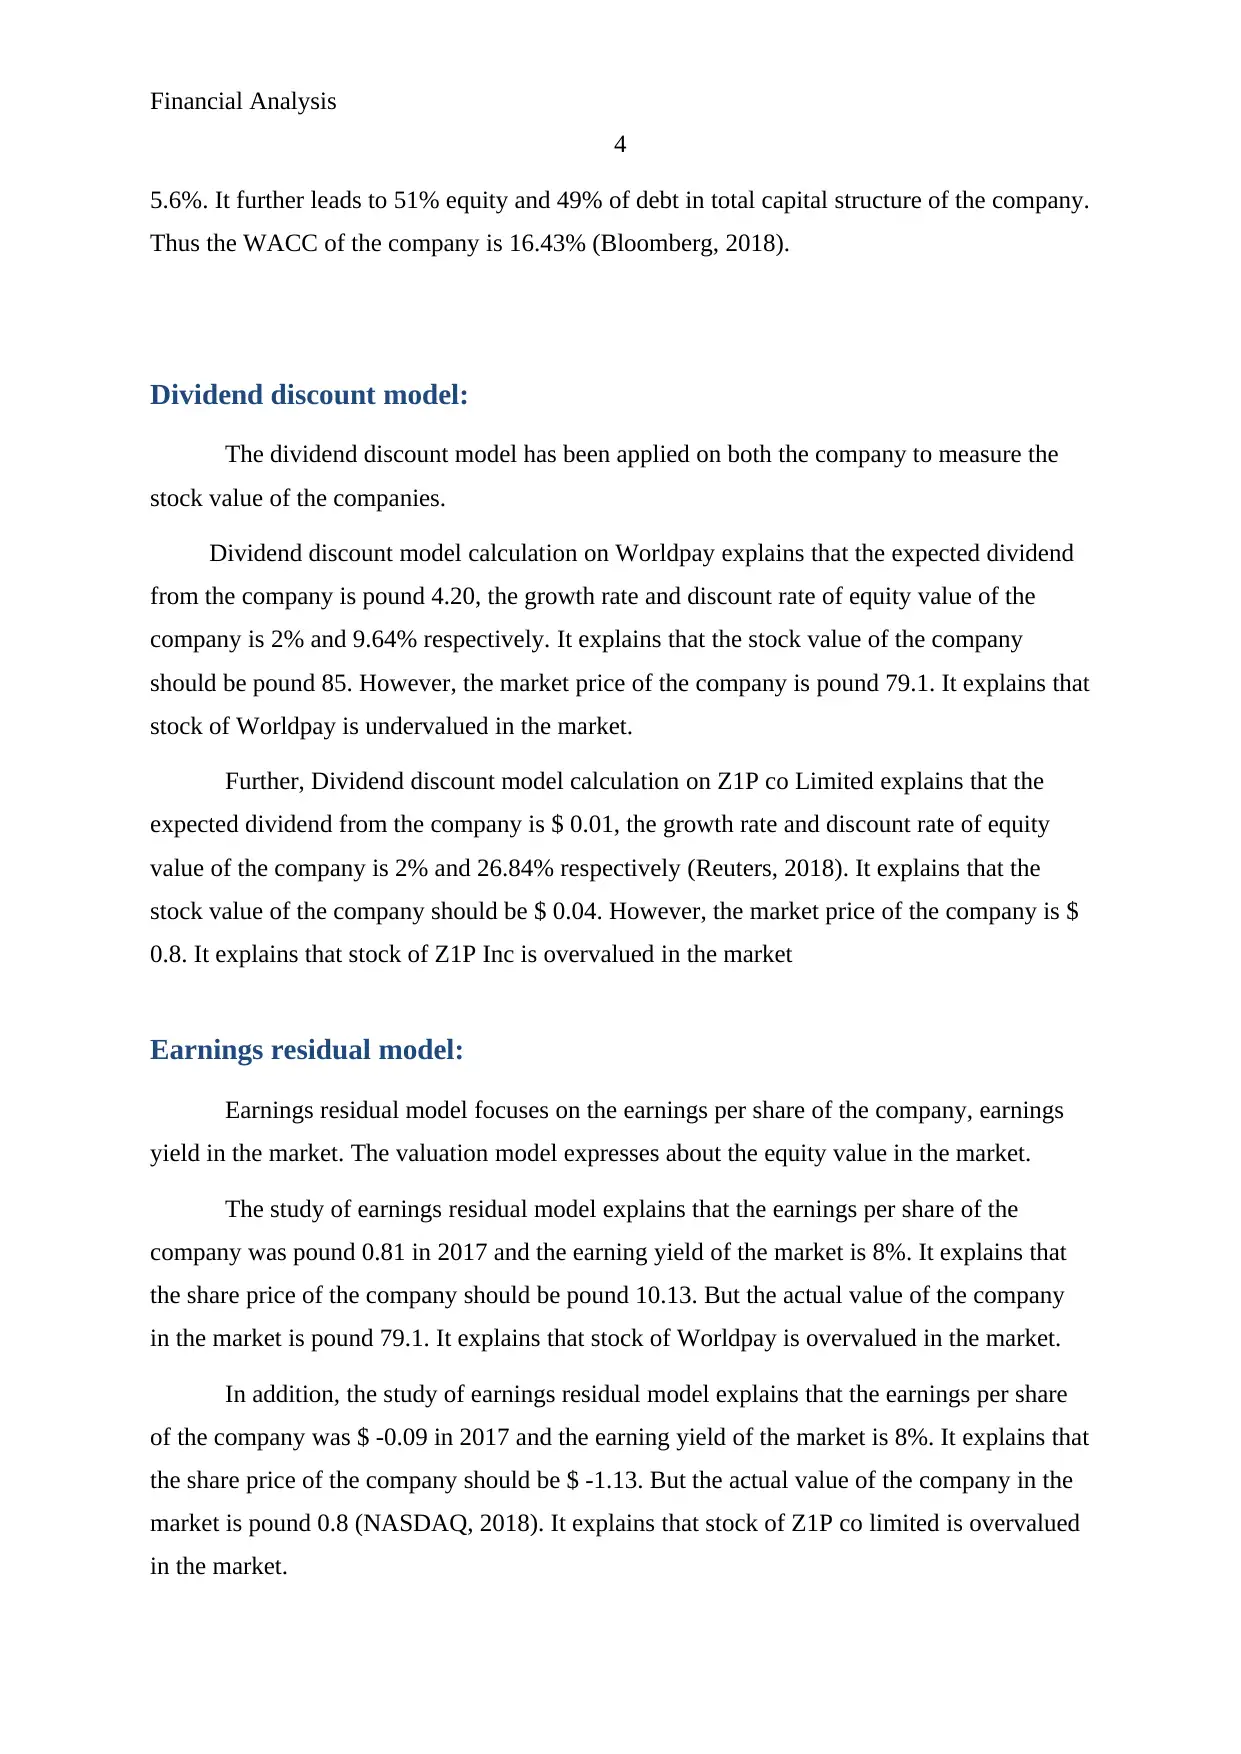
This report provides a comprehensive financial analysis comparing Worldpay Inc and Z1P Co Limited to determine the better investment opportunity. It employs valuation models such as the Dividend Discount Model (DDM), Earnings Residual Model, and Discounted Cash Flow (DCF) to assess the stock value of each company. The analysis reveals that Worldpay's stock is undervalued, presenting a favorable investment prospect, while Z1P Co Limited's stock appears overvalued. The report recommends investing in Worldpay Inc based on its potential for revenue generation, as indicated by the valuation models. The detailed calculations and sensitivity analyses are provided in the appendix, offering a thorough evaluation of the financial standing of both companies.
tabler-icon-diamond-filled.svg

Contribute Materials

Your contribution can guide someone’s learning journey. Share your documents today.
Document Page
Running Head: Financial Analysis
1
Project Report: Financial Analysis
tabler-icon-diamond-filled.svg

Secure Best Marks with AI Grader

Need help grading? Try our AI Grader for instant feedback on your assignments.
Document Page
Financial Analysis
2
Contents
Introduction:.....................................................................................................................3
Company overview:..........................................................................................................3
WACC:.............................................................................................................................3
Dividend discount model:.................................................................................................4
Earnings residual model:..................................................................................................4
Discounted cash flow model:............................................................................................5
Analysis:...........................................................................................................................5
Recommendation and conclusion:....................................................................................5
References:.......................................................................................................................6
Appendix:.........................................................................................................................7
Document Page
Financial Analysis
3
Introduction:
The report explains about the investment opportunity of 2 companies which are World
pay Inc and Z1P co Limited. This report emphasizes that which company is a good option for
the purpose of investment. The report mainly focuses on identifying the stock value of the
companies on the basis of various valuation models. It explains that whether the investment
into the company is commendable for the investors or not. In this report, 3 valuation models
has been applied on World pay Inc and Z1P co limited which are dividend discount model,
earnings residual model and discounted cash flow.
Company overview:
Worldpay Inc is a payment processing company. The company has been founded in
1989 and the main services of the company are payment gateway and payment services. The
company has listed in New York Stock exchange. The revenue of the company was Pound
4.5408 (Home, 2018).
In addition, the Z1P Company limited is an Australian company which offers a cloud
based platform to its client. The company offers point of sales credit and digital payment
services to the merchants and the consumers. The company mainly focuses on the simplicity
and it delivers the responsible and transparent and fairly prices consumer credit products
(Home, 2018).
WACC:
WACC calculations of Worldplay explain that the total cost of capital of WP is 4.37%
which includes the cost of equity and cost of debt of the company. The calculations express
that the cost of equity of the company is 6.94% and cost of debt is 4.2% (Bloomberg, 2018).
It further leads to 6.14% equity and 93.85% of debt in total capital structure of the company.
Thus the WACC of the company is 4.37%.
Further, WACC calculations of Z1P Co limited explain that the total cost of capital of
WP is 16.43% which includes the cost of equity and cost of debt of the company. The
calculations express that the cost of equity of the company is 26.84% and cost of debt is
Document Page
Financial Analysis
4
5.6%. It further leads to 51% equity and 49% of debt in total capital structure of the company.
Thus the WACC of the company is 16.43% (Bloomberg, 2018).
Dividend discount model:
The dividend discount model has been applied on both the company to measure the
stock value of the companies.
Dividend discount model calculation on Worldpay explains that the expected dividend
from the company is pound 4.20, the growth rate and discount rate of equity value of the
company is 2% and 9.64% respectively. It explains that the stock value of the company
should be pound 85. However, the market price of the company is pound 79.1. It explains that
stock of Worldpay is undervalued in the market.
Further, Dividend discount model calculation on Z1P co Limited explains that the
expected dividend from the company is $ 0.01, the growth rate and discount rate of equity
value of the company is 2% and 26.84% respectively (Reuters, 2018). It explains that the
stock value of the company should be $ 0.04. However, the market price of the company is $
0.8. It explains that stock of Z1P Inc is overvalued in the market
Earnings residual model:
Earnings residual model focuses on the earnings per share of the company, earnings
yield in the market. The valuation model expresses about the equity value in the market.
The study of earnings residual model explains that the earnings per share of the
company was pound 0.81 in 2017 and the earning yield of the market is 8%. It explains that
the share price of the company should be pound 10.13. But the actual value of the company
in the market is pound 79.1. It explains that stock of Worldpay is overvalued in the market.
In addition, the study of earnings residual model explains that the earnings per share
of the company was $ -0.09 in 2017 and the earning yield of the market is 8%. It explains that
the share price of the company should be $ -1.13. But the actual value of the company in the
market is pound 0.8 (NASDAQ, 2018). It explains that stock of Z1P co limited is overvalued
in the market.
tabler-icon-diamond-filled.svg

Secure Best Marks with AI Grader

Need help grading? Try our AI Grader for instant feedback on your assignments.
Document Page
Financial Analysis
5
Discounted cash flow model:
Lastly, the discounted cash flow model has been applied on the company to measure
the future cash flows of the company and the stock value of the company on the basis of the
cash flow.
The calculations of discounted cash flow explain that the terminal cash flows of the
company after 10 years would be 13,39,73,53,139.05. And the equity value of the company
would be 17,53,90,06,062.33. It explains that per share value of the company must be pound
108.74 (Morningstar, 2018).
Further, the z1P Co limited’s evaluation express that the terminal cash flows of the
company after 10 years would be $ - 96,30,834.36. And the equity value of the company
would be (1,67,39,543.76). It explains that the per share value of the company must be $ -
0.07 (Morningstar, 2018).
Analysis:
On the basis of the evaluation on both the companies, it has been found that the stock
value of the both the company are not according to the market price. Worldpay stock explains
that they are undervalued in the market. The DDM model and DCF model express that the
stock price has been undervalued in security market whereas the earnings model express that
the stock price is overvalued.
On the other hand, Z1P stock valuation process explains that the stock is overvalued.
All the valuation model express that the stock has been overvalued in the market. It explains
that the Worldpay Inc is performing better than the Z1P Co limited. The synergy analysis
explains that the performance of Worldpay inc is better option.
Recommendation and conclusion:
To recommend, the investors should invest in the Worldpay Inc as the sock price of the
company is undervalued if the investors buys the stock in current scenario and sales it after a
Document Page
Financial Analysis
6
while than the stock would offer great revenue to the investors. On the other hand, Z1P is not
a good choice for the purpose of investment.
References:
Bloomberg. 2018. Bonds and rates. [online]. Available at:
https://www.bloomberg.com/markets/rates-bonds/government-bonds/us (accessed 27/5/18).
Bloomberg. 2018. Bonds and rates. [online]. Available at:
https://www.bloomberg.com/markets/rates-bonds/government-bonds/australia (accessed
27/5/18).
Home. 2018. Worldpay inc. [online]. Available at: https://www.worldpay.com/ (accessed
27/5/18).
Home. 2018. Z1P co ltd. [online]. Available at: http://zipmoneylimited.com.au/company.html
(accessed 27/5/18).
Morningstar. 2018. Worldpay inc. [online]. Available at:
http://financials.morningstar.com/cash-flow/cf.html?t=Z1P&region=aus&culture=en-
US&platform=sal (accessed 27/5/18).
Morningstar. 2018. Z1P co ltd. [online]. Available at:
http://www.morningstar.com/stocks/XASX/Z1P/quote.html#sal-components-financials
(accessed 27/5/18).
NASDAQ. 2018. Worldpay Inc. [online]. Available at: https://www.nasdaq.com/symbol/wp
(accessed 27/5/18).
Reuters. 2018. Z1P co ltd. [online]. Available at:
https://www.reuters.com/finance/stocks/overview/Z1P.AX (accessed 27/5/18).
Document Page
Financial Analysis
7
Appendix:
Please refer to excel file for other calculations.
Sensitivity analysis - without Synergy effect
Long term growth
rate
4.37 1.5% 1.8% 2.0% 2.2% 2.4%
4.00% (5,273.33) (4,394.44) (3,955.00)
(3,595.45
)
(3,295.83
)
4.15% 1,906.02 (4,394.44) (3,955.00)
(3,595.45
)
(3,295.83
)
WACC 4.37% 1,810.07 (4,394.44) (3,955.00)
(3,595.45
)
(3,295.83
)
4.50% 1,757.78 (4,394.44) (3,955.00)
(3,595.45
)
(3,295.83
)
4.85% 1,630.93 (4,394.44) (3,955.00)
(3,595.45
)
(3,295.83
)
0.8
Sensitivity analysis - without Synergy effect
Long term growth
rate
26.17 1.5% 1.8% 2.0% 2.2% 2.4%
24.00% (53.33) (44.44) (40.00) (36.36) (33.33)
25.00% 3.20 (44.44) (40.00) (36.36) (33.33)
WACC 26.17% 3.06 (44.44) (40.00) (36.36) (33.33)
27.00% 2.96 (44.44) (40.00) (36.36) (33.33)
28.00% 2.86 (44.44) (40.00) (36.36) (33.33)
108.74
Sensitivity analysis - without Synergy effect
Long term growth
rate
4.37 1.5% 1.8% 2.0% 2.2% 2.4%
4.00% (7,249.33) (6,041.11) (5,437.00) (4,942.73) (4,530.83)
4.15% 4,103.40 (6,041.11) (5,437.00) (4,942.73) (4,530.83)
WACC 4.37% 3,788.85 (6,041.11) (5,437.00) (4,942.73) (4,530.83)
4.50% 3,624.67 (6,041.11) (5,437.00) (4,942.73) (4,530.83)
4.85% 3,245.97 (6,041.11) (5,437.00) (4,942.73) (4,530.83)
tabler-icon-diamond-filled.svg

Paraphrase This Document

Need a fresh take? Get an instant paraphrase of this document with our AI Paraphraser
Document Page
Financial Analysis
8
-0.07115
Sensitivity analysis - without Synergy effect
Long term growth
rate
26.17 1.5% 1.8% 2.0% 2.2% 2.4%
24.00% 4.74 3.95 3.56 3.23 2.96
25.00% (0.30) 3.95 3.56 3.23 2.96
WACC 26.17% (0.29) 3.95 3.56 3.23 2.96
27.00% (0.28) 3.95 3.56 3.23 2.96
28.00% (0.27) 3.95 3.56 3.23 2.96
chevron_up_icon
1 out of 8
circle_padding
hide_on_mobile
zoom_out_icon
logo.png

Your All-in-One AI-Powered Toolkit for Academic Success.

Available 24*7 on WhatsApp / Email

[object Object]