X-Fit Chain Gyms: January 2018 Spreadsheet Report and Analysis
VerifiedAdded on 2021/04/21
|25
|2823
|289
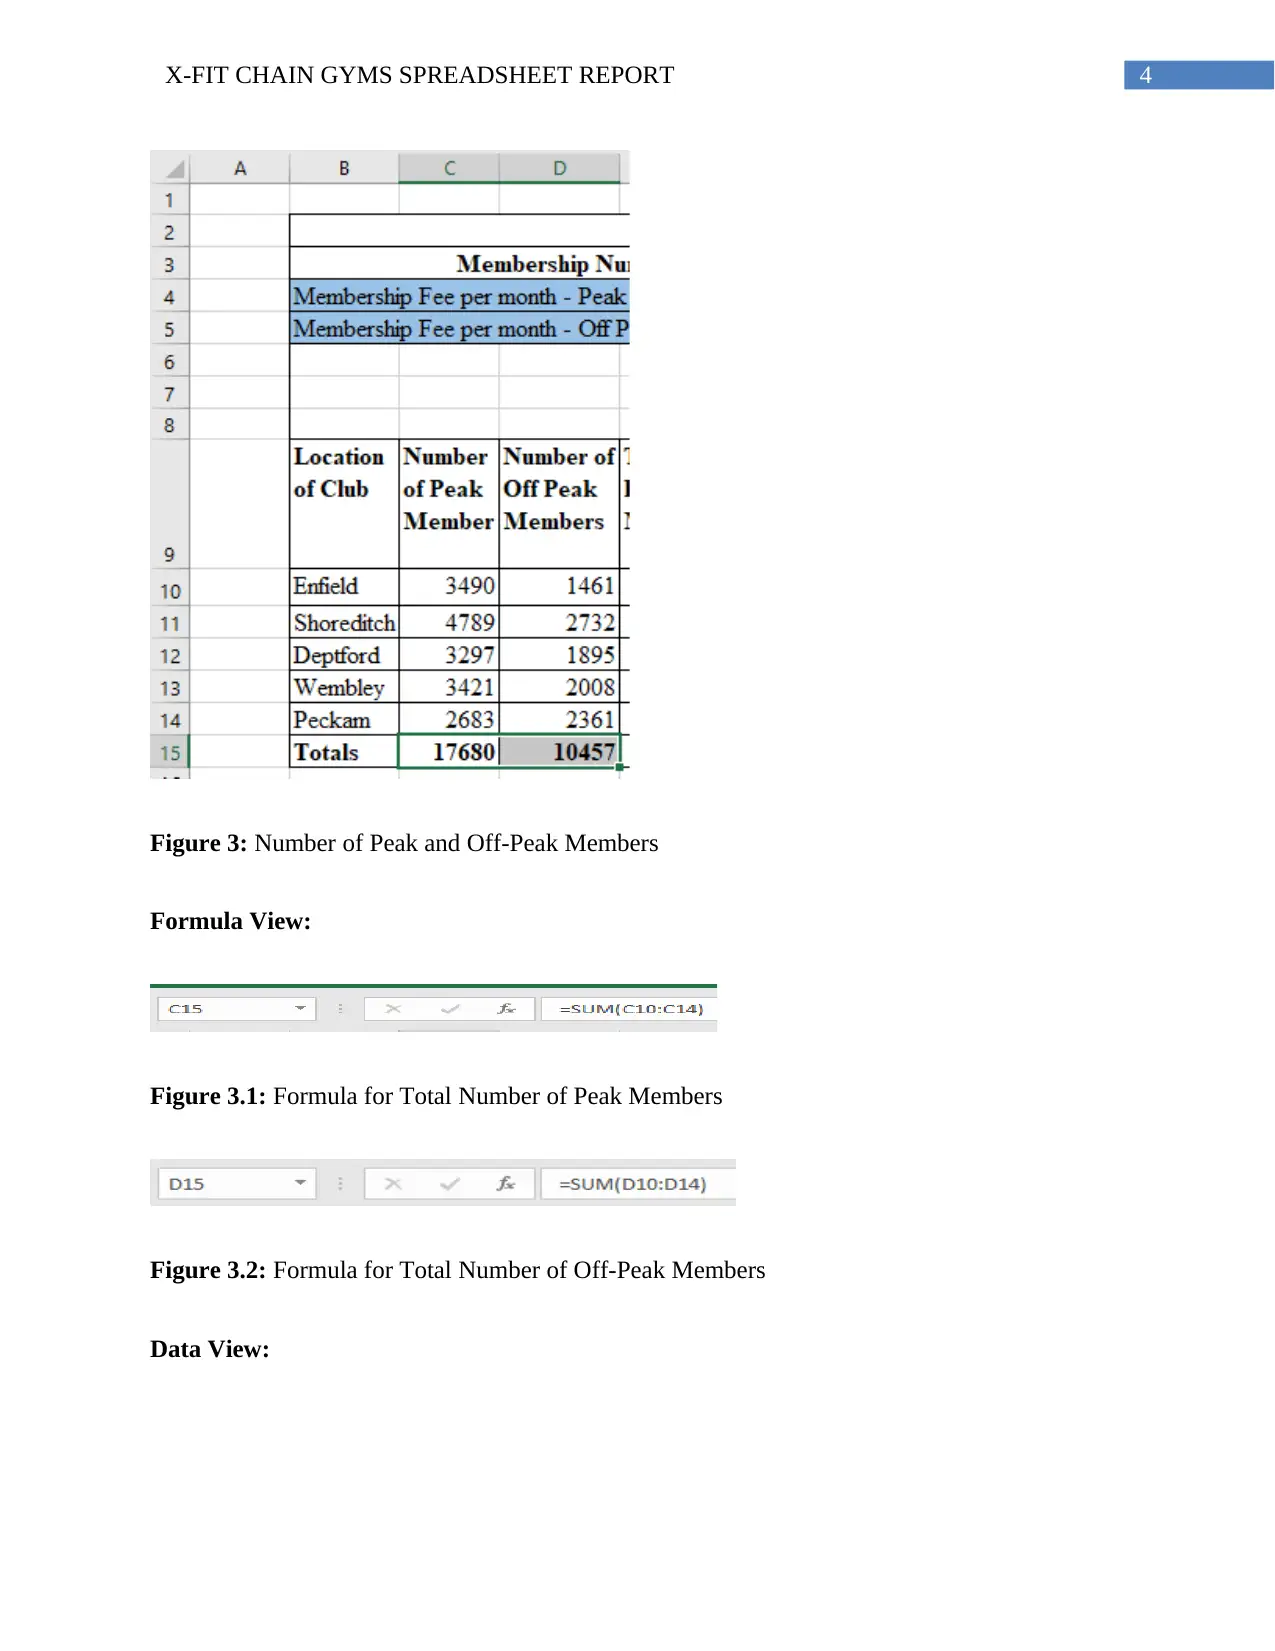
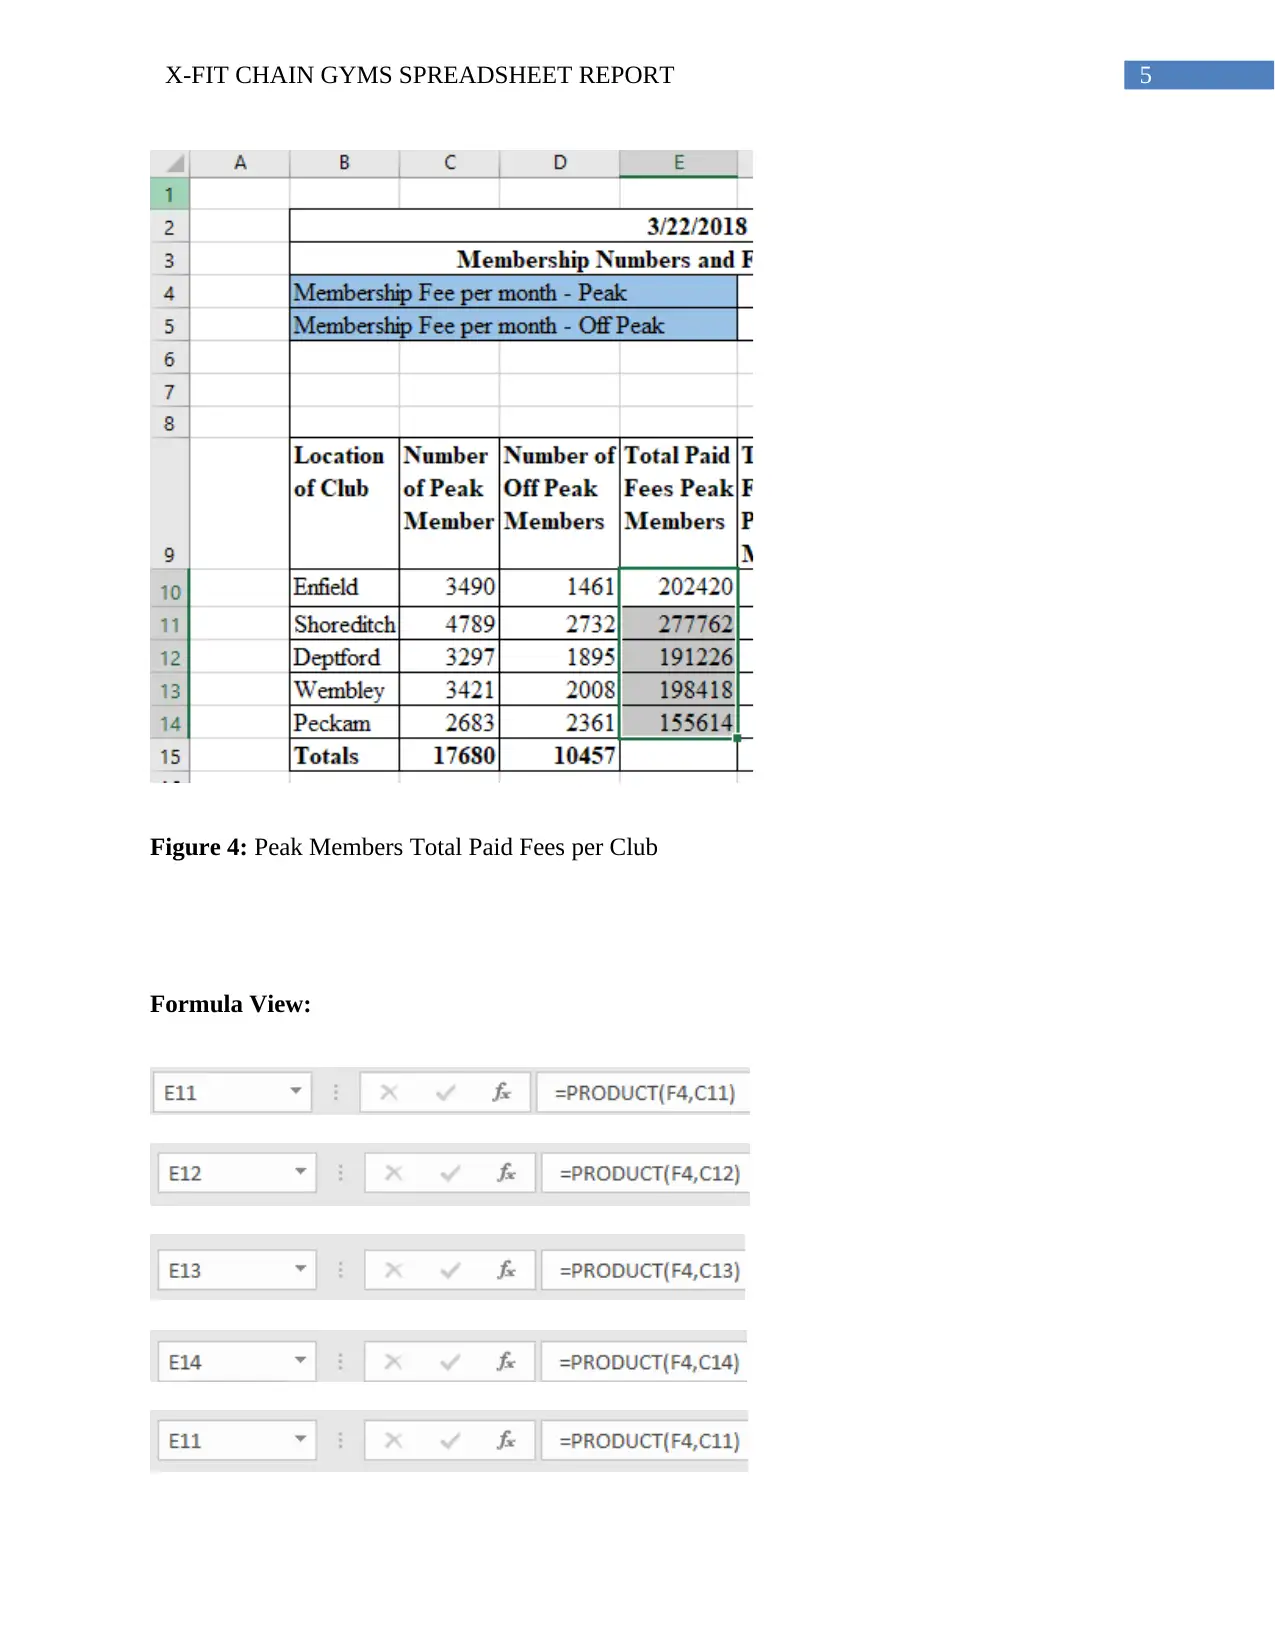
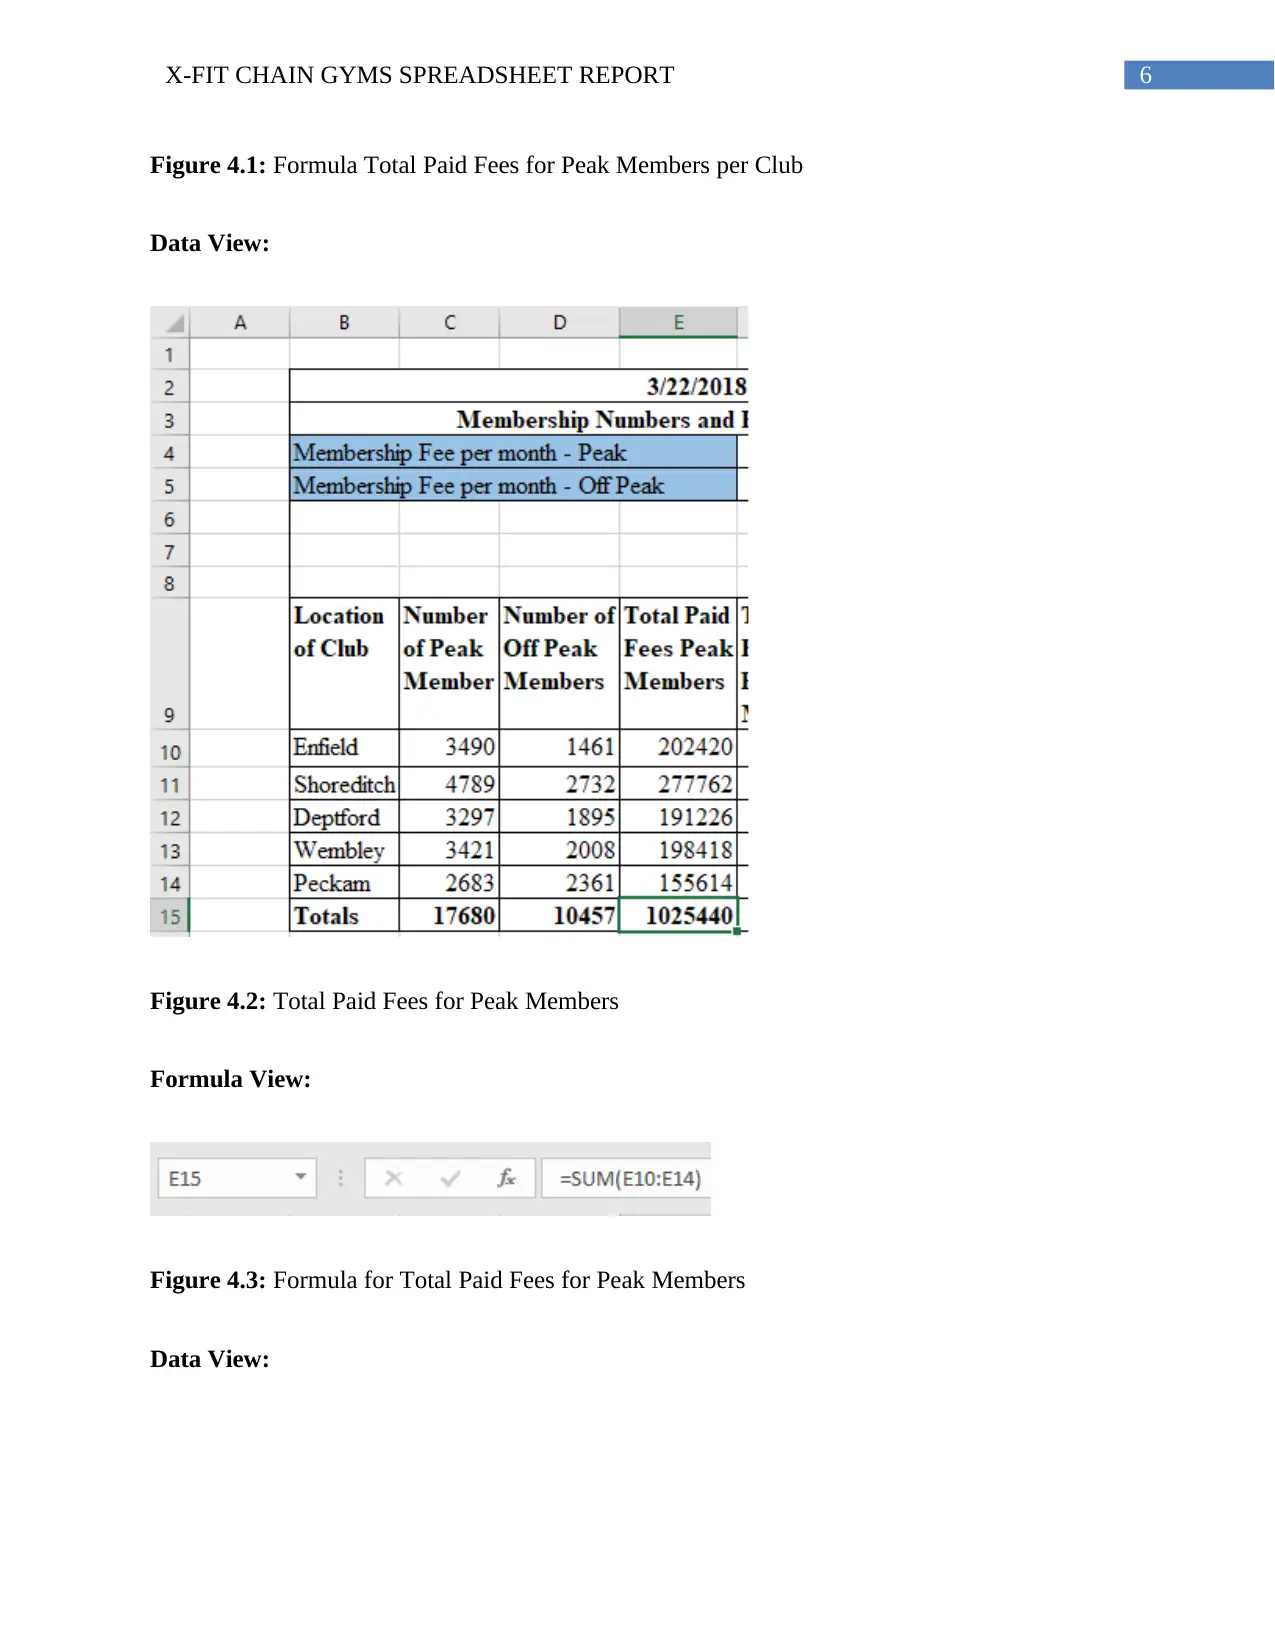
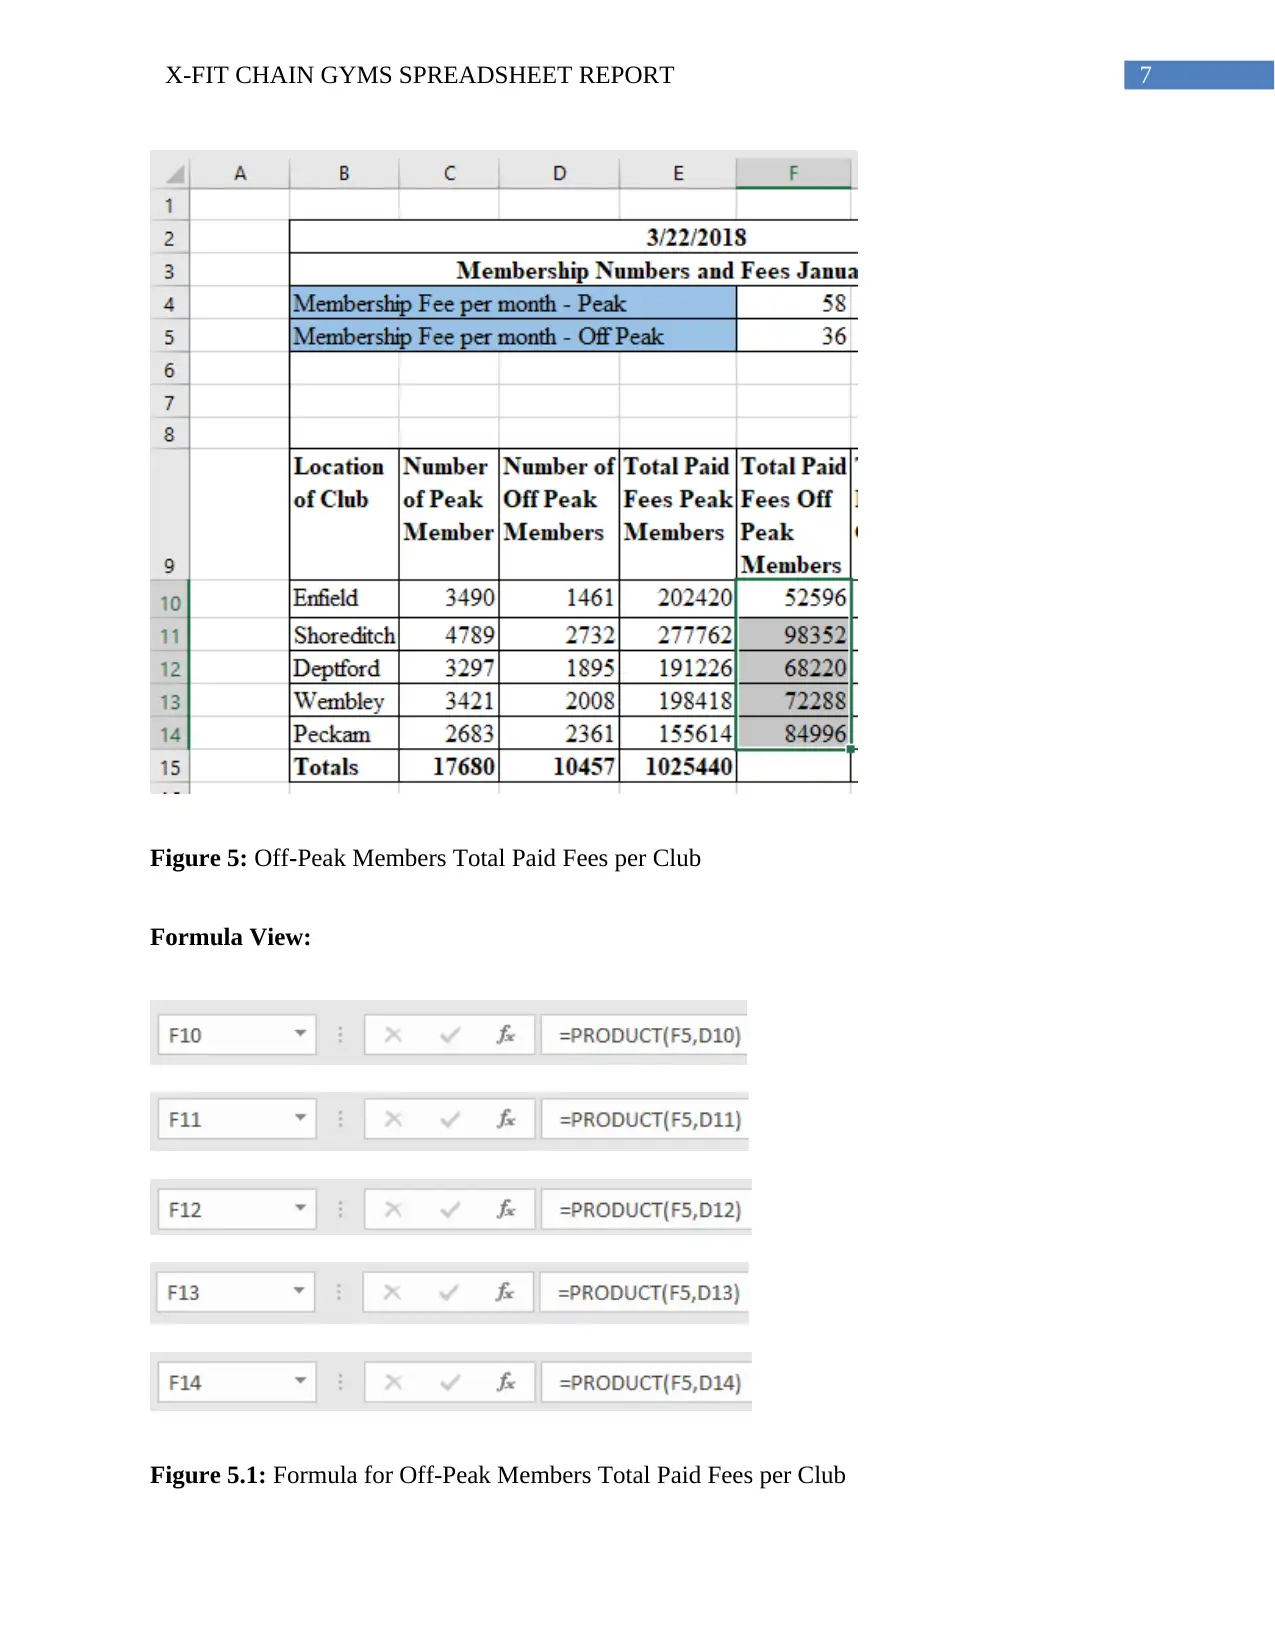
Report
AI Summary
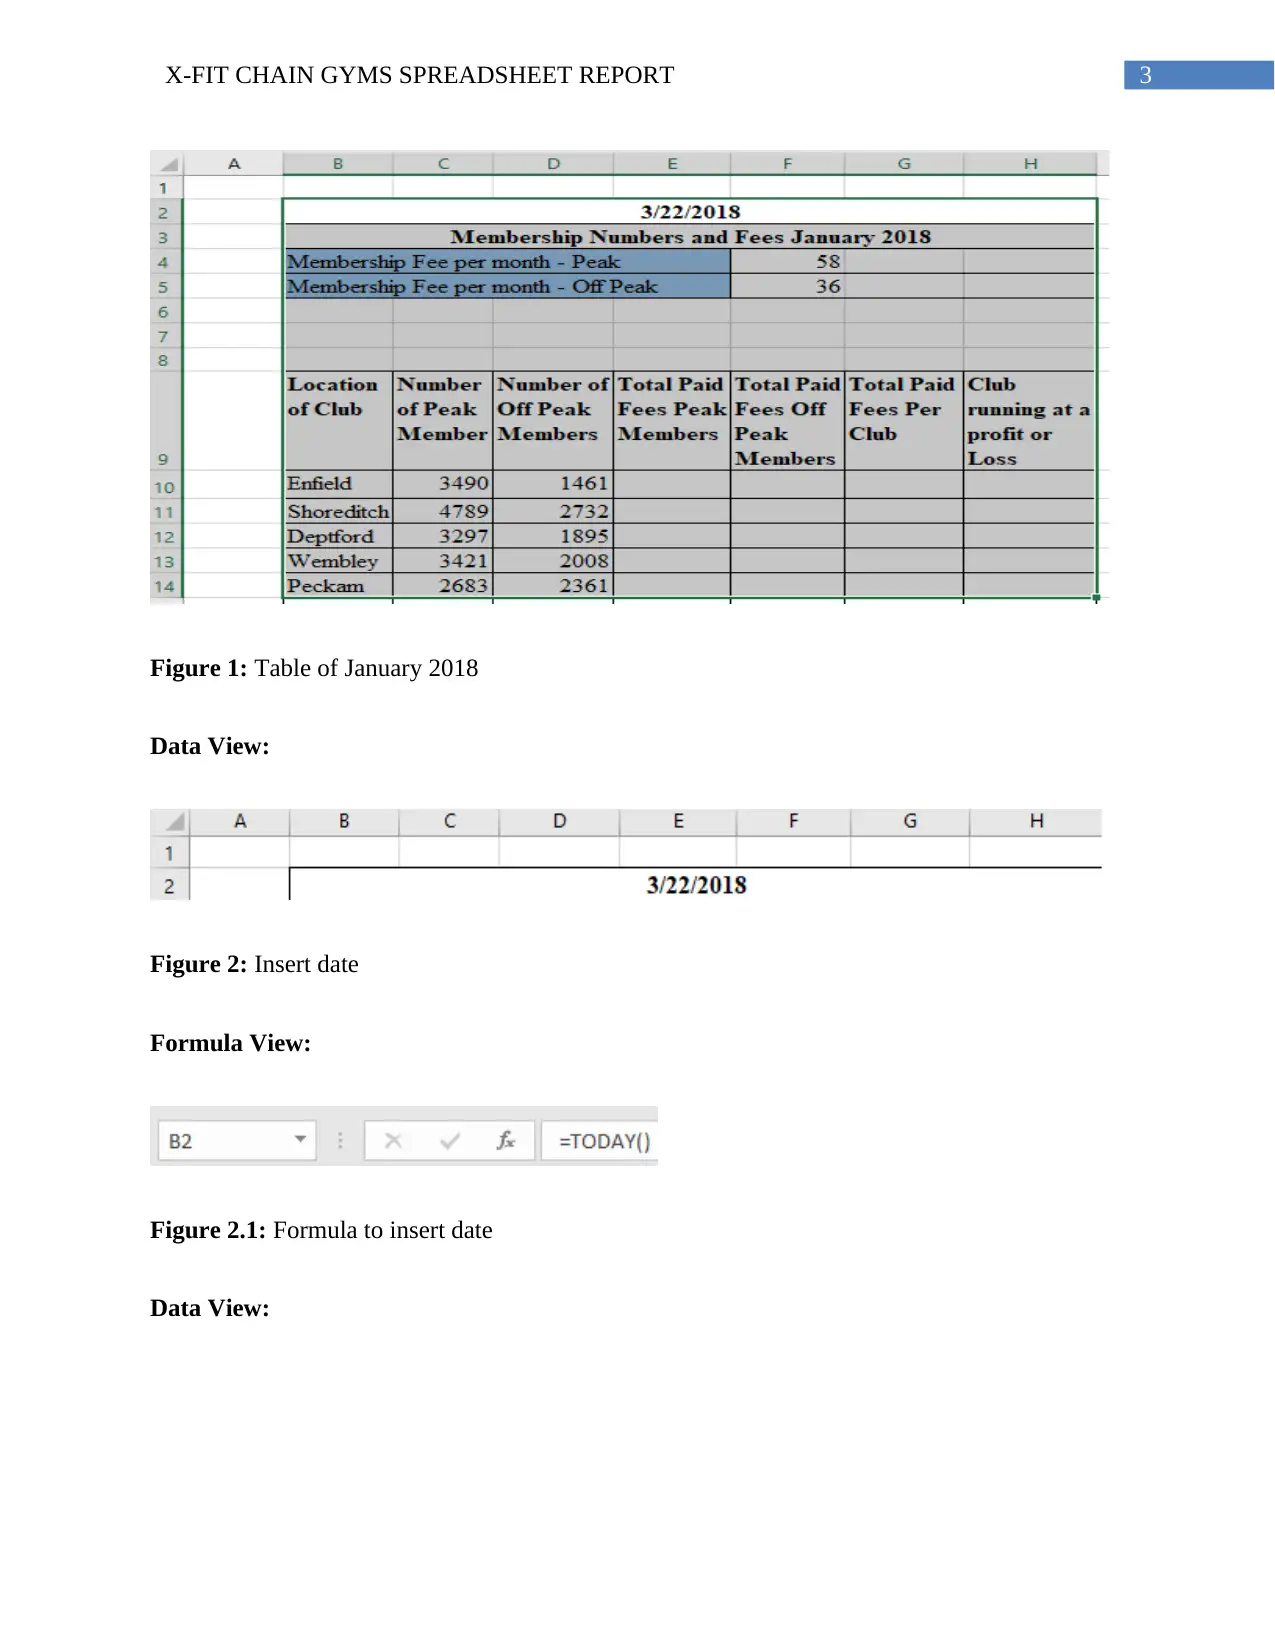
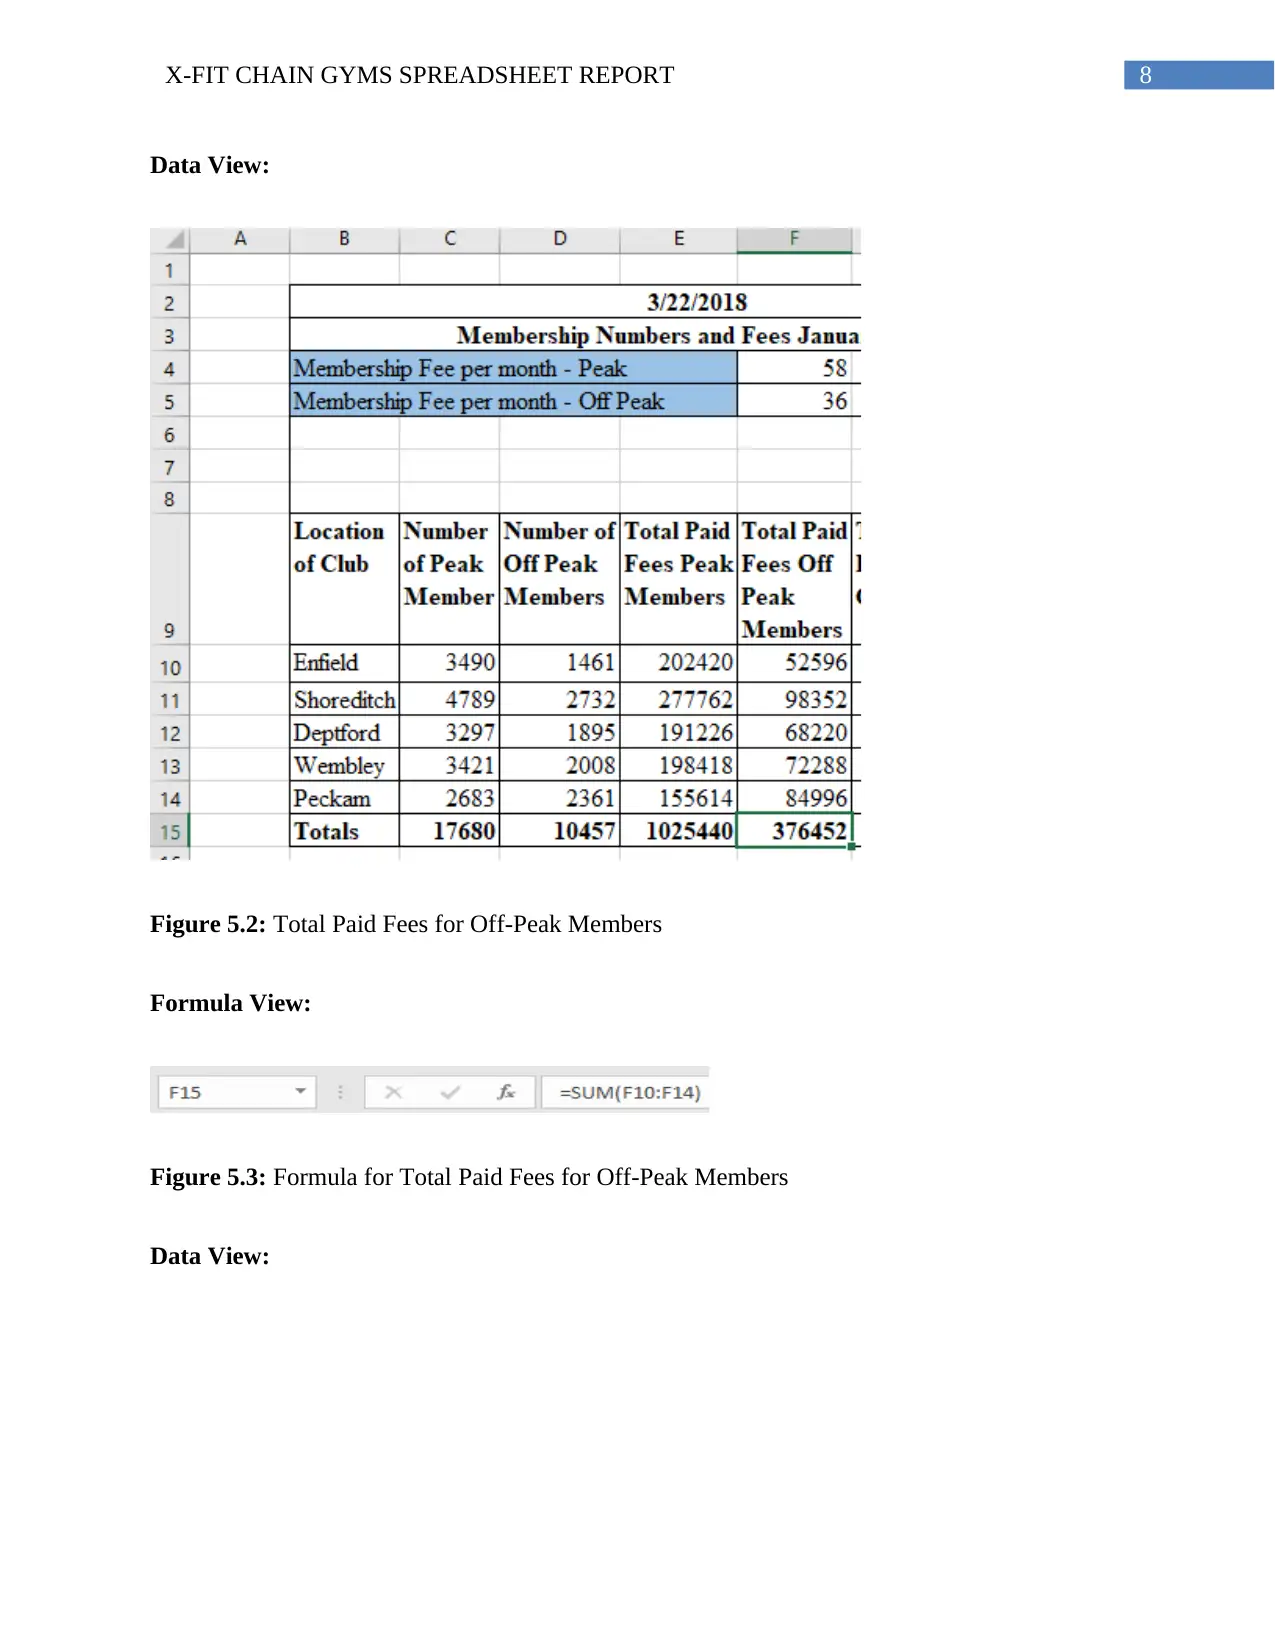
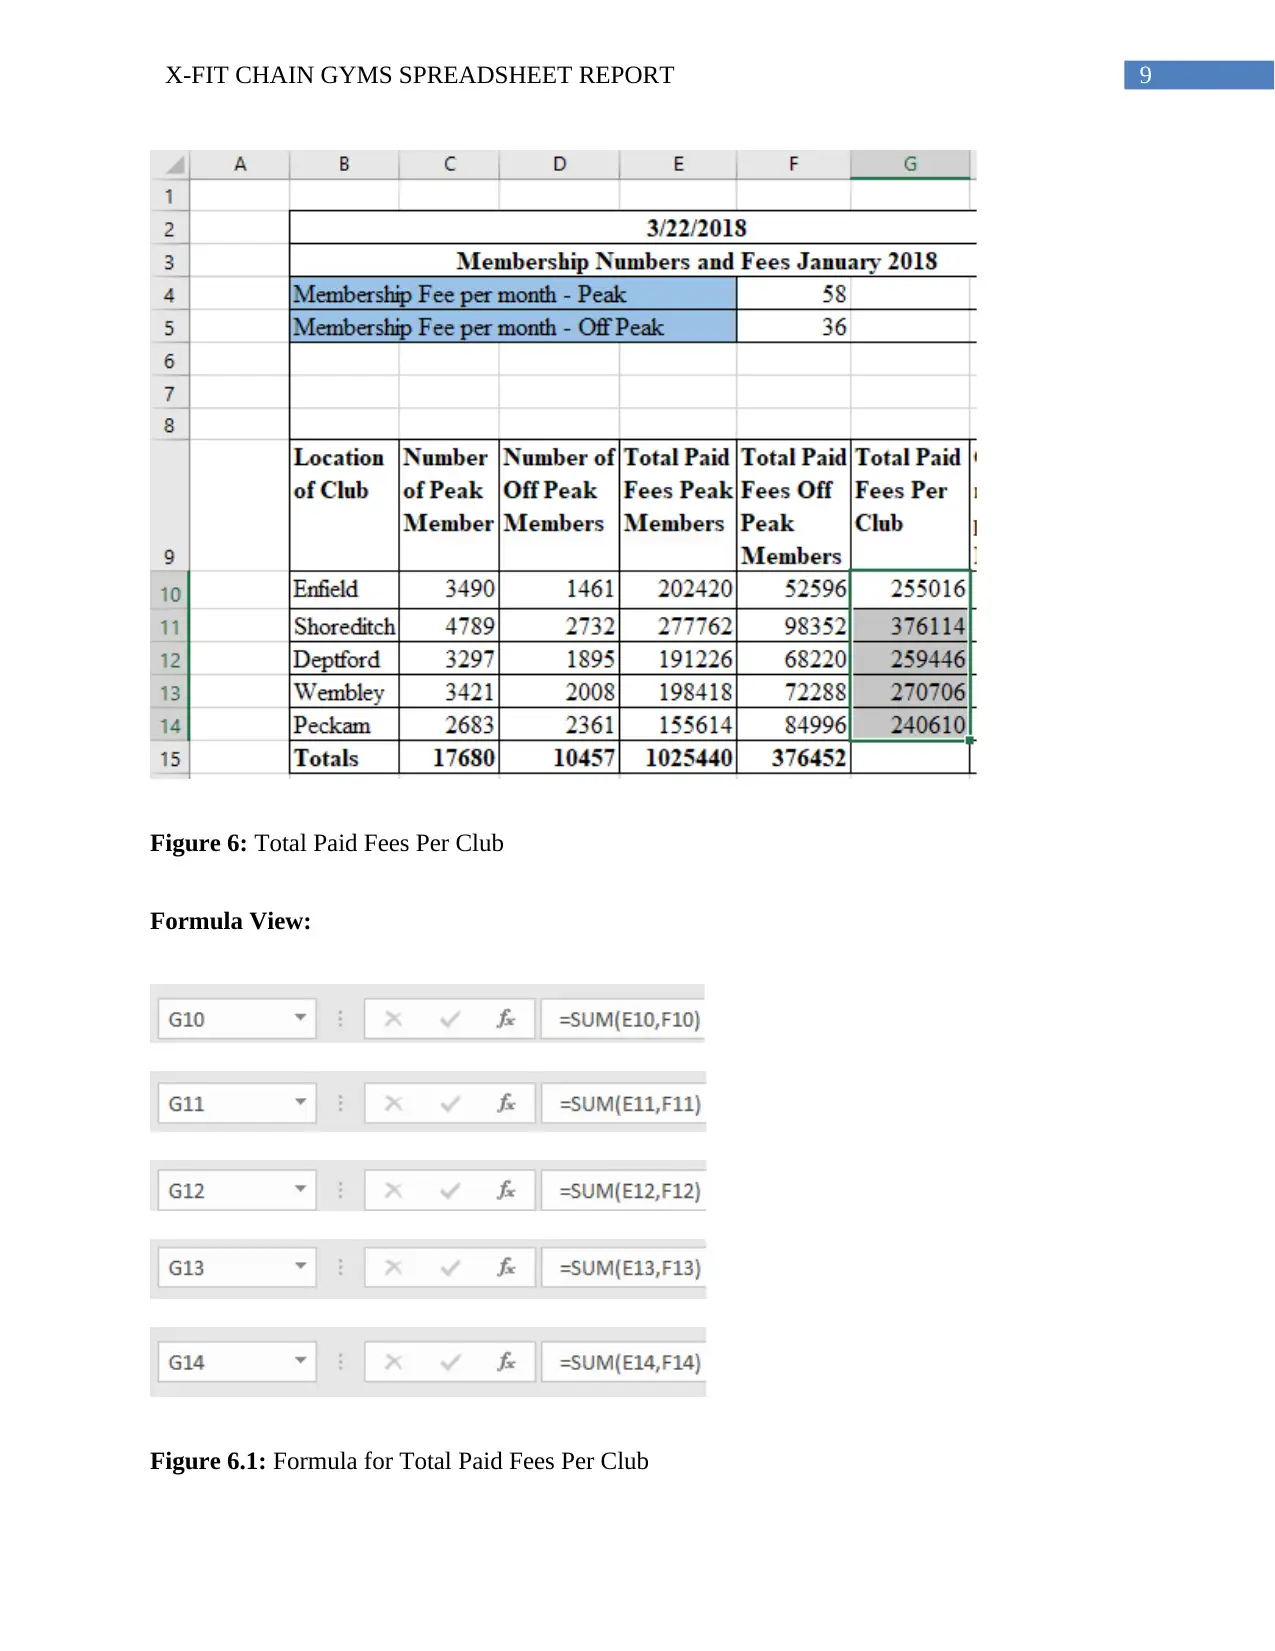
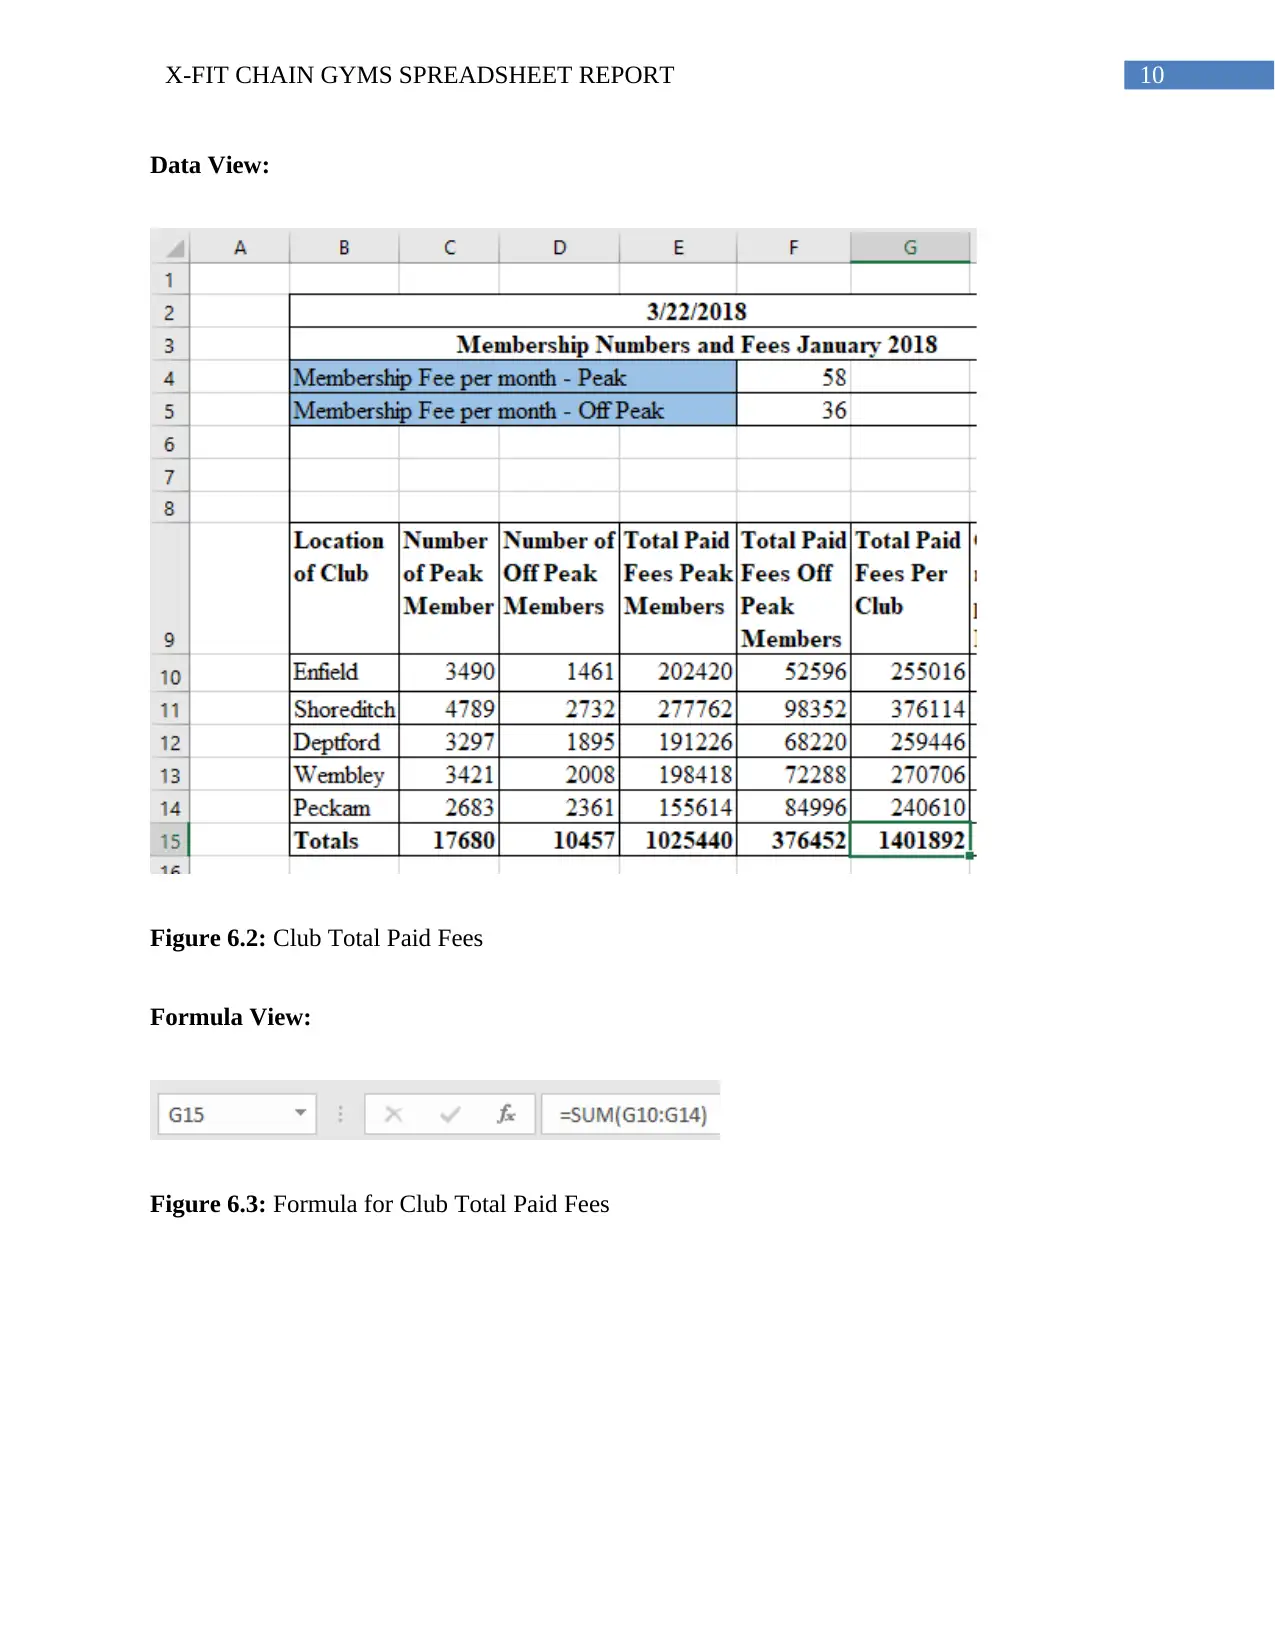
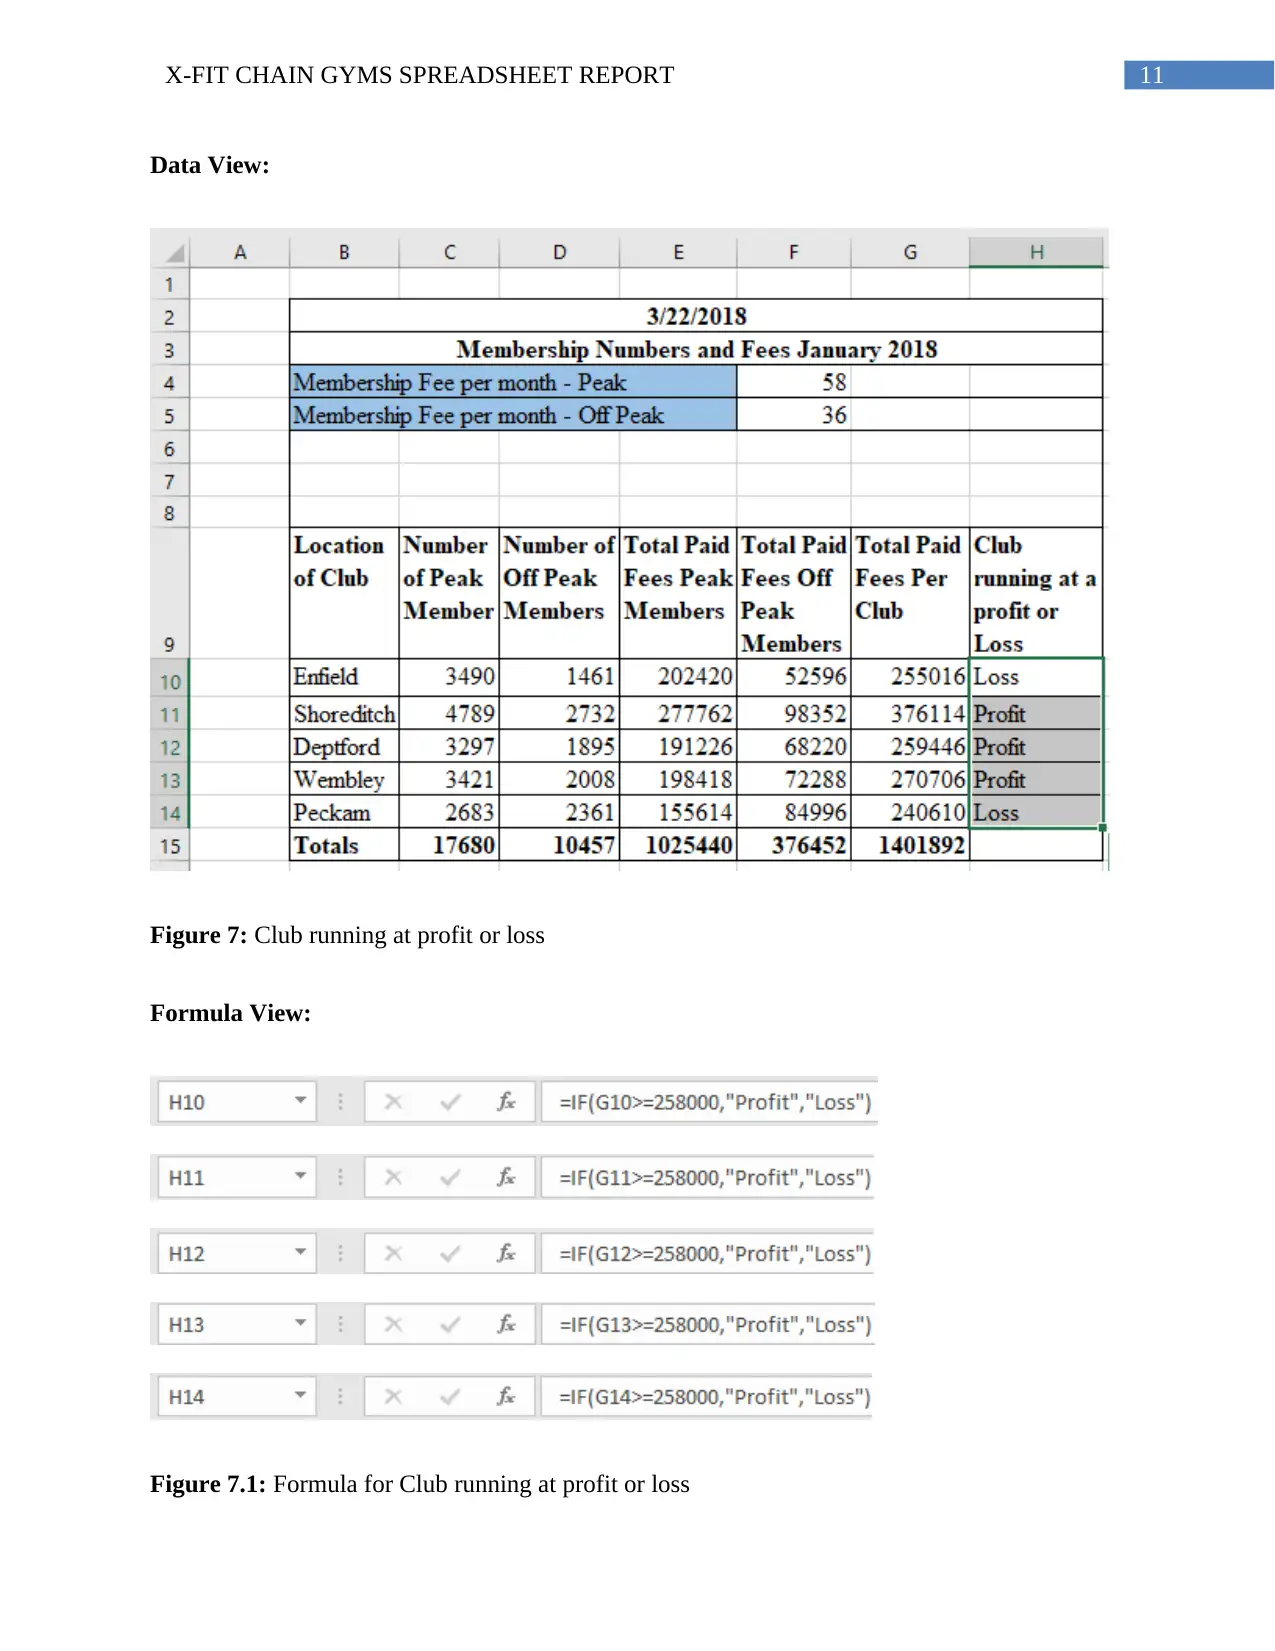
This report presents a financial analysis of X-Fit Chain Gyms based on data from January 2018. It explores the use of spreadsheets to analyze membership numbers and fees, distinguishing between peak and off-peak seasons across five London locations. The report details the financial performance of each club, identifying those operating at a profit or loss, and calculates the overall income. It also discusses the benefits of Microsoft Office applications like Word, Excel, and PowerPoint for business productivity, and highlights technological advancements such as interactive virtual bulletin boards, cloud-based collaboration, and resourcing through cloud computing. The conclusion summarizes the findings, recommending the adoption of new technologies to improve the quality and productivity of the business, ultimately aiming to enhance the gym's financial performance and member experience.
1 out of 25


Your All-in-One AI-Powered Toolkit for Academic Success.
+13062052269
info@desklib.com
Available 24*7 on WhatsApp / Email
![[object Object]](/_next/static/media/star-bottom.7253800d.svg)
Copyright © 2020–2026 A2Z Services. All Rights Reserved. Developed and managed by ZUCOL.