Comprehensive Financial Analysis of Xaar PLC: 2016-2017 Performance
VerifiedAdded on 2023/04/06
|12
|2336
|270
Report
AI Summary
This report presents a comprehensive financial analysis of Xaar PLC, focusing on the years 2016 and 2017. The analysis begins with an introduction to ratio analysis and its importance in evaluating a company's financial health. The report is structured into three key sections. Section 1 identifies and analyzes six crucial financial ratios: current ratio, gross profit margin, leverage ratio (gearing ratio), stock turnover days, P/E ratio, and return on equity. Section 2 delves into the implications of these trends, offering a detailed discussion of each ratio's impact and proposing potential strategies to improve financial performance. This includes suggestions for improving liquidity, maintaining gross profit consistency, optimizing debt-to-equity ratios, improving P/E ratios, addressing inventory turnover issues, and enhancing return on equity. Finally, Section 3 provides the detailed workings of all the ratios, including those highlighted in Section 1, calculated based on formulas and figures from Xaar PLC's annual reports for both years. The report aims to provide a clear understanding of Xaar PLC's financial position and guide strategic decision-making.
Running Head: FINANCIAL ANALYSIS OF XAAR 0
Financial Analysis
Financial Analysis
Paraphrase This Document
Need a fresh take? Get an instant paraphrase of this document with our AI Paraphraser
FINANCIAL ANALYSIS OF XAAR 1
Contents
Section 1..........................................................................................................................................3
Six Important Ratios....................................................................................................................3
Section 2..........................................................................................................................................4
Discussion and Possible Strategies..............................................................................................4
Section 3..........................................................................................................................................5
Workings of the Ratios................................................................................................................5
References........................................................................................................................................7
FINANCIAL ANALYSIS OF XAAR 2
Introduction
Ratio analysis is one of the techniques adopted by almost every company to determine the
strength of the company in terms of the financial performance. With the help of the ratio analysis
technique the company can evaluate the new strategies if required to improve the performance
and the position in the comparison table with the competitors. In this report the ratio analysis of
the XAAR PLC has been carried out in detail taking into consideration, almost all ratios. The
report is also segregate into the three major sections where in the first section the six important
ratios are considered and analyzed. In the second section the implications and the discussion is
created on the basis of the section 1. Lastly in the section 3 the working of all the ratios is
attached to get a deeper insight of the financial statements and the figures.
Section 1
Six Important Ratios
This section presents the importance of six major ratios that are of crucial nature and which
needs regular revision from the side of the XAAR PLC.
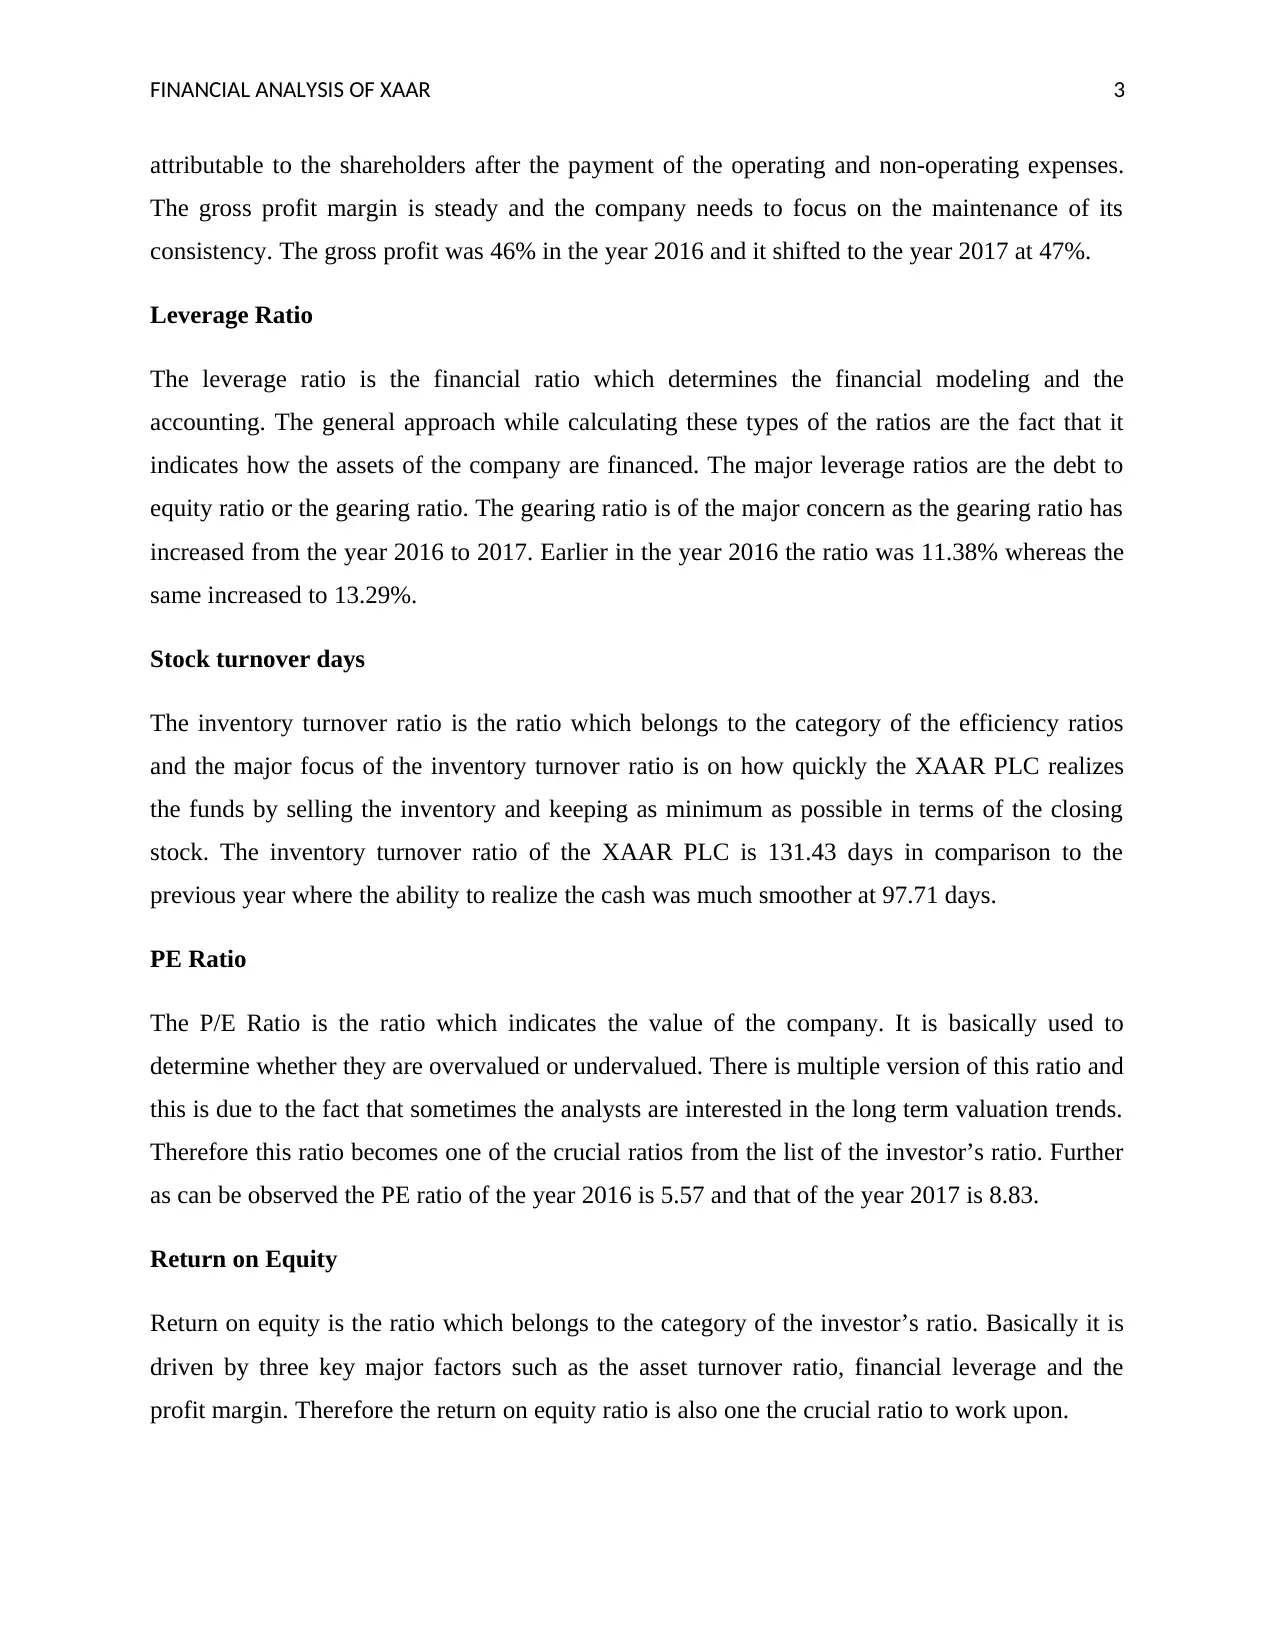
Liquidity ratios
Liquidity ratios are basically calculated to analyze the liquid position of the company. The
liquidity of the XAAR can be measured only with the help of these ratios along with the
comparison over the period of last year. One such ratio that is critical and is of core importance
is the current ratio. The current ratio determines the ability of the company to pay back the
current liabilities by realizing the cash from the current assets. As it can be observed from the
table the current asset ratio of the XAAR is 5.27 in comparison to the previous year where the
value was 5.77.
Gross Profit Margin
The gross profit margin belongs to the category of the profitability ratio which is the most
demanding ratio in the list of the entire ratios. The gross profit ratio is the second king of the
company as the earnings of the investors are mainly dependent on how much net profit is
Introduction
Ratio analysis is one of the techniques adopted by almost every company to determine the
strength of the company in terms of the financial performance. With the help of the ratio analysis
technique the company can evaluate the new strategies if required to improve the performance
and the position in the comparison table with the competitors. In this report the ratio analysis of
the XAAR PLC has been carried out in detail taking into consideration, almost all ratios. The
report is also segregate into the three major sections where in the first section the six important
ratios are considered and analyzed. In the second section the implications and the discussion is
created on the basis of the section 1. Lastly in the section 3 the working of all the ratios is
attached to get a deeper insight of the financial statements and the figures.
Section 1
Six Important Ratios
This section presents the importance of six major ratios that are of crucial nature and which
needs regular revision from the side of the XAAR PLC.
Liquidity ratios
Liquidity ratios are basically calculated to analyze the liquid position of the company. The
liquidity of the XAAR can be measured only with the help of these ratios along with the
comparison over the period of last year. One such ratio that is critical and is of core importance
is the current ratio. The current ratio determines the ability of the company to pay back the
current liabilities by realizing the cash from the current assets. As it can be observed from the
table the current asset ratio of the XAAR is 5.27 in comparison to the previous year where the
value was 5.77.
Gross Profit Margin
The gross profit margin belongs to the category of the profitability ratio which is the most
demanding ratio in the list of the entire ratios. The gross profit ratio is the second king of the
company as the earnings of the investors are mainly dependent on how much net profit is
⊘ This is a preview!⊘
Do you want full access?
Subscribe today to unlock all pages.
Trusted by 1+ million students worldwide
FINANCIAL ANALYSIS OF XAAR 3
attributable to the shareholders after the payment of the operating and non-operating expenses.
The gross profit margin is steady and the company needs to focus on the maintenance of its
consistency. The gross profit was 46% in the year 2016 and it shifted to the year 2017 at 47%.
Leverage Ratio
The leverage ratio is the financial ratio which determines the financial modeling and the
accounting. The general approach while calculating these types of the ratios are the fact that it
indicates how the assets of the company are financed. The major leverage ratios are the debt to
equity ratio or the gearing ratio. The gearing ratio is of the major concern as the gearing ratio has
increased from the year 2016 to 2017. Earlier in the year 2016 the ratio was 11.38% whereas the
same increased to 13.29%.
Stock turnover days
The inventory turnover ratio is the ratio which belongs to the category of the efficiency ratios
and the major focus of the inventory turnover ratio is on how quickly the XAAR PLC realizes
the funds by selling the inventory and keeping as minimum as possible in terms of the closing
stock. The inventory turnover ratio of the XAAR PLC is 131.43 days in comparison to the
previous year where the ability to realize the cash was much smoother at 97.71 days.
PE Ratio
The P/E Ratio is the ratio which indicates the value of the company. It is basically used to
determine whether they are overvalued or undervalued. There is multiple version of this ratio and
this is due to the fact that sometimes the analysts are interested in the long term valuation trends.
Therefore this ratio becomes one of the crucial ratios from the list of the investor’s ratio. Further
as can be observed the PE ratio of the year 2016 is 5.57 and that of the year 2017 is 8.83.
Return on Equity
Return on equity is the ratio which belongs to the category of the investor’s ratio. Basically it is
driven by three key major factors such as the asset turnover ratio, financial leverage and the
profit margin. Therefore the return on equity ratio is also one the crucial ratio to work upon.
Paraphrase This Document
Need a fresh take? Get an instant paraphrase of this document with our AI Paraphraser
FINANCIAL ANALYSIS OF XAAR 4
Section 2
Discussion and Possible Strategies
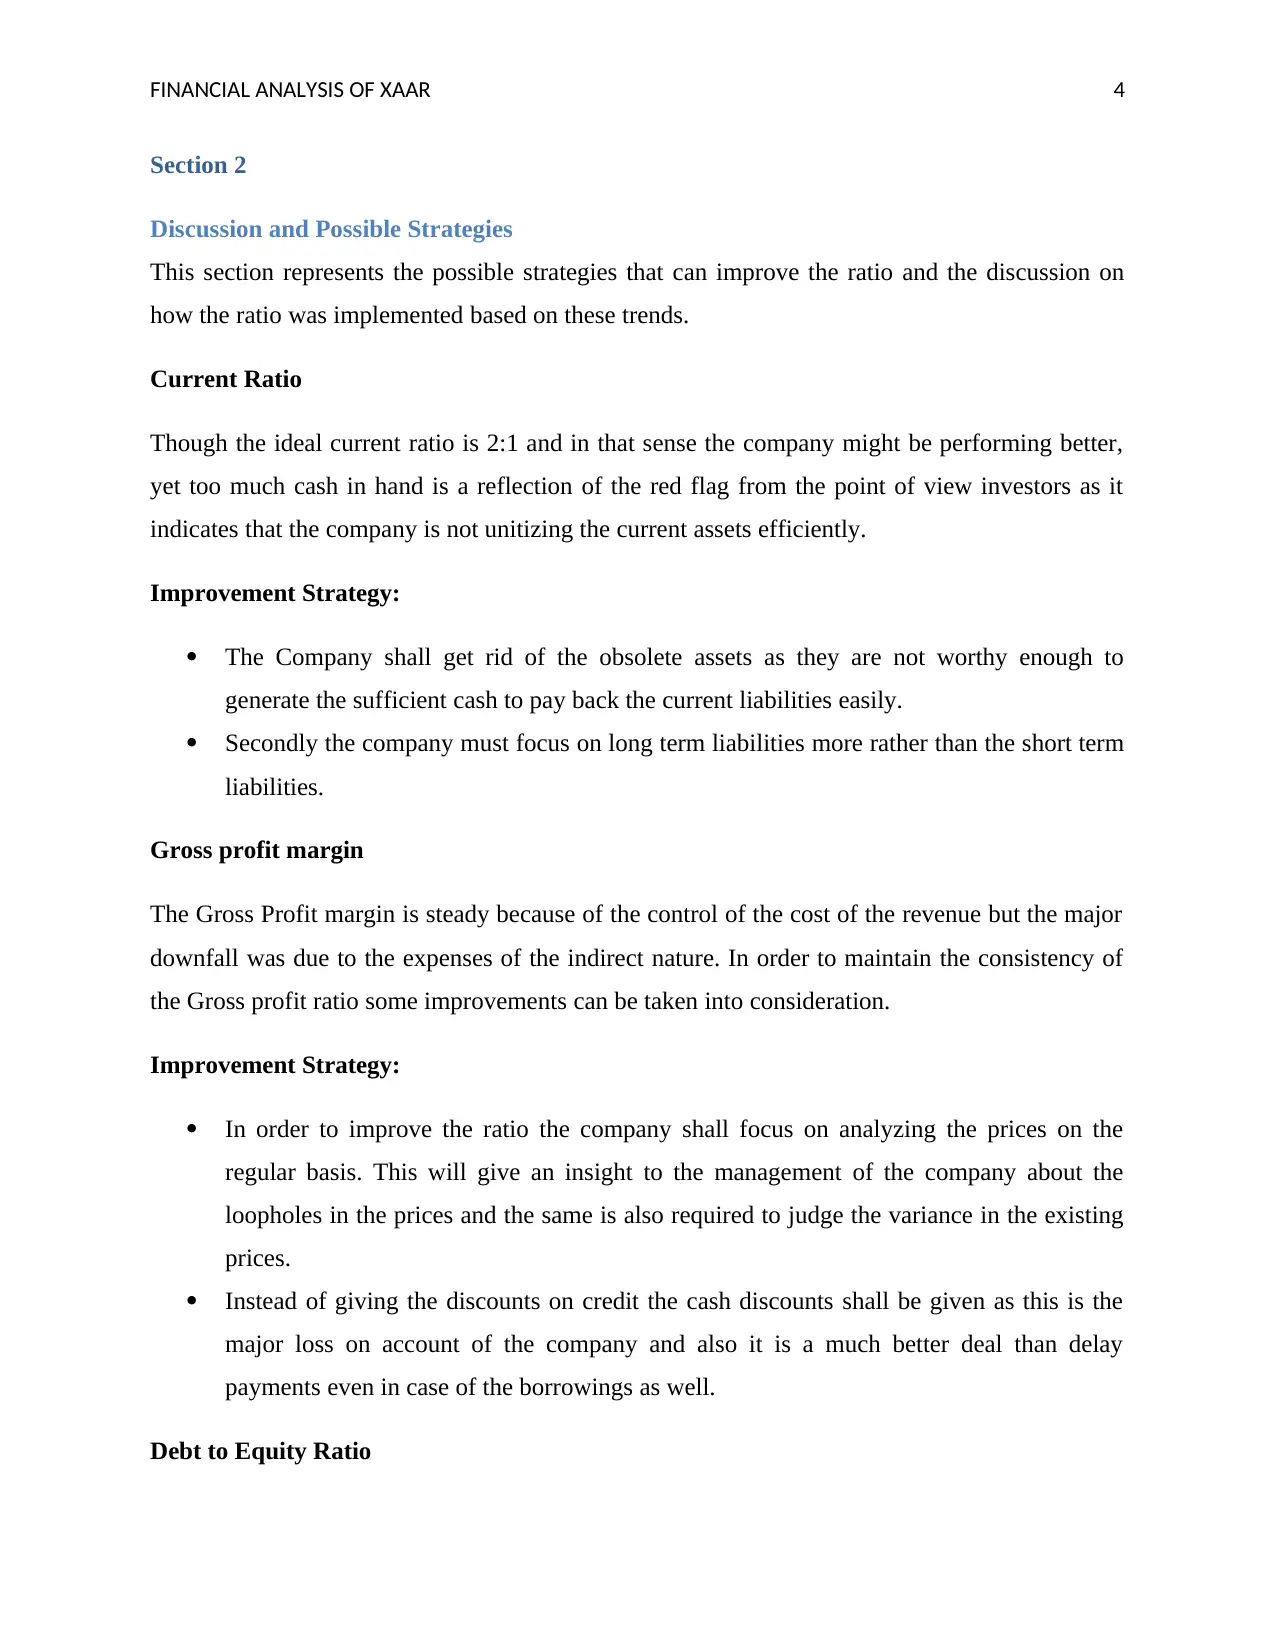
This section represents the possible strategies that can improve the ratio and the discussion on
how the ratio was implemented based on these trends.
Current Ratio
Though the ideal current ratio is 2:1 and in that sense the company might be performing better,
yet too much cash in hand is a reflection of the red flag from the point of view investors as it
indicates that the company is not unitizing the current assets efficiently.
Improvement Strategy:
The Company shall get rid of the obsolete assets as they are not worthy enough to
generate the sufficient cash to pay back the current liabilities easily.
Secondly the company must focus on long term liabilities more rather than the short term
liabilities.
Gross profit margin
The Gross Profit margin is steady because of the control of the cost of the revenue but the major
downfall was due to the expenses of the indirect nature. In order to maintain the consistency of
the Gross profit ratio some improvements can be taken into consideration.
Improvement Strategy:
In order to improve the ratio the company shall focus on analyzing the prices on the
regular basis. This will give an insight to the management of the company about the
loopholes in the prices and the same is also required to judge the variance in the existing
prices.
Instead of giving the discounts on credit the cash discounts shall be given as this is the
major loss on account of the company and also it is a much better deal than delay
payments even in case of the borrowings as well.
Debt to Equity Ratio
Section 2
Discussion and Possible Strategies
This section represents the possible strategies that can improve the ratio and the discussion on
how the ratio was implemented based on these trends.
Current Ratio
Though the ideal current ratio is 2:1 and in that sense the company might be performing better,
yet too much cash in hand is a reflection of the red flag from the point of view investors as it
indicates that the company is not unitizing the current assets efficiently.
Improvement Strategy:
The Company shall get rid of the obsolete assets as they are not worthy enough to
generate the sufficient cash to pay back the current liabilities easily.
Secondly the company must focus on long term liabilities more rather than the short term
liabilities.
Gross profit margin
The Gross Profit margin is steady because of the control of the cost of the revenue but the major
downfall was due to the expenses of the indirect nature. In order to maintain the consistency of
the Gross profit ratio some improvements can be taken into consideration.
Improvement Strategy:
In order to improve the ratio the company shall focus on analyzing the prices on the
regular basis. This will give an insight to the management of the company about the
loopholes in the prices and the same is also required to judge the variance in the existing
prices.
Instead of giving the discounts on credit the cash discounts shall be given as this is the
major loss on account of the company and also it is a much better deal than delay
payments even in case of the borrowings as well.
Debt to Equity Ratio
FINANCIAL ANALYSIS OF XAAR 5
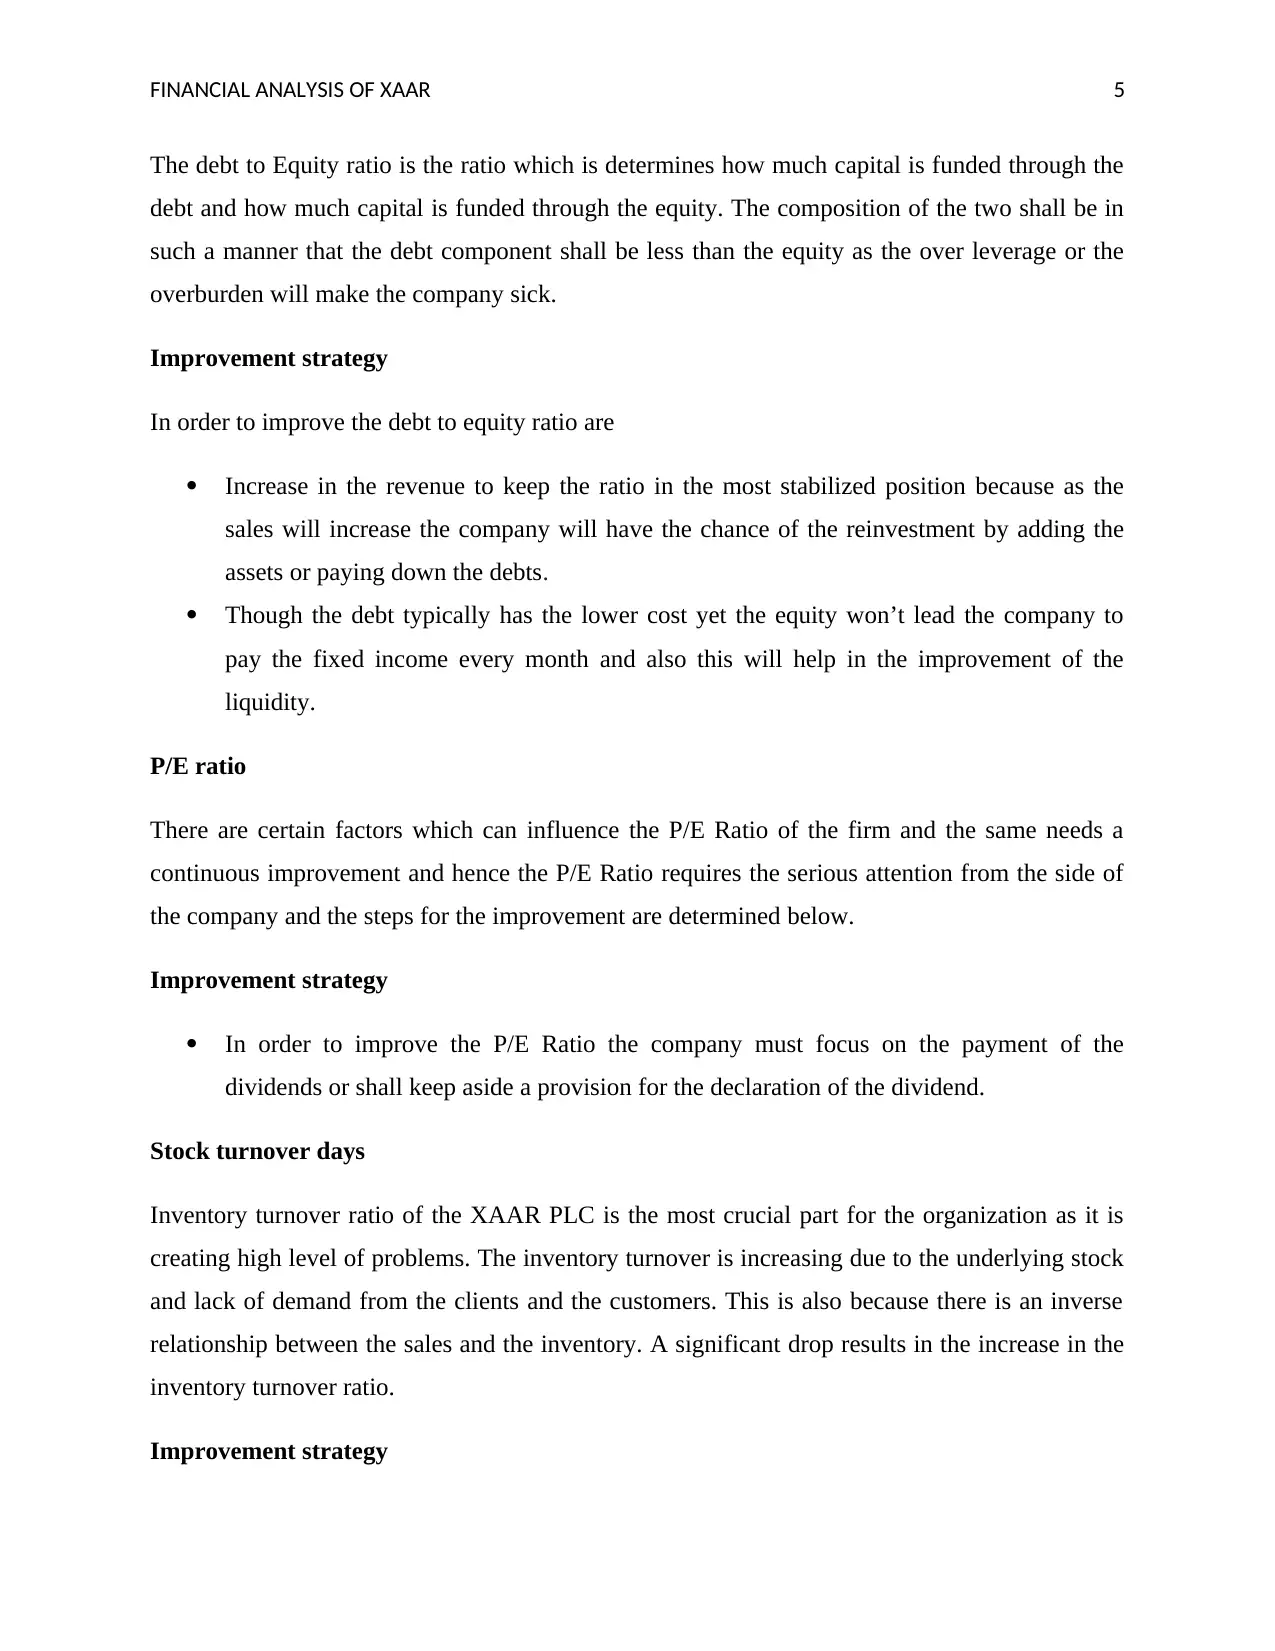
The debt to Equity ratio is the ratio which is determines how much capital is funded through the
debt and how much capital is funded through the equity. The composition of the two shall be in
such a manner that the debt component shall be less than the equity as the over leverage or the
overburden will make the company sick.
Improvement strategy
In order to improve the debt to equity ratio are
Increase in the revenue to keep the ratio in the most stabilized position because as the
sales will increase the company will have the chance of the reinvestment by adding the
assets or paying down the debts.
Though the debt typically has the lower cost yet the equity won’t lead the company to
pay the fixed income every month and also this will help in the improvement of the
liquidity.
P/E ratio
There are certain factors which can influence the P/E Ratio of the firm and the same needs a
continuous improvement and hence the P/E Ratio requires the serious attention from the side of
the company and the steps for the improvement are determined below.
Improvement strategy
In order to improve the P/E Ratio the company must focus on the payment of the
dividends or shall keep aside a provision for the declaration of the dividend.
Stock turnover days
Inventory turnover ratio of the XAAR PLC is the most crucial part for the organization as it is
creating high level of problems. The inventory turnover is increasing due to the underlying stock
and lack of demand from the clients and the customers. This is also because there is an inverse
relationship between the sales and the inventory. A significant drop results in the increase in the
inventory turnover ratio.
Improvement strategy
⊘ This is a preview!⊘
Do you want full access?
Subscribe today to unlock all pages.
Trusted by 1+ million students worldwide
FINANCIAL ANALYSIS OF XAAR 6
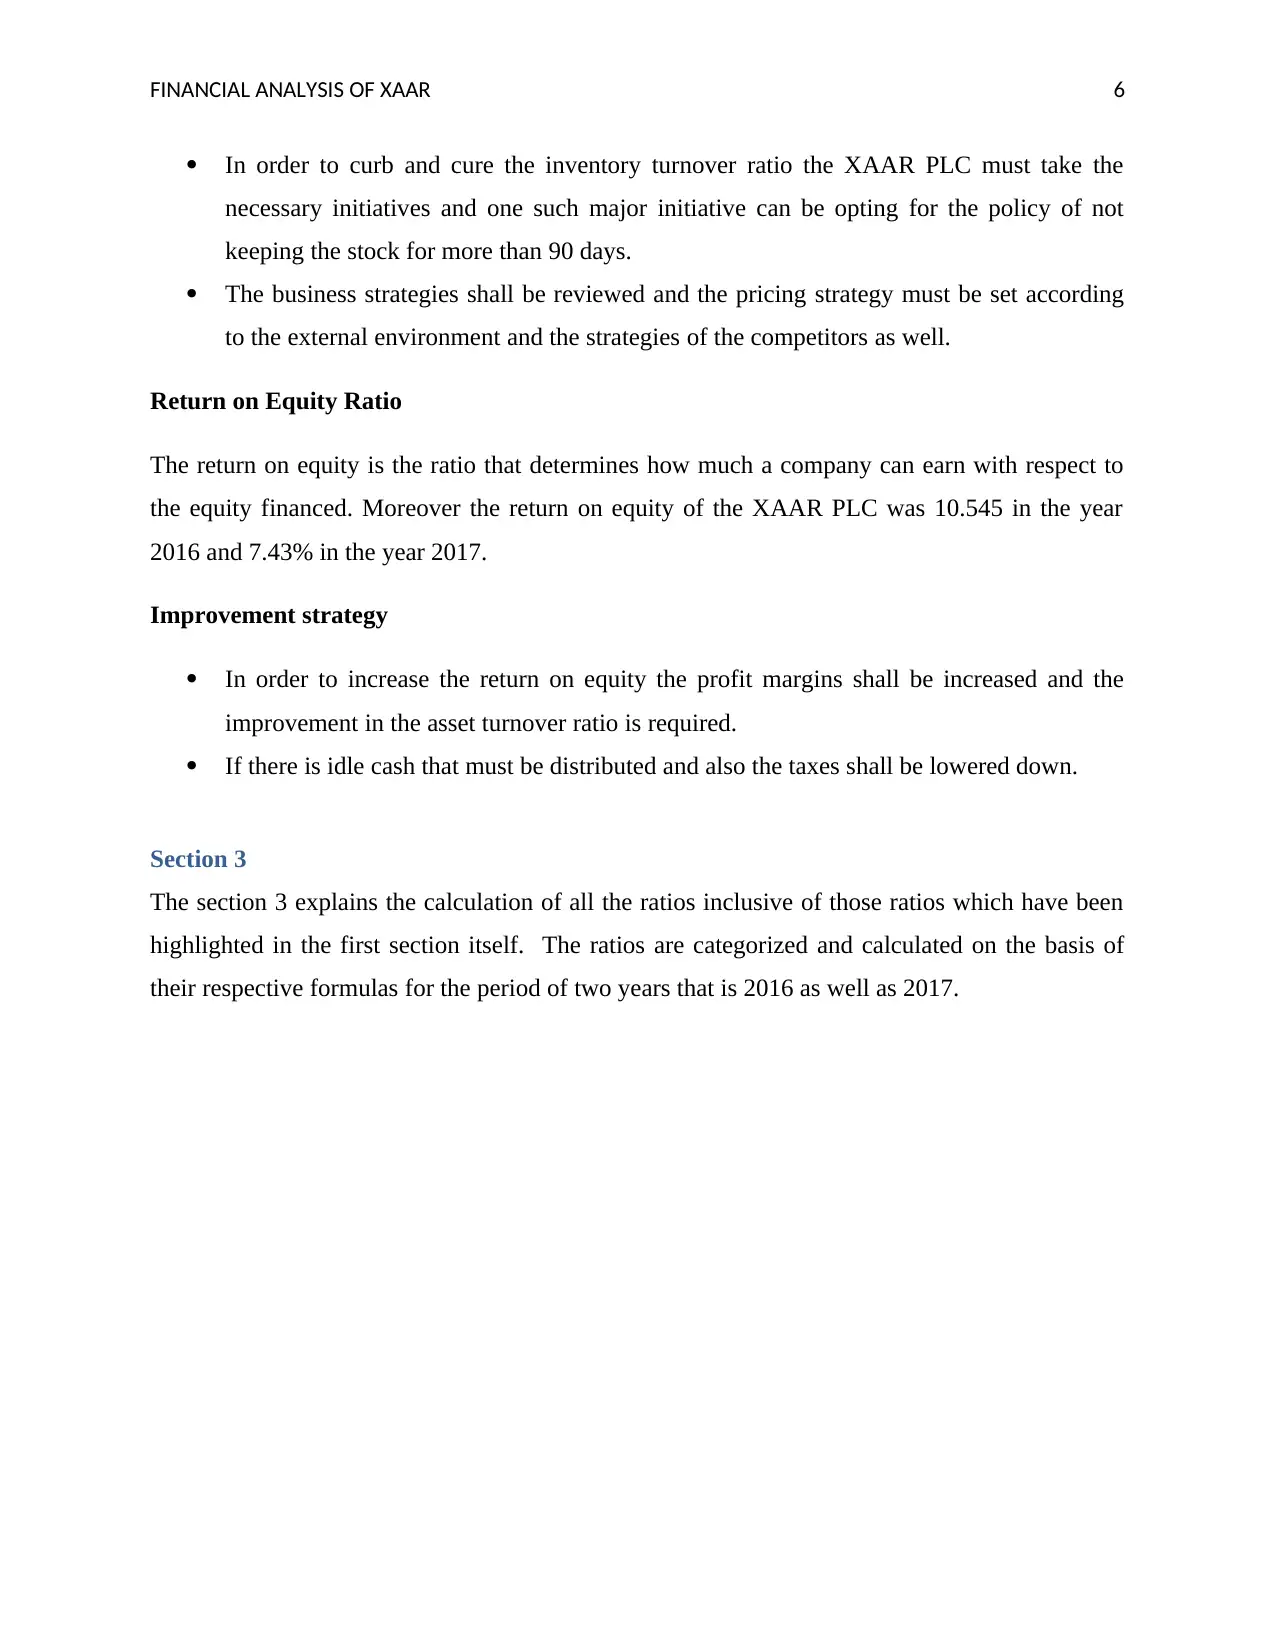
In order to curb and cure the inventory turnover ratio the XAAR PLC must take the
necessary initiatives and one such major initiative can be opting for the policy of not
keeping the stock for more than 90 days.
The business strategies shall be reviewed and the pricing strategy must be set according
to the external environment and the strategies of the competitors as well.
Return on Equity Ratio
The return on equity is the ratio that determines how much a company can earn with respect to
the equity financed. Moreover the return on equity of the XAAR PLC was 10.545 in the year
2016 and 7.43% in the year 2017.
Improvement strategy
In order to increase the return on equity the profit margins shall be increased and the
improvement in the asset turnover ratio is required.
If there is idle cash that must be distributed and also the taxes shall be lowered down.
Section 3
The section 3 explains the calculation of all the ratios inclusive of those ratios which have been
highlighted in the first section itself. The ratios are categorized and calculated on the basis of
their respective formulas for the period of two years that is 2016 as well as 2017.
Paraphrase This Document
Need a fresh take? Get an instant paraphrase of this document with our AI Paraphraser
FINANCIAL ANALYSIS OF XAAR 7
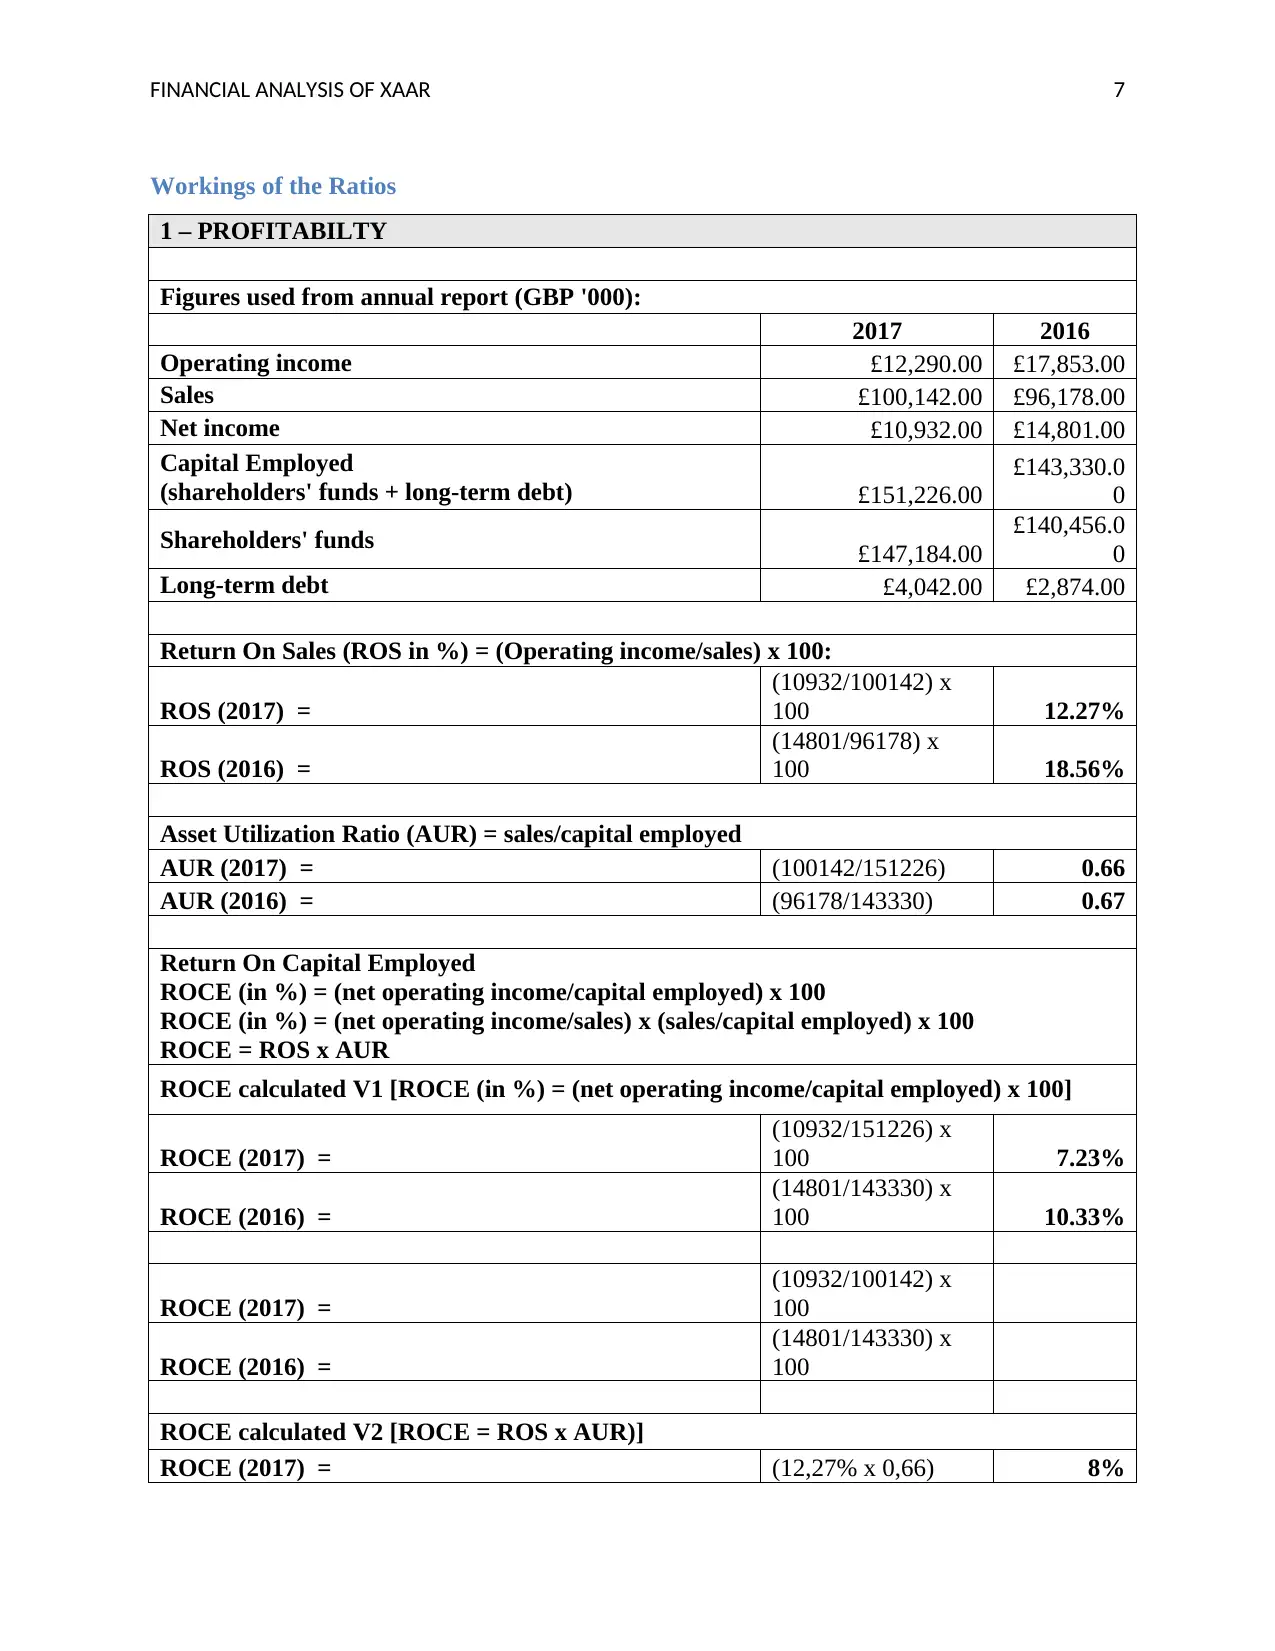
Workings of the Ratios
1 – PROFITABILTY
Figures used from annual report (GBP '000):
2017 2016
Operating income £12,290.00 £17,853.00
Sales £100,142.00 £96,178.00
Net income £10,932.00 £14,801.00
Capital Employed
(shareholders' funds + long-term debt) £151,226.00
£143,330.0
0
Shareholders' funds £147,184.00
£140,456.0
0
Long-term debt £4,042.00 £2,874.00
Return On Sales (ROS in %) = (Operating income/sales) x 100:
ROS (2017) =
(10932/100142) x
100 12.27%
ROS (2016) =
(14801/96178) x
100 18.56%
Asset Utilization Ratio (AUR) = sales/capital employed
AUR (2017) = (100142/151226) 0.66
AUR (2016) = (96178/143330) 0.67
Return On Capital Employed
ROCE (in %) = (net operating income/capital employed) x 100
ROCE (in %) = (net operating income/sales) x (sales/capital employed) x 100
ROCE = ROS x AUR
ROCE calculated V1 [ROCE (in %) = (net operating income/capital employed) x 100]
ROCE (2017) =
(10932/151226) x
100 7.23%
ROCE (2016) =
(14801/143330) x
100 10.33%
ROCE (2017) =
(10932/100142) x
100
ROCE (2016) =
(14801/143330) x
100
ROCE calculated V2 [ROCE = ROS x AUR)]
ROCE (2017) = (12,27% x 0,66) 8%
FINANCIAL ANALYSIS OF XAAR 8
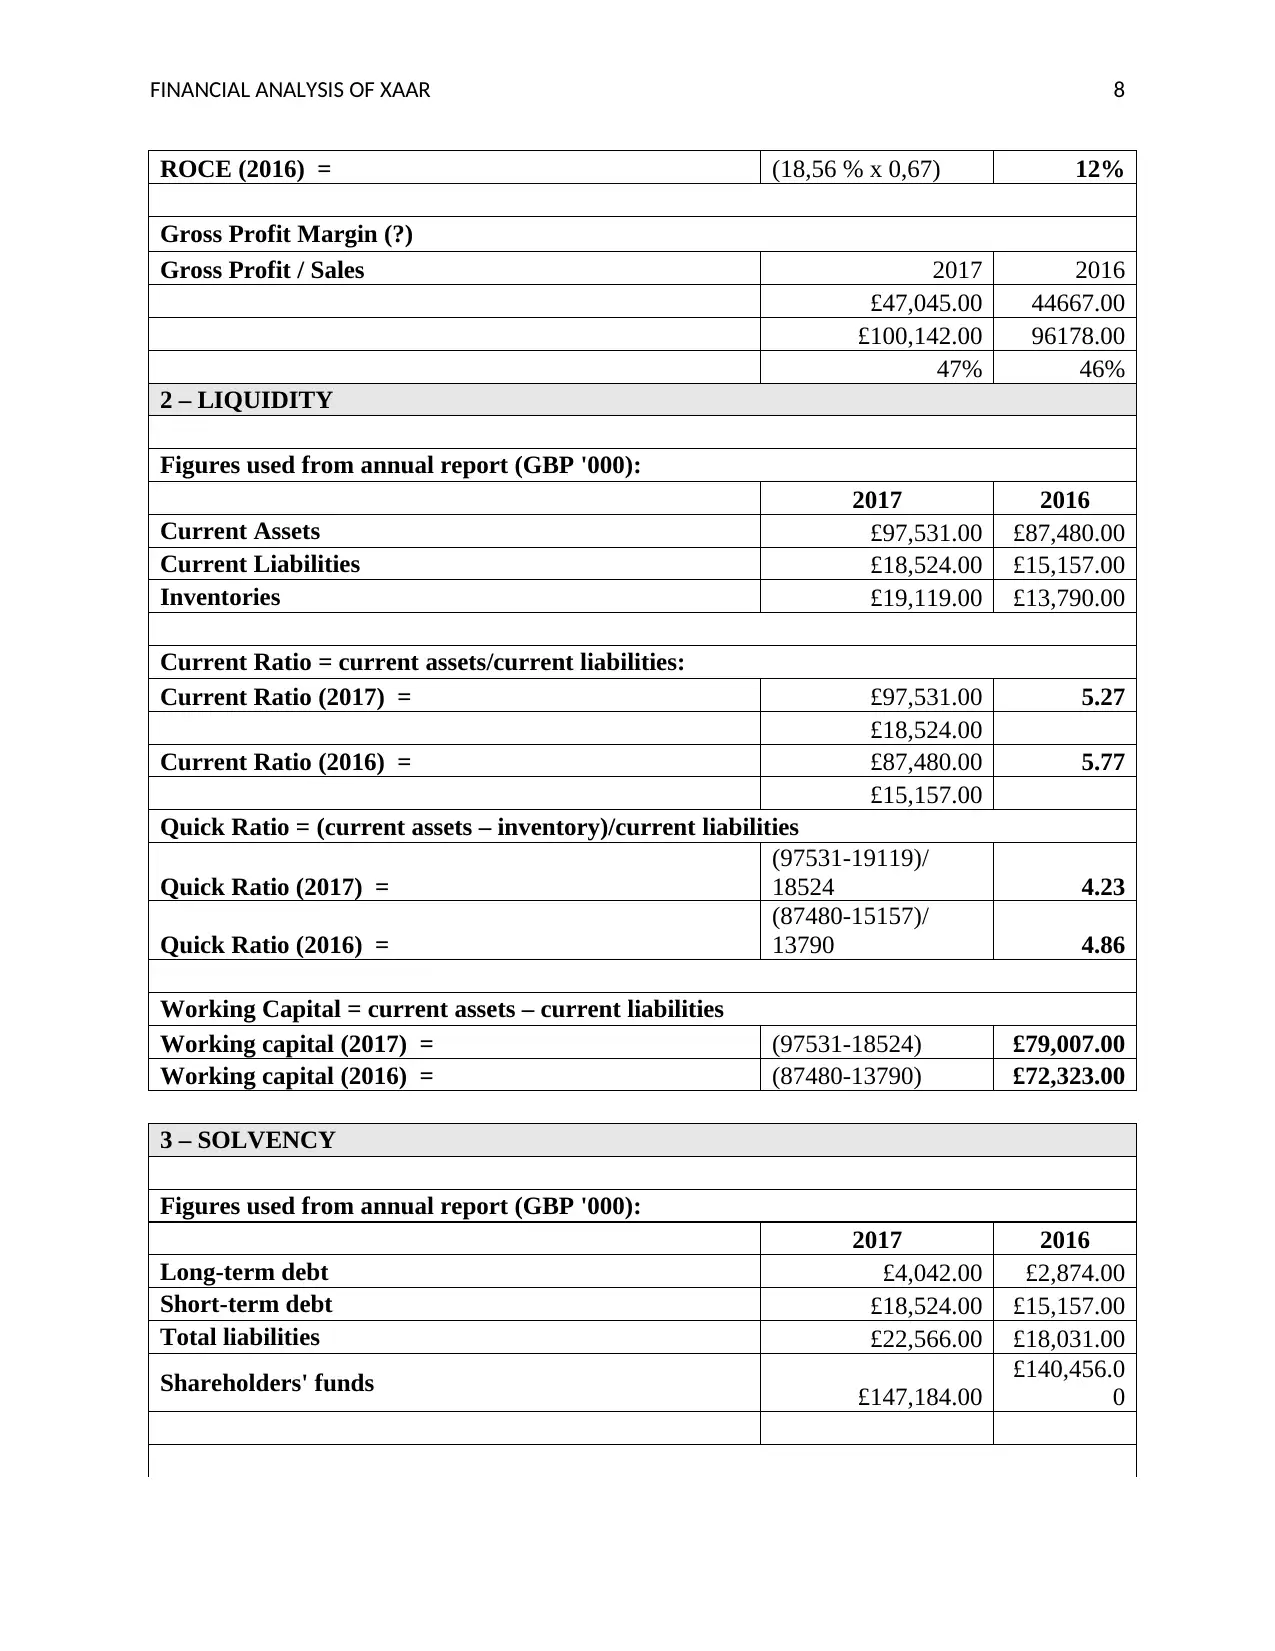
ROCE (2016) = (18,56 % x 0,67) 12%
Gross Profit Margin (?)
Gross Profit / Sales 2017 2016
£47,045.00 44667.00
£100,142.00 96178.00
47% 46%
2 – LIQUIDITY
Figures used from annual report (GBP '000):
2017 2016
Current Assets £97,531.00 £87,480.00
Current Liabilities £18,524.00 £15,157.00
Inventories £19,119.00 £13,790.00
Current Ratio = current assets/current liabilities:
Current Ratio (2017) = £97,531.00 5.27
£18,524.00
Current Ratio (2016) = £87,480.00 5.77
£15,157.00
Quick Ratio = (current assets – inventory)/current liabilities
Quick Ratio (2017) =
(97531-19119)/
18524 4.23
Quick Ratio (2016) =
(87480-15157)/
13790 4.86
Working Capital = current assets – current liabilities
Working capital (2017) = (97531-18524) £79,007.00
Working capital (2016) = (87480-13790) £72,323.00
3 – SOLVENCY
Figures used from annual report (GBP '000):
2017 2016
Long-term debt £4,042.00 £2,874.00
Short-term debt £18,524.00 £15,157.00
Total liabilities £22,566.00 £18,031.00
Shareholders' funds £147,184.00
£140,456.0
0
⊘ This is a preview!⊘
Do you want full access?
Subscribe today to unlock all pages.
Trusted by 1+ million students worldwide
FINANCIAL ANALYSIS OF XAAR 9
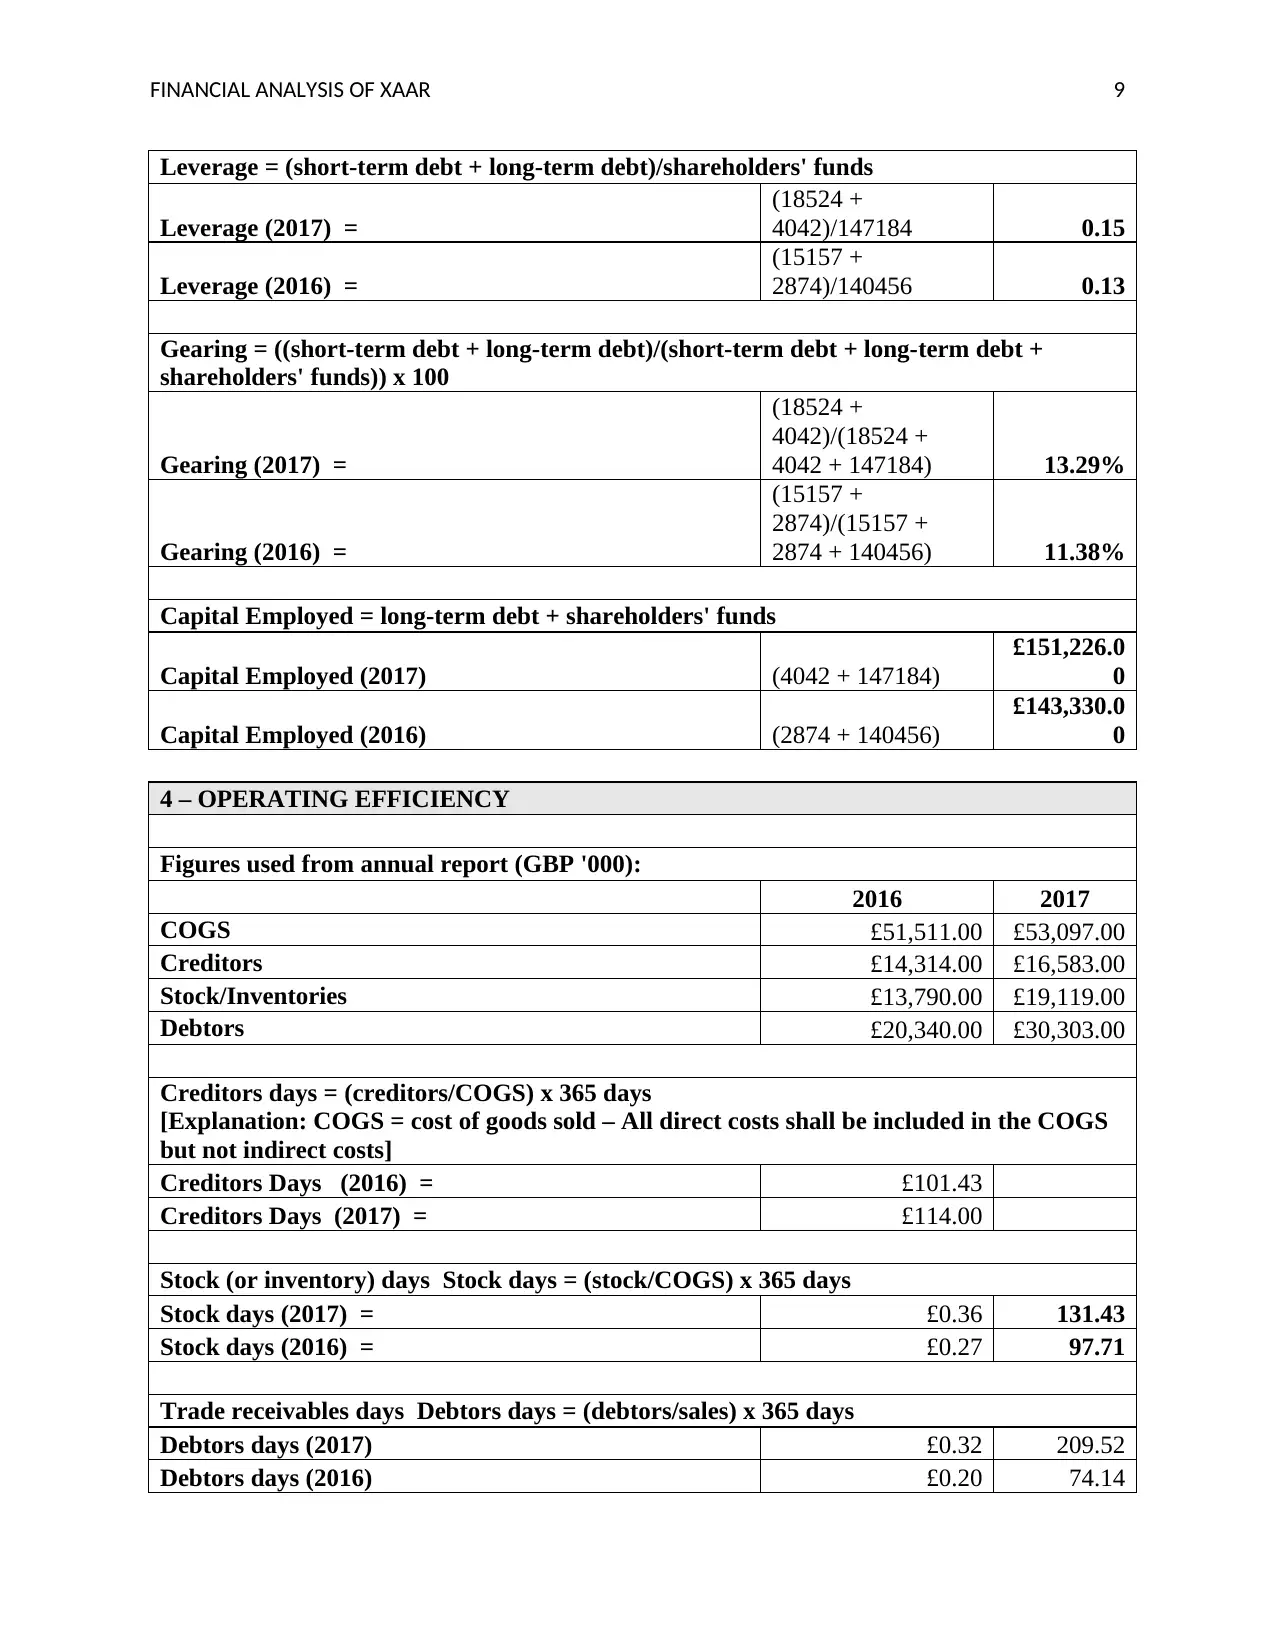
Leverage = (short-term debt + long-term debt)/shareholders' funds
Leverage (2017) =
(18524 +
4042)/147184 0.15
Leverage (2016) =
(15157 +
2874)/140456 0.13
Gearing = ((short-term debt + long-term debt)/(short-term debt + long-term debt +
shareholders' funds)) x 100
Gearing (2017) =
(18524 +
4042)/(18524 +
4042 + 147184) 13.29%
Gearing (2016) =
(15157 +
2874)/(15157 +
2874 + 140456) 11.38%
Capital Employed = long-term debt + shareholders' funds
Capital Employed (2017) (4042 + 147184)
£151,226.0
0
Capital Employed (2016) (2874 + 140456)
£143,330.0
0
4 – OPERATING EFFICIENCY
Figures used from annual report (GBP '000):
2016 2017
COGS £51,511.00 £53,097.00
Creditors £14,314.00 £16,583.00
Stock/Inventories £13,790.00 £19,119.00
Debtors £20,340.00 £30,303.00
Creditors days = (creditors/COGS) x 365 days
[Explanation: COGS = cost of goods sold – All direct costs shall be included in the COGS
but not indirect costs]
Creditors Days (2016) = £101.43
Creditors Days (2017) = £114.00
Stock (or inventory) days Stock days = (stock/COGS) x 365 days
Stock days (2017) = £0.36 131.43
Stock days (2016) = £0.27 97.71
Trade receivables days Debtors days = (debtors/sales) x 365 days
Debtors days (2017) £0.32 209.52
Debtors days (2016) £0.20 74.14
Paraphrase This Document
Need a fresh take? Get an instant paraphrase of this document with our AI Paraphraser
FINANCIAL ANALYSIS OF XAAR 10
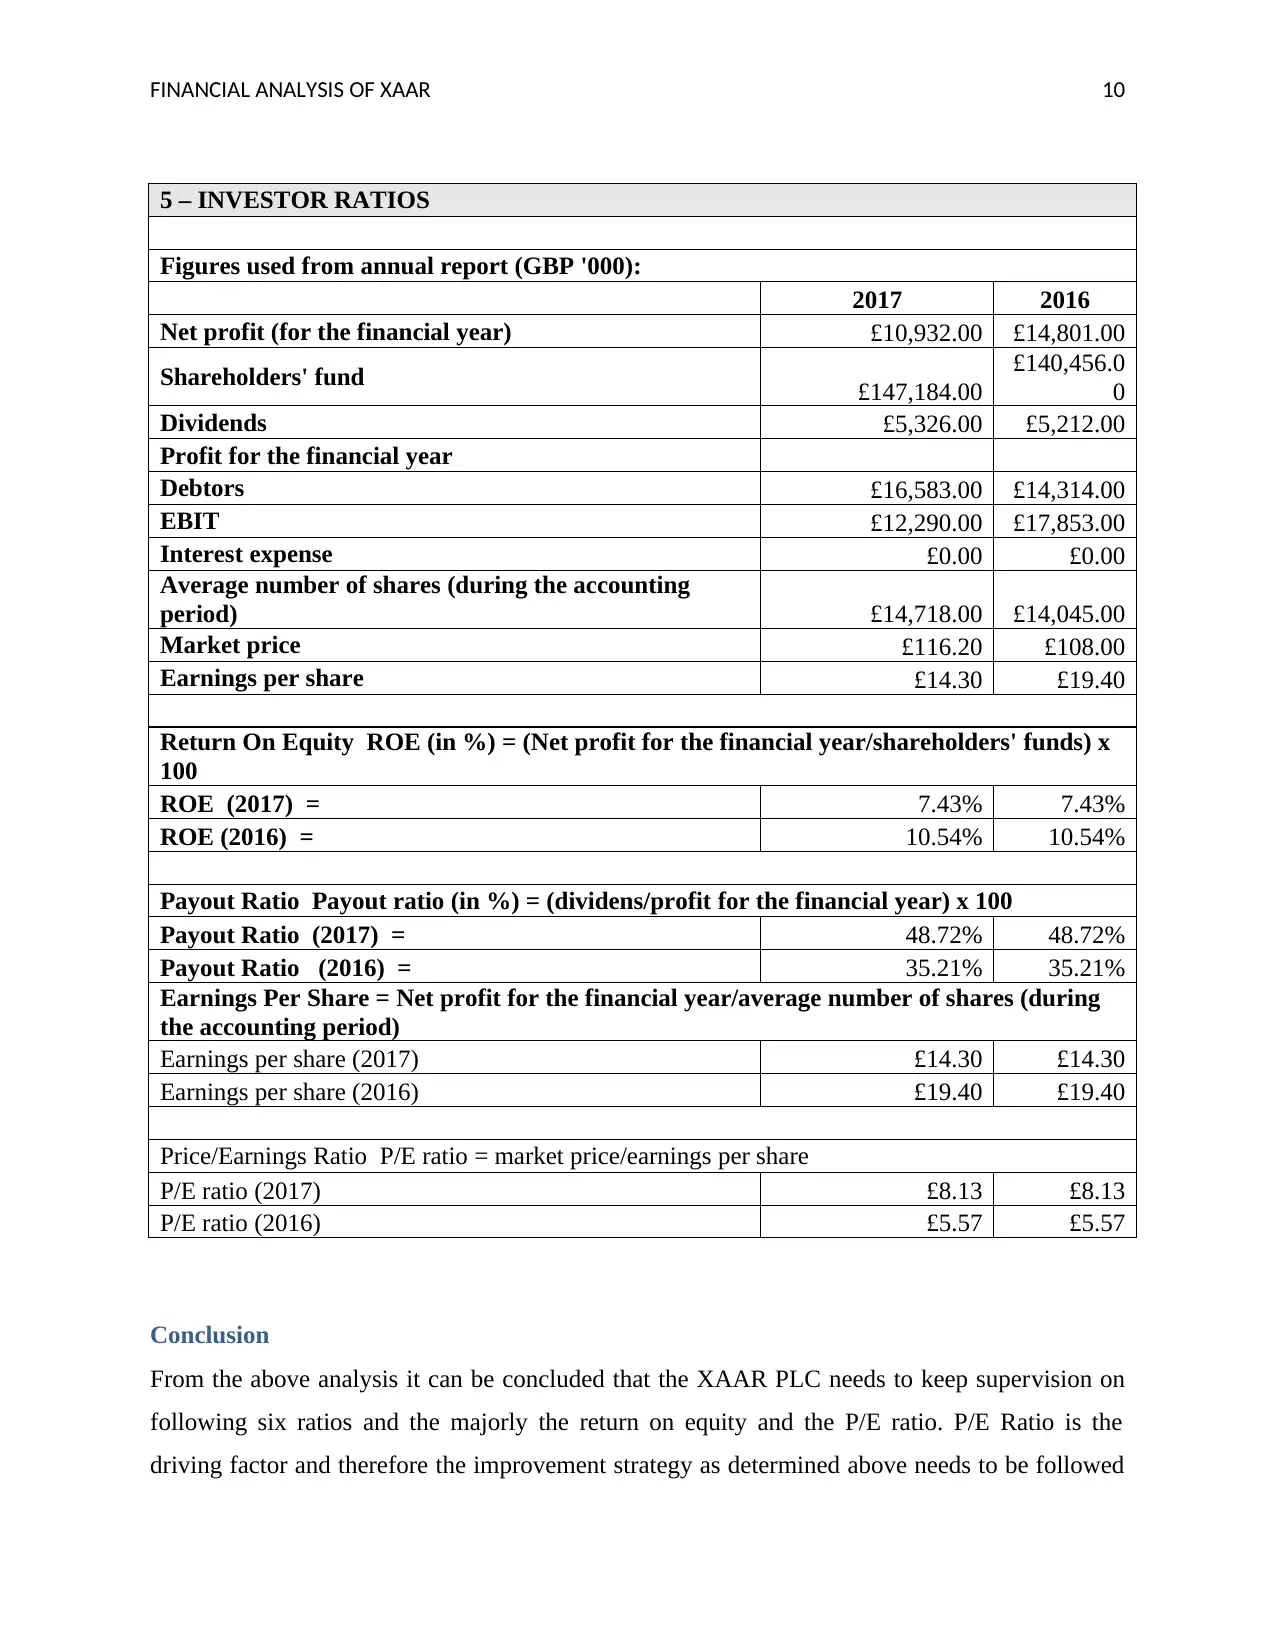
5 – INVESTOR RATIOS
Figures used from annual report (GBP '000):
2017 2016
Net profit (for the financial year) £10,932.00 £14,801.00
Shareholders' fund £147,184.00
£140,456.0
0
Dividends £5,326.00 £5,212.00
Profit for the financial year
Debtors £16,583.00 £14,314.00
EBIT £12,290.00 £17,853.00
Interest expense £0.00 £0.00
Average number of shares (during the accounting
period) £14,718.00 £14,045.00
Market price £116.20 £108.00
Earnings per share £14.30 £19.40
Return On Equity ROE (in %) = (Net profit for the financial year/shareholders' funds) x
100
ROE (2017) = 7.43% 7.43%
ROE (2016) = 10.54% 10.54%
Payout Ratio Payout ratio (in %) = (dividens/profit for the financial year) x 100
Payout Ratio (2017) = 48.72% 48.72%
Payout Ratio (2016) = 35.21% 35.21%
Earnings Per Share = Net profit for the financial year/average number of shares (during
the accounting period)
Earnings per share (2017) £14.30 £14.30
Earnings per share (2016) £19.40 £19.40
Price/Earnings Ratio P/E ratio = market price/earnings per share
P/E ratio (2017) £8.13 £8.13
P/E ratio (2016) £5.57 £5.57
Conclusion
From the above analysis it can be concluded that the XAAR PLC needs to keep supervision on
following six ratios and the majorly the return on equity and the P/E ratio. P/E Ratio is the
driving factor and therefore the improvement strategy as determined above needs to be followed
FINANCIAL ANALYSIS OF XAAR 11
with the immediate effect. Moreover the liquidity ratio also needs the attention and this can be
achieved by getting rid of the obsolete assets. Despite this the rest of the categories are also
determined in detail above and states that the company can earn better if the strategies are
implemented.
with the immediate effect. Moreover the liquidity ratio also needs the attention and this can be
achieved by getting rid of the obsolete assets. Despite this the rest of the categories are also
determined in detail above and states that the company can earn better if the strategies are
implemented.
⊘ This is a preview!⊘
Do you want full access?
Subscribe today to unlock all pages.
Trusted by 1+ million students worldwide
1 out of 12
Related Documents


Your All-in-One AI-Powered Toolkit for Academic Success.
+13062052269
info@desklib.com
Available 24*7 on WhatsApp / Email
![[object Object]](/_next/static/media/star-bottom.7253800d.svg)
Unlock your academic potential
Copyright © 2020–2026 A2Z Services. All Rights Reserved. Developed and managed by ZUCOL.