Management Accounting Report: XLG Company's Performance Evaluation
VerifiedAdded on 2023/01/07
|11
|3281
|91
Report
AI Summary
This report provides a comprehensive analysis of XLG, a company manufacturing household cleaners in the UK, focusing on management accounting principles. Part A delves into variance analysis, calculating sales price variance, sales volume variance, and material cost variances for Chemical X and Y, providing detailed formulas and calculations. It then evaluates the advantages and disadvantages of using variances to assess managerial performance, emphasizing the importance of variance analysis in budgeting, control, and liability determination, while acknowledging its limitations regarding non-financial factors and potential manipulation. Part B explores a make-or-buy decision, considering the increased cost of an imported component (Fama Q) from Brazil. It examines the options of manufacturing Fama Q in the UK versus continuing to import, considering patent regulations, cost implications, and potential demand increases, providing a comparative analysis to aid in decision-making. The report highlights the importance of accurate financial data for effective variance analysis and managerial evaluation.

Management
Accounting
Accounting
Paraphrase This Document
Need a fresh take? Get an instant paraphrase of this document with our AI Paraphraser
INTRODUCTION
Financial statements of company have to be properly reported and more changes can be
taken. Management accounting (MA) performs a crucial role throughout this area because this is
related to consistently reviewing, assessing non - financial and financial information so decision-
making can be processed by management through collected evidence (Chorley, 2019). The report
is prepared on a company that is XLG, which manufactures various types of household cleaners
and sells throughout the UK.
Part A and B are included in the study, which comprises of distinct material, based on
business information received. In Part A, data has been included regarding the calculation of
various differences alongside benefits and drawbacks. While second Part is being analysed about
whether business must implement make item at residence or manufacture from another country.
TASK
PART A
(i) Deals price and capacity contribution difference.
Sales Price Variance: This variability could be described as the variation among real market
value selling and total budget cost revenue. According to the given data, this variability was
calculated in a really way shows below:
Method: (Actual Price-Standard price) x Actual number of units
Chemical X:
Given data:
Actual price= 45 Pounds
Standard price= 35 Pounds
Actual number of sales unit= 850 units
Sales price variance: (45-35) *850
= 8500 (F)
Chemical Y:
Given data:
Actual price= 37 Pounds
Standard price= 30 Pounds
Actual number of sales unit= 750 units
Sales price variance: (37-30) * 750
= 5250 (F)
Variability in expenditure sales volume: This variability could be devoted to the analysis
of revenue transformation due to the variation among budgeted and actual selling quantities
(Zhang, 2020).
Formula: (Current units priced for each unit at a premium price) – (budged unit priced at a
budget price per unit).
Chemical X:
Specified data:
Real elements sold= 850 Units
Planned value for all unit= 35 Pounds
Planned unit wholesaled= 595 Units
Planned worth for all unit= 35 Pounds
Sales volume effect modification: (850*35) – (595*35)
= 8925 (F)
Chemical Y:
Assumed data:
Definite units traded= 750 Units
Accounted price for all unit = 30 Pounds
Planned unit sold= 595 Units
Planned price for each unit= 30 Pounds
Sales capacity influence variance: (750*30) – (595*30)
= 4650 (F)
The variability in material cost organising as well as the difference throughout the
organisational price of the material.
Variability in material price organising: this is indeed a type of variability calculated to
determine the difference between all the actual and planned rates of the material. It is determined
using the equation described below which is as follows:
⊘ This is a preview!⊘
Do you want full access?
Subscribe today to unlock all pages.
Trusted by 1+ million students worldwide
Equation: [(Revised Budget Sales x Standard Margin)- (Actual Standard Margin X Sales
Quantity)]
Chemical X:
Given numbers-
Reviewed budgeted deals= 595 units @ 4.5
Normal Margin= 25
Definite Sales Amount= 850 Units
Average Margin= 25
Substantial price preparation variance: [(595*4.5*25) -(850*25)]
45687.5
Chemical Y:
Specified records-
Revised budgeted sales= 595 units @ 4.5
Average Margin= 20
Definite Sales Extent= 750 Units
Standard Margin= 20
Physical price preparation variance: [(595*4.5*20) - (750*20)]
38550
Variation in the operation of commodity costs: This form of variation is measured to
assess disparity in material prices, labour, etc. This is assessed by multiplying the actual story
and the amended budgets with the actual results (Salles, Rocha and Gonçalves, 2020). In respect
of the financial information provided, this variance was computed in a really way as to be as
described in the following manner:
Chemical X:
Method: [(Original budgeted sales x Standard Margin) – (Revised budgeted sales x Standard
Margin)]
Particular data:
Unique accounted sales= 595 Units @ 2.5
Usual Margin= 25
Revised planned sales= 595 Units @ 4.5
Paraphrase This Document
Need a fresh take? Get an instant paraphrase of this document with our AI Paraphraser
Ordinary Margin= 25
Material worth planning difference= [(595*2.5*25) -(595*4.5*25)]
= -29750
Chemical Y:
Given information:
New budgeted trades= 595 Units @ 2.5
Standard Margin= 20
Revised accounted sales= 595 Units @ 4.5
Standard margin= 20
Material price planning variance= [(595*2.5*20) -(595*4.5*20)]
= -23800
Despite the transition of procedures, the benefits and disadvantages of using variances when
determining the success of managers are objectively assessed.
Variance descriptive analysis is also an analysis of variances in actual practice toward
anticipated or planned actions in financial forecasting or financial accounting (Telesca, Helbig
and Kanevski, 2019). It mainly deals by how the difference between actual and expected
operations indicates the business performance is being influenced. In simple term, the
evaluation of variance is really the formal assessment of the difference between actual and
predicted behaviour. Using this review maintains control over the firm. For instance, because the
revenue estimate is $10,000 and the true income is $8,000, then the variability analysis results in
a disparity of $2,000. The variance analysis plays an important role in assessing managers'
efficiency because this it is continuous for everyone if it is supervisor or worker. Using this
method, a company's manager can try comparing real statistics to approximate actual
performance. When the result shows a bad effect, it will be viewed as an adverse consequence
because if outcome shows a favourable result, it will be interpreted as a good result. In the event
that management' success produces negative effects, it can be determined that executives are
unable to meet set targets. As regards evaluating supervisor's output, it is critical that certain
performance should be measured at the close of the budget year. Its efficiency cannot be
adequately measured within a calendar year (Choi, Sun and Chung, 2019).
Failure to apply this approach performance measurement will make it impossible for
organizations to assess real success levels. In the context of above business, in order to figure out
the importance of actual results, they should implement variance analysis process. Beyond
measuring managers' results, this is often helpful in evaluating staff results and behaviours as
well. This is so since a company's management can measure the gap between real costs and
financial projections on the grounds of that as well. Through this method, as well as personal
performance levels of each staff member are also measured. Here are some of the main
advantages and demerits of using this method to assess the success of management as described
in the following way:
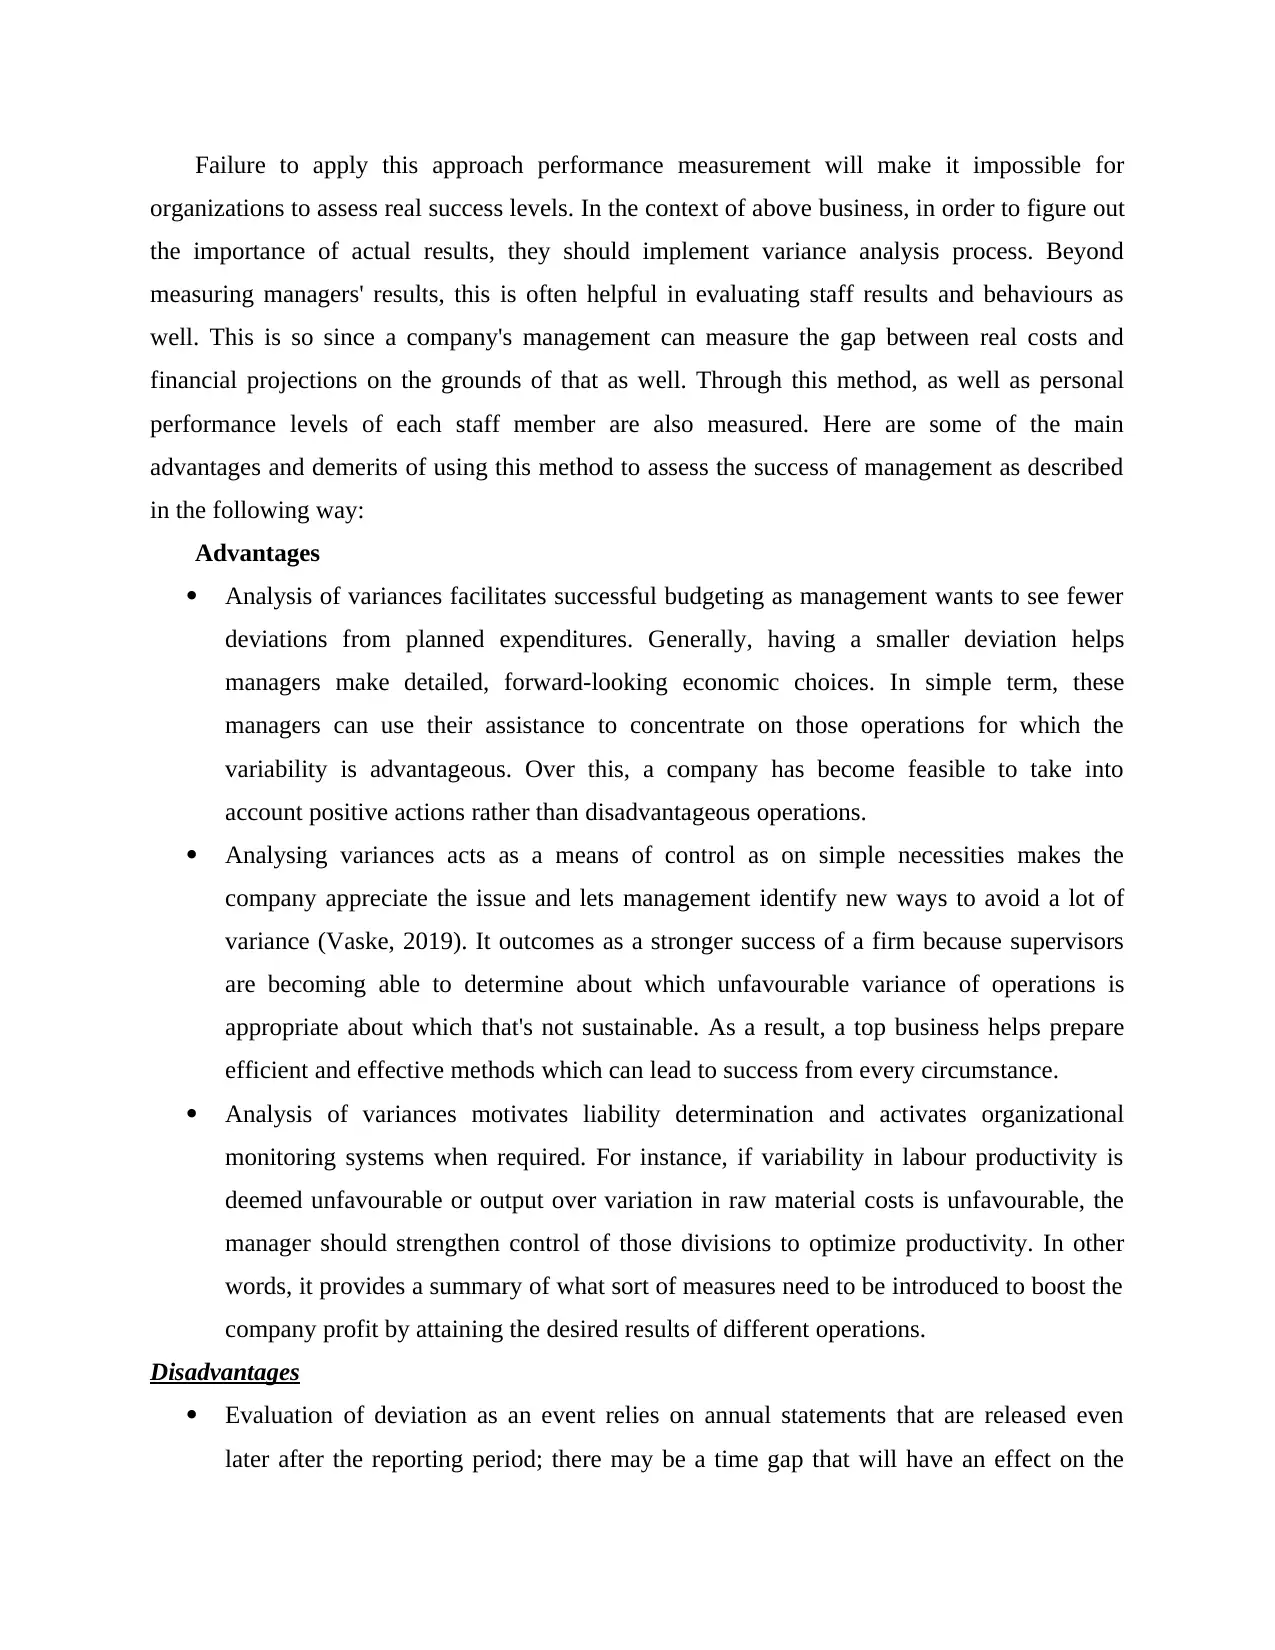
Advantages
Analysis of variances facilitates successful budgeting as management wants to see fewer
deviations from planned expenditures. Generally, having a smaller deviation helps
managers make detailed, forward-looking economic choices. In simple term, these
managers can use their assistance to concentrate on those operations for which the
variability is advantageous. Over this, a company has become feasible to take into
account positive actions rather than disadvantageous operations.
Analysing variances acts as a means of control as on simple necessities makes the
company appreciate the issue and lets management identify new ways to avoid a lot of
variance (Vaske, 2019). It outcomes as a stronger success of a firm because supervisors
are becoming able to determine about which unfavourable variance of operations is
appropriate about which that's not sustainable. As a result, a top business helps prepare
efficient and effective methods which can lead to success from every circumstance.
Analysis of variances motivates liability determination and activates organizational
monitoring systems when required. For instance, if variability in labour productivity is
deemed unfavourable or output over variation in raw material costs is unfavourable, the
manager should strengthen control of those divisions to optimize productivity. In other
words, it provides a summary of what sort of measures need to be introduced to boost the
company profit by attaining the desired results of different operations.
Disadvantages
Evaluation of deviation as an event relies on annual statements that are released even
later after the reporting period; there may be a time gap that will have an effect on the
organizations to assess real success levels. In the context of above business, in order to figure out
the importance of actual results, they should implement variance analysis process. Beyond
measuring managers' results, this is often helpful in evaluating staff results and behaviours as
well. This is so since a company's management can measure the gap between real costs and
financial projections on the grounds of that as well. Through this method, as well as personal
performance levels of each staff member are also measured. Here are some of the main
advantages and demerits of using this method to assess the success of management as described
in the following way:
Advantages
Analysis of variances facilitates successful budgeting as management wants to see fewer
deviations from planned expenditures. Generally, having a smaller deviation helps
managers make detailed, forward-looking economic choices. In simple term, these
managers can use their assistance to concentrate on those operations for which the
variability is advantageous. Over this, a company has become feasible to take into
account positive actions rather than disadvantageous operations.
Analysing variances acts as a means of control as on simple necessities makes the
company appreciate the issue and lets management identify new ways to avoid a lot of
variance (Vaske, 2019). It outcomes as a stronger success of a firm because supervisors
are becoming able to determine about which unfavourable variance of operations is
appropriate about which that's not sustainable. As a result, a top business helps prepare
efficient and effective methods which can lead to success from every circumstance.
Analysis of variances motivates liability determination and activates organizational
monitoring systems when required. For instance, if variability in labour productivity is
deemed unfavourable or output over variation in raw material costs is unfavourable, the
manager should strengthen control of those divisions to optimize productivity. In other
words, it provides a summary of what sort of measures need to be introduced to boost the
company profit by attaining the desired results of different operations.
Disadvantages
Evaluation of deviation as an event relies on annual statements that are released even
later after the reporting period; there may be a time gap that will have an effect on the
⊘ This is a preview!⊘
Do you want full access?
Subscribe today to unlock all pages.
Trusted by 1+ million students worldwide
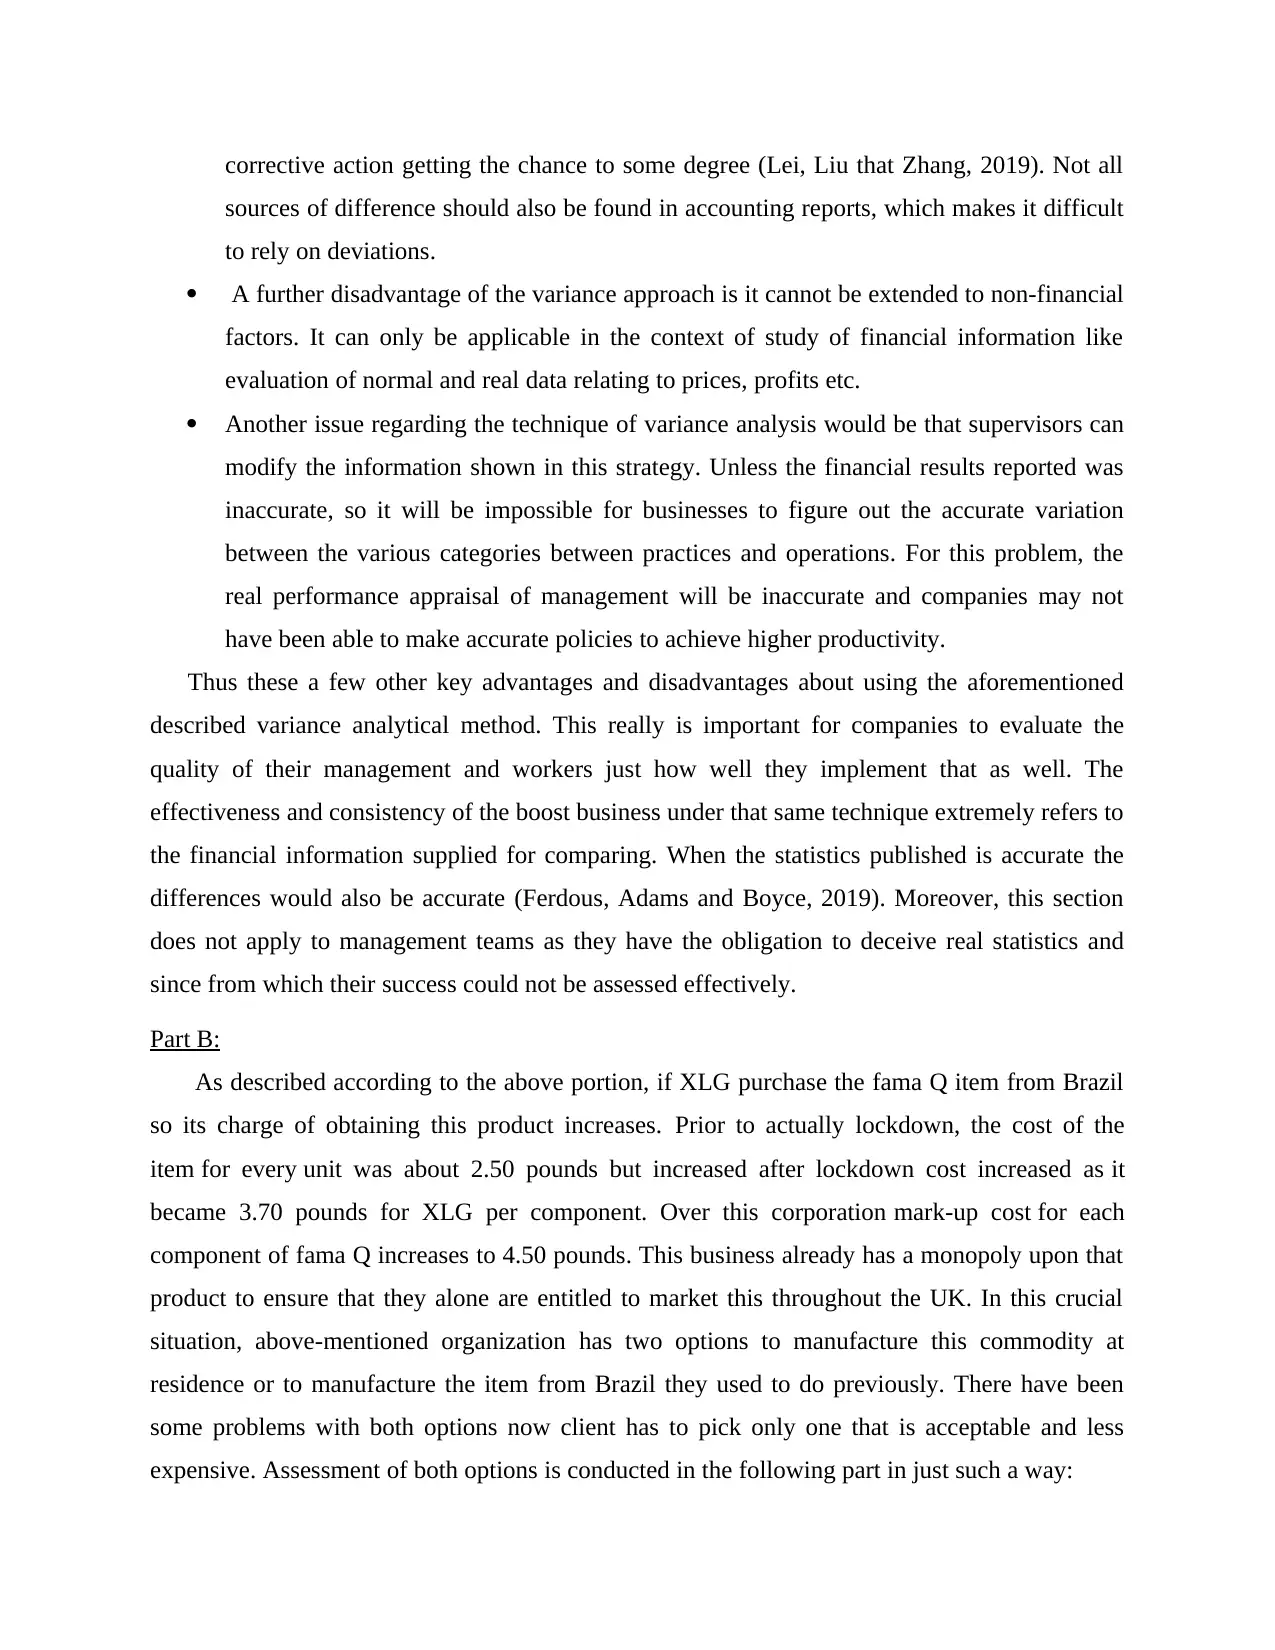
corrective action getting the chance to some degree (Lei, Liu that Zhang, 2019). Not all
sources of difference should also be found in accounting reports, which makes it difficult
to rely on deviations.
A further disadvantage of the variance approach is it cannot be extended to non-financial
factors. It can only be applicable in the context of study of financial information like
evaluation of normal and real data relating to prices, profits etc.
Another issue regarding the technique of variance analysis would be that supervisors can
modify the information shown in this strategy. Unless the financial results reported was
inaccurate, so it will be impossible for businesses to figure out the accurate variation
between the various categories between practices and operations. For this problem, the
real performance appraisal of management will be inaccurate and companies may not
have been able to make accurate policies to achieve higher productivity.
Thus these a few other key advantages and disadvantages about using the aforementioned
described variance analytical method. This really is important for companies to evaluate the
quality of their management and workers just how well they implement that as well. The
effectiveness and consistency of the boost business under that same technique extremely refers to
the financial information supplied for comparing. When the statistics published is accurate the
differences would also be accurate (Ferdous, Adams and Boyce, 2019). Moreover, this section
does not apply to management teams as they have the obligation to deceive real statistics and
since from which their success could not be assessed effectively.
Part B:
As described according to the above portion, if XLG purchase the fama Q item from Brazil
so its charge of obtaining this product increases. Prior to actually lockdown, the cost of the
item for every unit was about 2.50 pounds but increased after lockdown cost increased as it
became 3.70 pounds for XLG per component. Over this corporation mark-up cost for each
component of fama Q increases to 4.50 pounds. This business already has a monopoly upon that
product to ensure that they alone are entitled to market this throughout the UK. In this crucial
situation, above-mentioned organization has two options to manufacture this commodity at
residence or to manufacture the item from Brazil they used to do previously. There have been
some problems with both options now client has to pick only one that is acceptable and less
expensive. Assessment of both options is conducted in the following part in just such a way:
Paraphrase This Document
Need a fresh take? Get an instant paraphrase of this document with our AI Paraphraser
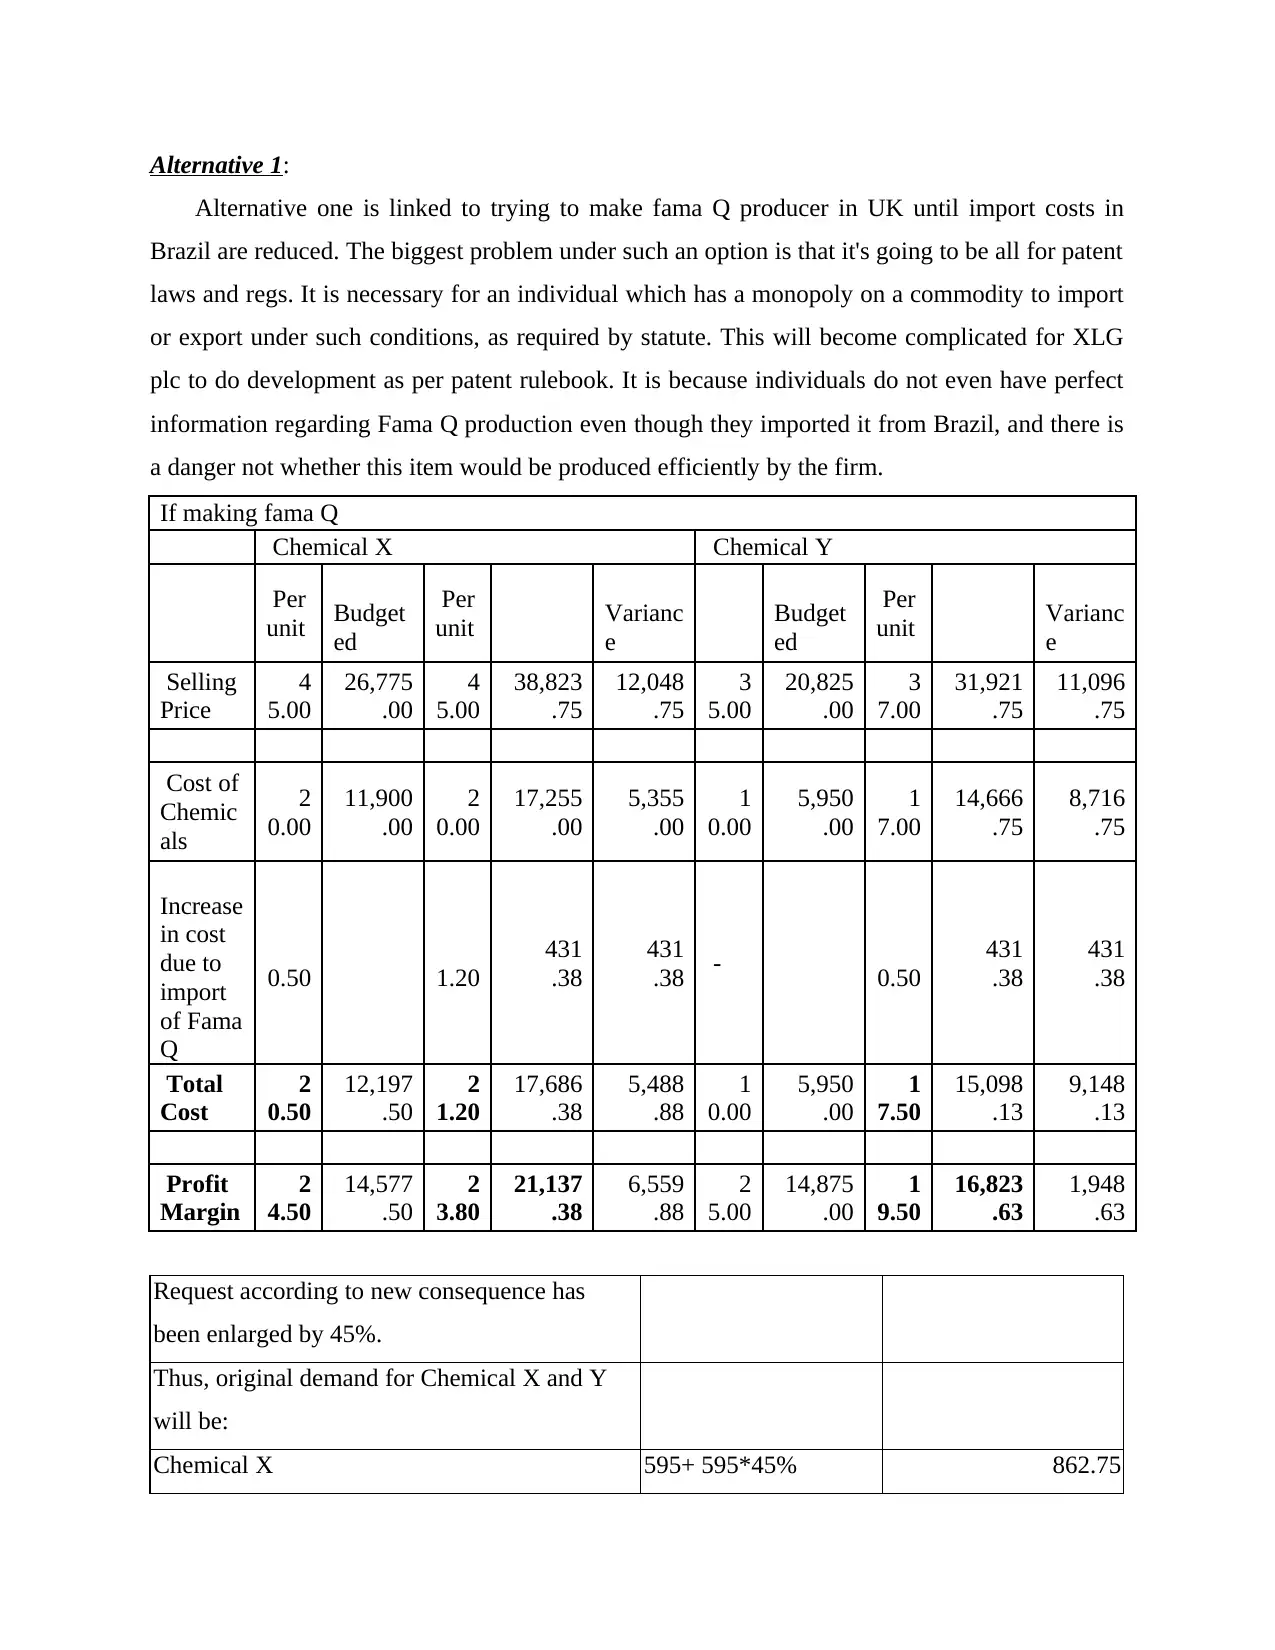
Alternative 1:
Alternative one is linked to trying to make fama Q producer in UK until import costs in
Brazil are reduced. The biggest problem under such an option is that it's going to be all for patent
laws and regs. It is necessary for an individual which has a monopoly on a commodity to import
or export under such conditions, as required by statute. This will become complicated for XLG
plc to do development as per patent rulebook. It is because individuals do not even have perfect
information regarding Fama Q production even though they imported it from Brazil, and there is
a danger not whether this item would be produced efficiently by the firm.
If making fama Q
Chemical X Chemical Y
Per
unit Budget
ed
Per
unit Varianc
e
Budget
ed
Per
unit Varianc
e
Selling
Price
4
5.00
26,775
.00
4
5.00
38,823
.75
12,048
.75
3
5.00
20,825
.00
3
7.00
31,921
.75
11,096
.75
Cost of
Chemic
als
2
0.00
11,900
.00
2
0.00
17,255
.00
5,355
.00
1
0.00
5,950
.00
1
7.00
14,666
.75
8,716
.75
Increase
in cost
due to
import
of Fama
Q
0.50 1.20
431
.38
431
.38 - 0.50
431
.38
431
.38
Total
Cost
2
0.50
12,197
.50
2
1.20
17,686
.38
5,488
.88
1
0.00
5,950
.00
1
7.50
15,098
.13
9,148
.13
Profit
Margin
2
4.50
14,577
.50
2
3.80
21,137
.38
6,559
.88
2
5.00
14,875
.00
1
9.50
16,823
.63
1,948
.63
Request according to new consequence has
been enlarged by 45%.
Thus, original demand for Chemical X and Y
will be:
Chemical X 595+ 595*45% 862.75
Chemical Y 595+ 595 * 45% 862.75
Interpretation: The above equation shows that if they make it in the United Kingdom, demand
for fama Q can grow effectively. In comparison, the expense of all goods like chemical X and Y
is also smaller compared with profit margin. Therefore, this would be possible in terms of the
financial context for the aforementioned business to manufacture this drug in the UK. However,
suggesting earlier without allowing assessment of the second option would be incorrect. The
findings can be distinguished in comparative study (Ji, Zhou and Liang, 2019).
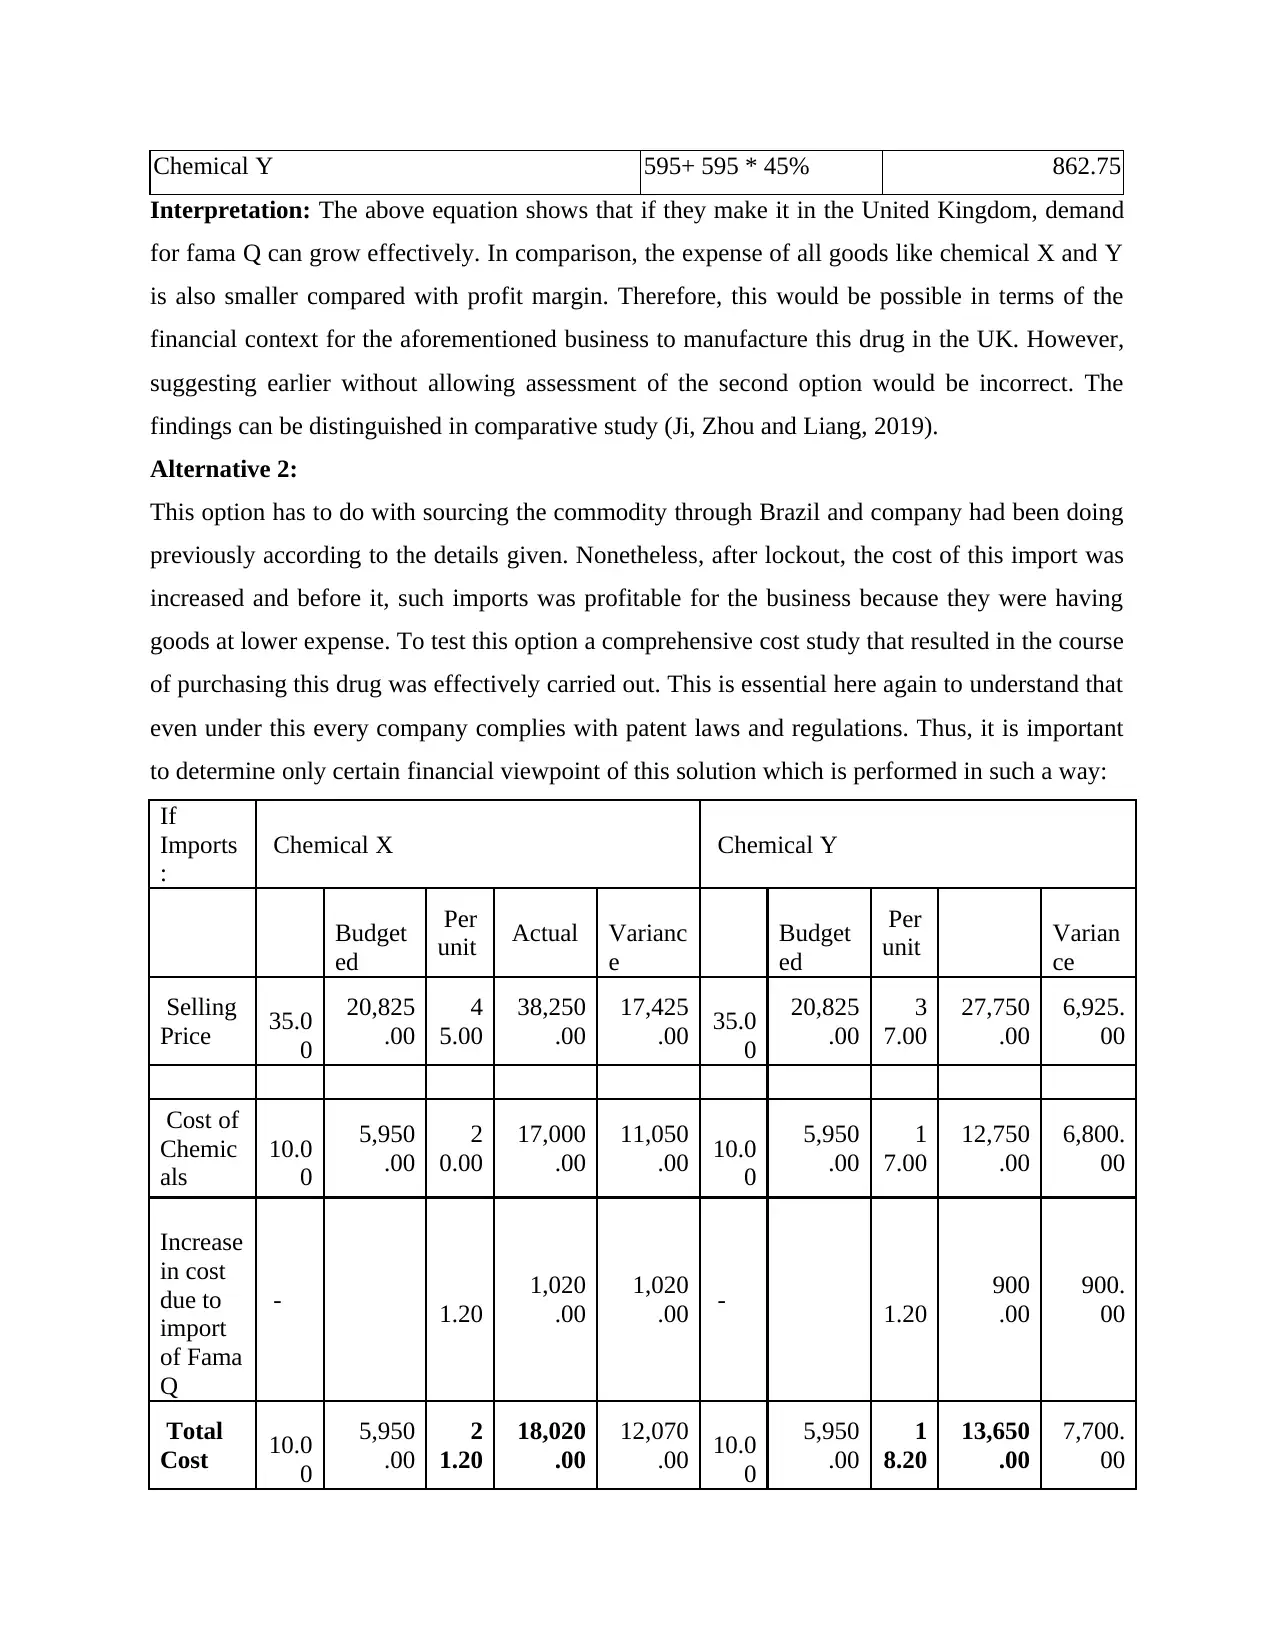
Alternative 2:
This option has to do with sourcing the commodity through Brazil and company had been doing
previously according to the details given. Nonetheless, after lockout, the cost of this import was
increased and before it, such imports was profitable for the business because they were having
goods at lower expense. To test this option a comprehensive cost study that resulted in the course
of purchasing this drug was effectively carried out. This is essential here again to understand that
even under this every company complies with patent laws and regulations. Thus, it is important
to determine only certain financial viewpoint of this solution which is performed in such a way:
If
Imports
:
Chemical X Chemical Y
Budget
ed
Per
unit Actual Varianc
e
Budget
ed
Per
unit Varian
ce
Selling
Price 35.0
0
20,825
.00
4
5.00
38,250
.00
17,425
.00 35.0
0
20,825
.00
3
7.00
27,750
.00
6,925.
00
Cost of
Chemic
als
10.0
0
5,950
.00
2
0.00
17,000
.00
11,050
.00 10.0
0
5,950
.00
1
7.00
12,750
.00
6,800.
00
Increase
in cost
due to
import
of Fama
Q
- 1.20
1,020
.00
1,020
.00 - 1.20
900
.00
900.
00
Total
Cost 10.0
0
5,950
.00
2
1.20
18,020
.00
12,070
.00 10.0
0
5,950
.00
1
8.20
13,650
.00
7,700.
00
Interpretation: The above equation shows that if they make it in the United Kingdom, demand
for fama Q can grow effectively. In comparison, the expense of all goods like chemical X and Y
is also smaller compared with profit margin. Therefore, this would be possible in terms of the
financial context for the aforementioned business to manufacture this drug in the UK. However,
suggesting earlier without allowing assessment of the second option would be incorrect. The
findings can be distinguished in comparative study (Ji, Zhou and Liang, 2019).
Alternative 2:
This option has to do with sourcing the commodity through Brazil and company had been doing
previously according to the details given. Nonetheless, after lockout, the cost of this import was
increased and before it, such imports was profitable for the business because they were having
goods at lower expense. To test this option a comprehensive cost study that resulted in the course
of purchasing this drug was effectively carried out. This is essential here again to understand that
even under this every company complies with patent laws and regulations. Thus, it is important
to determine only certain financial viewpoint of this solution which is performed in such a way:
If
Imports
:
Chemical X Chemical Y
Budget
ed
Per
unit Actual Varianc
e
Budget
ed
Per
unit Varian
ce
Selling
Price 35.0
0
20,825
.00
4
5.00
38,250
.00
17,425
.00 35.0
0
20,825
.00
3
7.00
27,750
.00
6,925.
00
Cost of
Chemic
als
10.0
0
5,950
.00
2
0.00
17,000
.00
11,050
.00 10.0
0
5,950
.00
1
7.00
12,750
.00
6,800.
00
Increase
in cost
due to
import
of Fama
Q
- 1.20
1,020
.00
1,020
.00 - 1.20
900
.00
900.
00
Total
Cost 10.0
0
5,950
.00
2
1.20
18,020
.00
12,070
.00 10.0
0
5,950
.00
1
8.20
13,650
.00
7,700.
00
⊘ This is a preview!⊘
Do you want full access?
Subscribe today to unlock all pages.
Trusted by 1+ million students worldwide
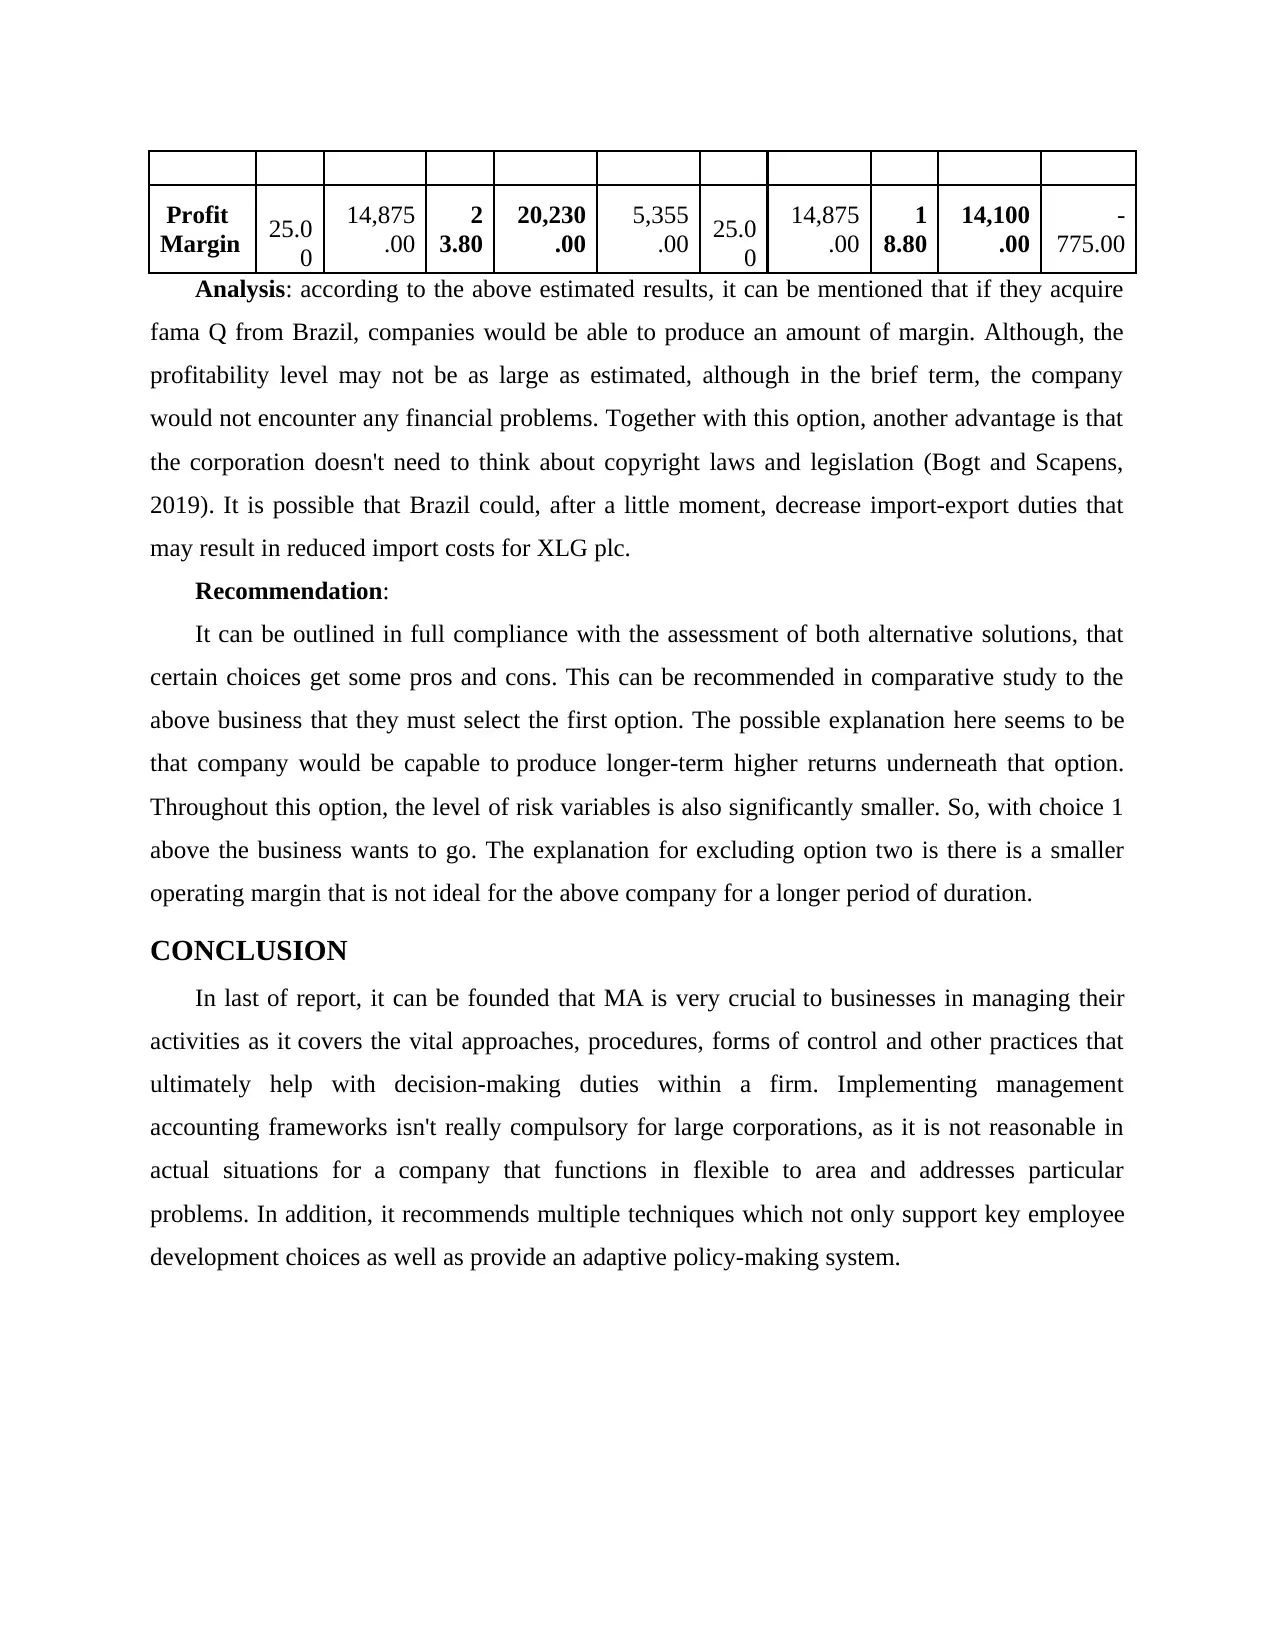
Profit
Margin 25.0
0
14,875
.00
2
3.80
20,230
.00
5,355
.00 25.0
0
14,875
.00
1
8.80
14,100
.00
-
775.00
Analysis: according to the above estimated results, it can be mentioned that if they acquire
fama Q from Brazil, companies would be able to produce an amount of margin. Although, the
profitability level may not be as large as estimated, although in the brief term, the company
would not encounter any financial problems. Together with this option, another advantage is that
the corporation doesn't need to think about copyright laws and legislation (Bogt and Scapens,
2019). It is possible that Brazil could, after a little moment, decrease import-export duties that
may result in reduced import costs for XLG plc.
Recommendation:
It can be outlined in full compliance with the assessment of both alternative solutions, that
certain choices get some pros and cons. This can be recommended in comparative study to the
above business that they must select the first option. The possible explanation here seems to be
that company would be capable to produce longer-term higher returns underneath that option.
Throughout this option, the level of risk variables is also significantly smaller. So, with choice 1
above the business wants to go. The explanation for excluding option two is there is a smaller
operating margin that is not ideal for the above company for a longer period of duration.
CONCLUSION
In last of report, it can be founded that MA is very crucial to businesses in managing their
activities as it covers the vital approaches, procedures, forms of control and other practices that
ultimately help with decision-making duties within a firm. Implementing management
accounting frameworks isn't really compulsory for large corporations, as it is not reasonable in
actual situations for a company that functions in flexible to area and addresses particular
problems. In addition, it recommends multiple techniques which not only support key employee
development choices as well as provide an adaptive policy-making system.
Paraphrase This Document
Need a fresh take? Get an instant paraphrase of this document with our AI Paraphraser
REFERENCES
Books and Journals
Choi, T.M., Wen, X., Sun, X. and Chung, S.H., 2019. The mean-variance approach for global
supply chain risk analysis with air logistics in the blockchain technology
era. Transportation Research Part E: Logistics and Transportation Review, 127, pp.178-
191.
Chorley, R.J. ed., 2019. Spatial analysis in geomorphology. Routledge.
Ferdous, M.I., Adams, C.A. and Boyce, G., 2019. Institutional drivers of environmental
management accounting adoption in public sector water organisations. Accounting,
Auditing & Accountability Journal.
Ji, K., Wang, Z., Zhou, Y. and Liang, Y., 2019. Improved zeroth-order variance reduced
algorithms and analysis for nonconvex optimization. arXiv preprint arXiv:1910.12166.
Lei, H., Liu, J. and Zhang, L., 2019, December. Tourism Image Endorsement Based on
Experiment and Variance Analysis. In IOP Conference Series: Earth and Environmental
Science (Vol. 371, No. 5, p. 052001). IOP Publishing.
Salles, T., Rocha, L. and Gonçalves, M., 2020. A bias-variance analysis of state-of-the-art
random forest text classifiers. Advances in Data Analysis and Classification, pp.1-27.
Telesca, L., Guignard, F., Helbig, N. and Kanevski, M., 2019. Wavelet Scale Variance Analysis
of Wind Extremes in Mountainous Terrains. Energies, 12(16), p.3048.
ter Bogt, H.J. and Scapens, R.W., 2019. Institutions, situated rationality and agency in
management accounting. Accounting, Auditing & Accountability Journal.
Vaske, J.J., 2019. Survey research and analysis. Sagamore-Venture. 1807 North Federal Drive,
Urbana, IL 61801.
Zhang, Z.C., 2020. Variance analysis of linear canonical Wigner distribution. Optik, p.164633.
1 out of 11
Related Documents


Your All-in-One AI-Powered Toolkit for Academic Success.
+13062052269
info@desklib.com
Available 24*7 on WhatsApp / Email
![[object Object]](/_next/static/media/star-bottom.7253800d.svg)
Unlock your academic potential
Copyright © 2020–2026 A2Z Services. All Rights Reserved. Developed and managed by ZUCOL.