Management Accounting Report: XLG Company's Performance Analysis
VerifiedAdded on 2023/01/09
|13
|3284
|59
Report
AI Summary
This management accounting report provides a comprehensive analysis of XLG company's financial performance, focusing on variance analysis. The report begins with an introduction to management accounting and its role in decision-making, followed by a detailed examination of sales price variance, sales volume contribution variance, material price planning variance, and material price operational variance. The analysis includes calculations and formulas for each variance, providing insights into the company's performance. Furthermore, the report critically analyzes the merits and demerits of using variances in assessing managers' performance, offering a balanced perspective. Part B explores the decision of whether XLG should manufacture a product at home or import it, considering patent regulations and financial implications. The report concludes with a summary of findings and recommendations, offering valuable insights for financial decision-making.

Management
Accounting - Report
Accounting - Report
Paraphrase This Document
Need a fresh take? Get an instant paraphrase of this document with our AI Paraphraser
Contents
INTRODUCTION...........................................................................................................................3
MAIN BODY..................................................................................................................................3
Part A:..........................................................................................................................................3
Part B:..........................................................................................................................................8
CONCLUSION..............................................................................................................................11
REFERENCES..............................................................................................................................13
INTRODUCTION
The financial transactions of a company need to be recorded in an effective manner so that
better decisions can be carried out. In this aspect management accounting (MA) plays a key role
as this is linked to analysing, interpreting financial and non-financial data in a systematic way so
that managers can get needed data at the time of decision making (Chorley, 2019). The project
report is based on a company which is XLG, this company produces different types of cleaning
products and sell all around the United Kingdom. On the basis of provided information about
company, part A and B are covered in report that consists distinct information. In part A,
information about calculation of different variances along with merits and demerits is included.
While part B analysis is done about whether company should apply make product at home or
import from other nation.
MAIN BODY
Part A:
(i) Sales price and volume contribution variance.
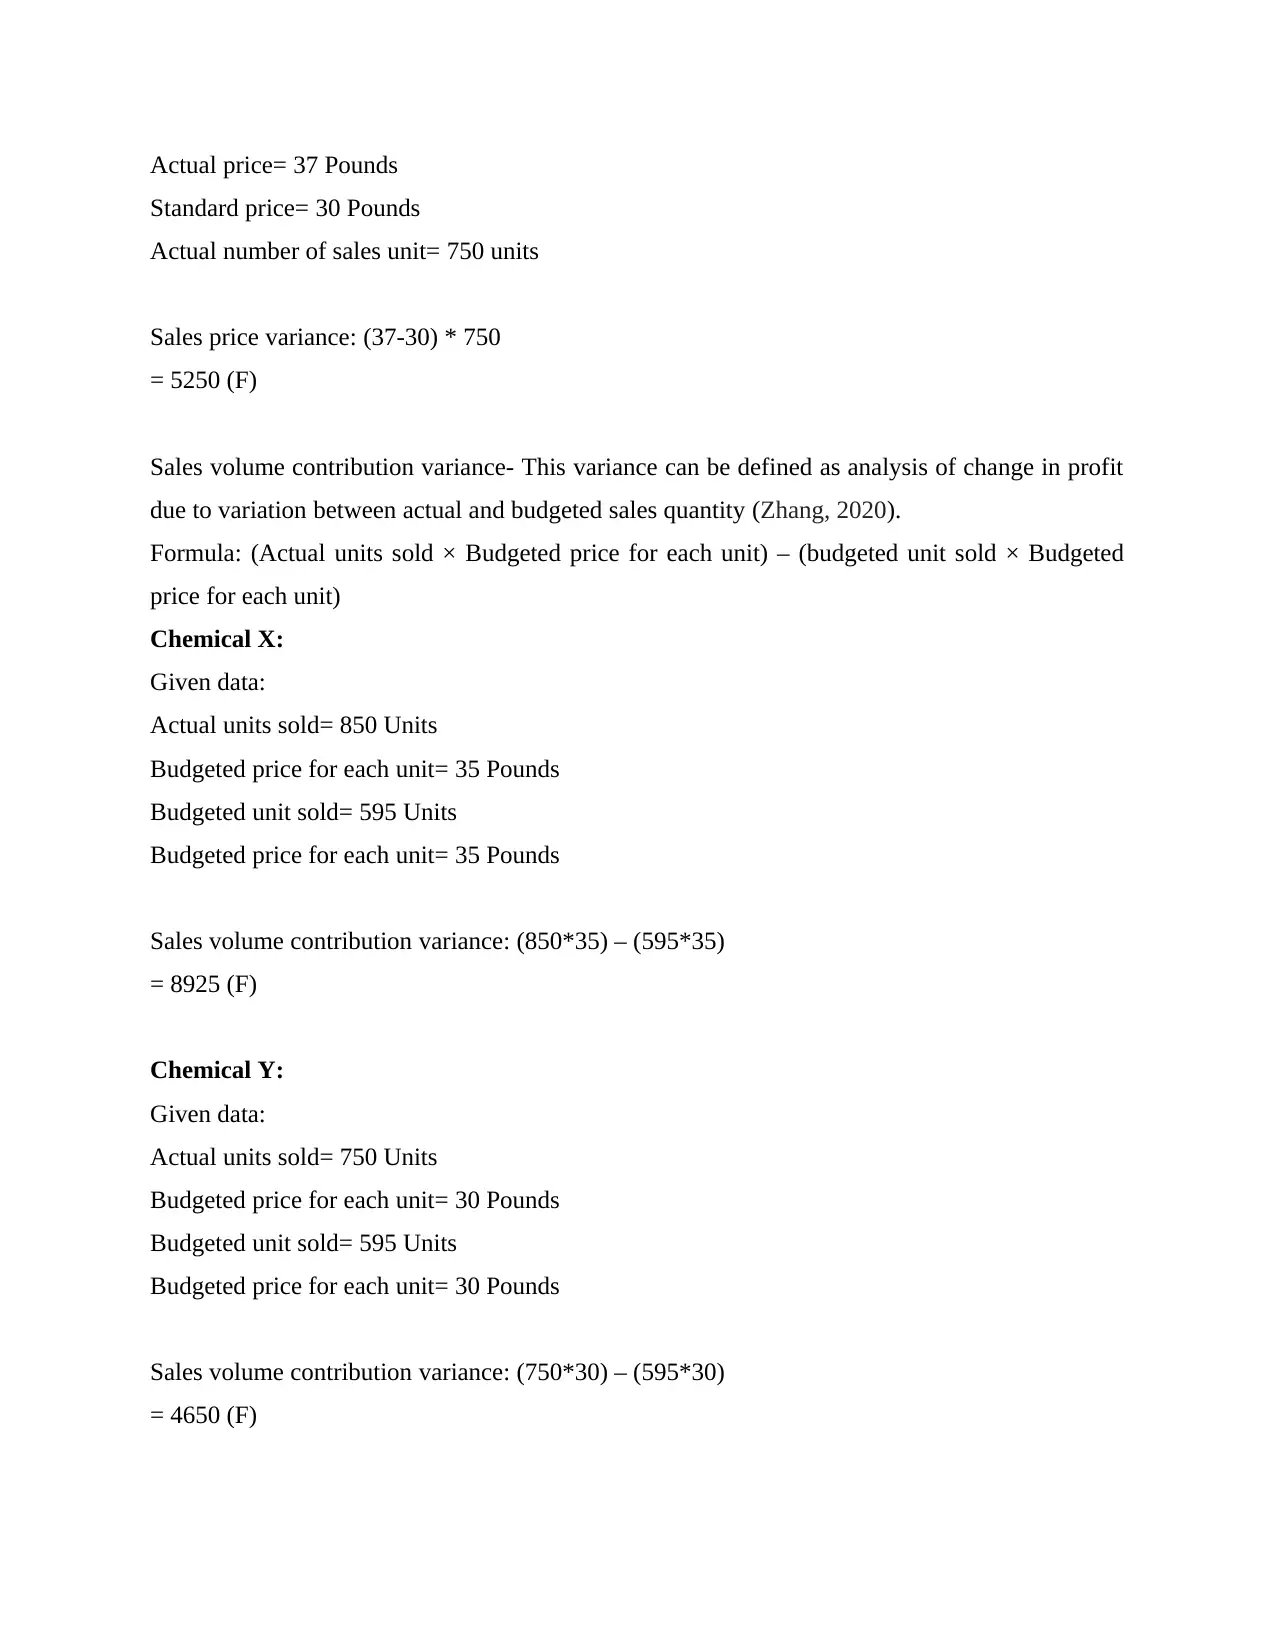
Sales Price Variance- This variance can be defined as difference between actual sales of
market price and actual sales at budgeted price. In accordance of given data, calculation of this
variance has been done in such manner:
Formula: (Actual Price-Standard price) x Actual number of units
Chemical X:
Given data:
Actual price= 45 Pounds
Standard price= 35 Pounds
Actual number of sales unit= 850 units
Sales price variance: (45-35) *850
= 8500 (F)
Chemical Y:
Given data:
The financial transactions of a company need to be recorded in an effective manner so that
better decisions can be carried out. In this aspect management accounting (MA) plays a key role
as this is linked to analysing, interpreting financial and non-financial data in a systematic way so
that managers can get needed data at the time of decision making (Chorley, 2019). The project
report is based on a company which is XLG, this company produces different types of cleaning
products and sell all around the United Kingdom. On the basis of provided information about
company, part A and B are covered in report that consists distinct information. In part A,
information about calculation of different variances along with merits and demerits is included.
While part B analysis is done about whether company should apply make product at home or
import from other nation.
MAIN BODY
Part A:
(i) Sales price and volume contribution variance.
Sales Price Variance- This variance can be defined as difference between actual sales of
market price and actual sales at budgeted price. In accordance of given data, calculation of this
variance has been done in such manner:
Formula: (Actual Price-Standard price) x Actual number of units
Chemical X:
Given data:
Actual price= 45 Pounds
Standard price= 35 Pounds
Actual number of sales unit= 850 units
Sales price variance: (45-35) *850
= 8500 (F)
Chemical Y:
Given data:
⊘ This is a preview!⊘
Do you want full access?
Subscribe today to unlock all pages.
Trusted by 1+ million students worldwide
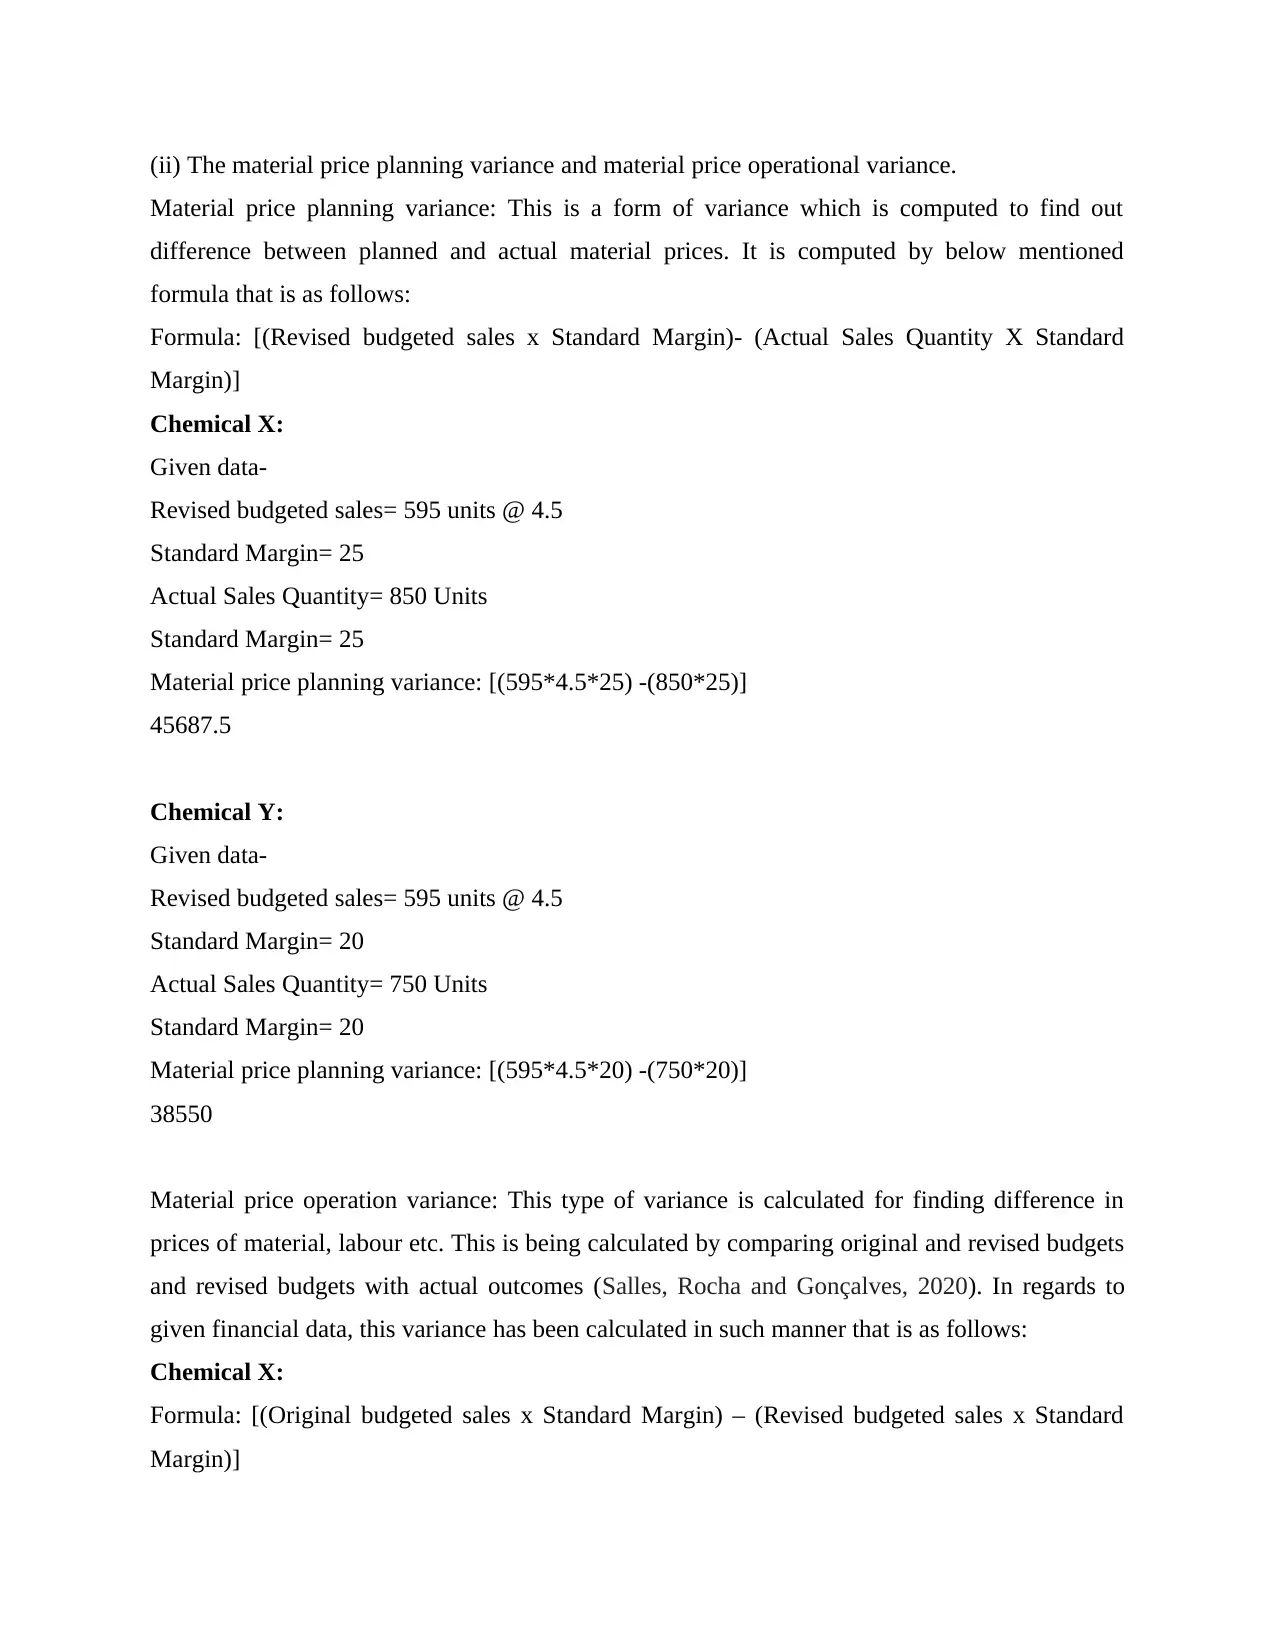
Actual price= 37 Pounds
Standard price= 30 Pounds
Actual number of sales unit= 750 units
Sales price variance: (37-30) * 750
= 5250 (F)
Sales volume contribution variance- This variance can be defined as analysis of change in profit
due to variation between actual and budgeted sales quantity (Zhang, 2020).
Formula: (Actual units sold × Budgeted price for each unit) – (budgeted unit sold × Budgeted
price for each unit)
Chemical X:
Given data:
Actual units sold= 850 Units
Budgeted price for each unit= 35 Pounds
Budgeted unit sold= 595 Units
Budgeted price for each unit= 35 Pounds
Sales volume contribution variance: (850*35) – (595*35)
= 8925 (F)
Chemical Y:
Given data:
Actual units sold= 750 Units
Budgeted price for each unit= 30 Pounds
Budgeted unit sold= 595 Units
Budgeted price for each unit= 30 Pounds
Sales volume contribution variance: (750*30) – (595*30)
= 4650 (F)
Paraphrase This Document
Need a fresh take? Get an instant paraphrase of this document with our AI Paraphraser
(ii) The material price planning variance and material price operational variance.
Material price planning variance: This is a form of variance which is computed to find out
difference between planned and actual material prices. It is computed by below mentioned
formula that is as follows:
Formula: [(Revised budgeted sales x Standard Margin)- (Actual Sales Quantity X Standard
Margin)]
Chemical X:
Given data-
Revised budgeted sales= 595 units @ 4.5
Standard Margin= 25
Actual Sales Quantity= 850 Units
Standard Margin= 25
Material price planning variance: [(595*4.5*25) -(850*25)]
45687.5
Chemical Y:
Given data-
Revised budgeted sales= 595 units @ 4.5
Standard Margin= 20
Actual Sales Quantity= 750 Units
Standard Margin= 20
Material price planning variance: [(595*4.5*20) -(750*20)]
38550
Material price operation variance: This type of variance is calculated for finding difference in
prices of material, labour etc. This is being calculated by comparing original and revised budgets
and revised budgets with actual outcomes (Salles, Rocha and Gonçalves, 2020). In regards to
given financial data, this variance has been calculated in such manner that is as follows:
Chemical X:
Formula: [(Original budgeted sales x Standard Margin) – (Revised budgeted sales x Standard
Margin)]
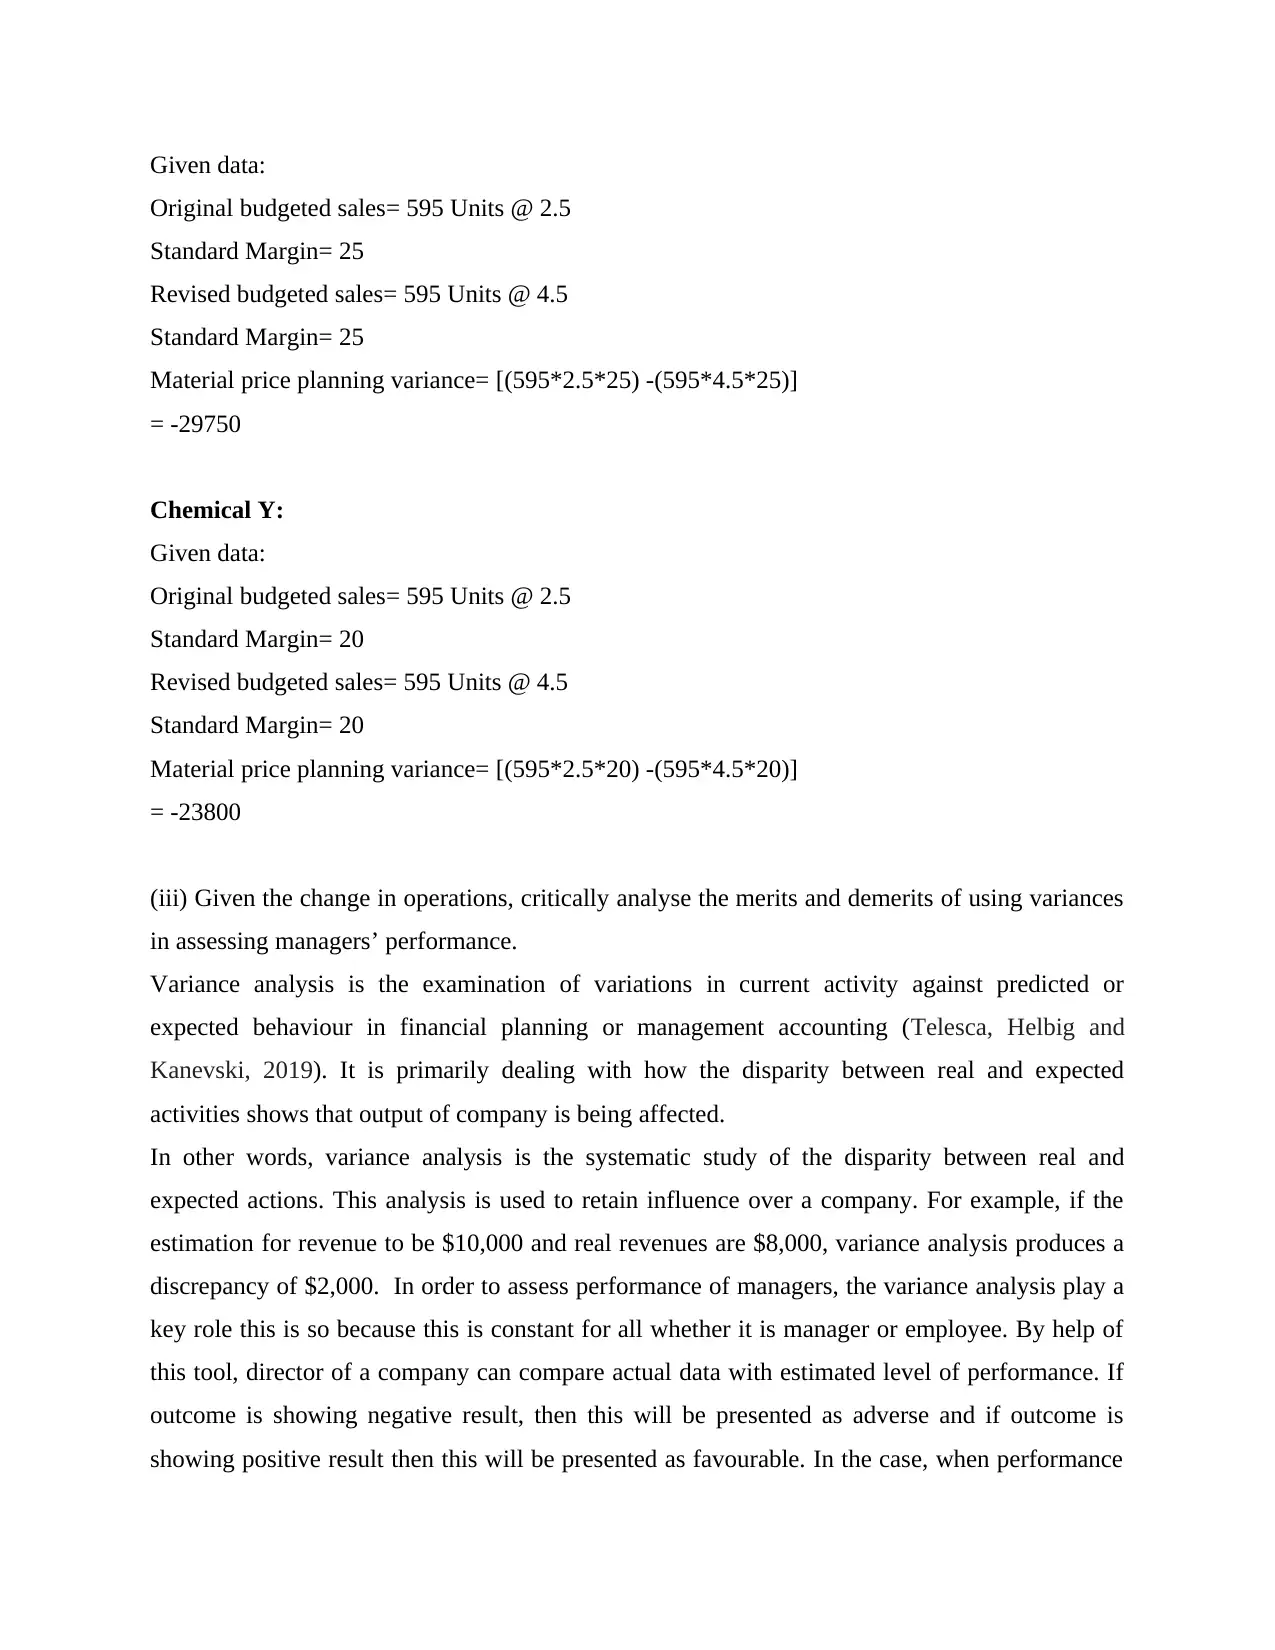
Given data:
Original budgeted sales= 595 Units @ 2.5
Standard Margin= 25
Revised budgeted sales= 595 Units @ 4.5
Standard Margin= 25
Material price planning variance= [(595*2.5*25) -(595*4.5*25)]
= -29750
Chemical Y:
Given data:
Original budgeted sales= 595 Units @ 2.5
Standard Margin= 20
Revised budgeted sales= 595 Units @ 4.5
Standard Margin= 20
Material price planning variance= [(595*2.5*20) -(595*4.5*20)]
= -23800
(iii) Given the change in operations, critically analyse the merits and demerits of using variances
in assessing managers’ performance.
Variance analysis is the examination of variations in current activity against predicted or
expected behaviour in financial planning or management accounting (Telesca, Helbig and
Kanevski, 2019). It is primarily dealing with how the disparity between real and expected
activities shows that output of company is being affected.
In other words, variance analysis is the systematic study of the disparity between real and
expected actions. This analysis is used to retain influence over a company. For example, if the
estimation for revenue to be $10,000 and real revenues are $8,000, variance analysis produces a
discrepancy of $2,000. In order to assess performance of managers, the variance analysis play a
key role this is so because this is constant for all whether it is manager or employee. By help of
this tool, director of a company can compare actual data with estimated level of performance. If
outcome is showing negative result, then this will be presented as adverse and if outcome is
showing positive result then this will be presented as favourable. In the case, when performance
Original budgeted sales= 595 Units @ 2.5
Standard Margin= 25
Revised budgeted sales= 595 Units @ 4.5
Standard Margin= 25
Material price planning variance= [(595*2.5*25) -(595*4.5*25)]
= -29750
Chemical Y:
Given data:
Original budgeted sales= 595 Units @ 2.5
Standard Margin= 20
Revised budgeted sales= 595 Units @ 4.5
Standard Margin= 20
Material price planning variance= [(595*2.5*20) -(595*4.5*20)]
= -23800
(iii) Given the change in operations, critically analyse the merits and demerits of using variances
in assessing managers’ performance.
Variance analysis is the examination of variations in current activity against predicted or
expected behaviour in financial planning or management accounting (Telesca, Helbig and
Kanevski, 2019). It is primarily dealing with how the disparity between real and expected
activities shows that output of company is being affected.
In other words, variance analysis is the systematic study of the disparity between real and
expected actions. This analysis is used to retain influence over a company. For example, if the
estimation for revenue to be $10,000 and real revenues are $8,000, variance analysis produces a
discrepancy of $2,000. In order to assess performance of managers, the variance analysis play a
key role this is so because this is constant for all whether it is manager or employee. By help of
this tool, director of a company can compare actual data with estimated level of performance. If
outcome is showing negative result, then this will be presented as adverse and if outcome is
showing positive result then this will be presented as favourable. In the case, when performance
⊘ This is a preview!⊘
Do you want full access?
Subscribe today to unlock all pages.
Trusted by 1+ million students worldwide
of managers is showing adverse outcome then this can be estimated that manager is not able to
deliver targeted goals. In respect to assess performance of manager, this is important that their
performance need to be assessed at the end of financial year. In between of a financial year, their
performance cannot be evaluated in a better way (Choi, Sun and Chung, 2019).
In the absence of applying this method performance analysis, this can become difficult for
companies to measure actual level of performance. Such as in regards to above mentioned
company, they can apply variance analysis method in order to find out value of actual
performance. Apart from the assessment of performance of managers, this is also useful for
analysing performance of employees and activities too. It is so because on the basis of this, a
manager of company can track variance between actual cost and estimated cost. As well as
individual level of performance of each employee is also computed by help of this tool. Herein,
below some key merits and demerits of using this technique for assessing managers’
performance is mentioned in such manner that is as follows:
Merits-
Variance analysis encourages effective budgeting operation because management aims to
see smaller variations from the expected budgets. Wanting a smaller variance typically
allows administrators to make comprehensive, forward-looking financial choices. In
other words, by help of this managers can focus on those activities whose variance is
favourable. Due to this it becomes viable for an organization to consider beneficial
activities instead of unfavourable activities.
Variance analysis serves as a control method. Assessment of deviations on basic
essentials assists the business in understanding the problem, and it help managers look
into potential ways of how much difference can be prevented (Vaske, 2019). It results as
better performance of a company because managers become able to know that on which
activities or operations adverse variance is acceptable on which this is not viable. As a
consequence, management of a company prepares effective and viable strategies which
may lead to better performance in each condition.
Variance analysis encourages determining liability and activates management systems on
organizations when it is necessary. For example, if labour performance variance is
considered to be unfavourable or production over raw material cost variance is
unfavourable, the management should improve regulation over certain divisions to
Paraphrase This Document
Need a fresh take? Get an instant paraphrase of this document with our AI Paraphraser
maximize output. In other words, it gives an overview about what kinds of policies are
need to be carried out in order to enhance performance of various kinds of activities and
operations for a particular time period.
Demerits:
Variance analysis as an operation is focused on financial statements, which are published
far longer after period closing; there will be a time delay and can impact the corrective
measures taking the opportunity to a certain degree (Lei, Liu and Zhang, 2019). Also, not
all causes of variation can be included in accounting records, which renders acting upon
variances challenging.
In addition to this, the another drawback of variance analysis is that it cannot be applied
on non-financial aspects. This can be applied only in the case of financial data analysis
such as making comparison of standard and actual data related to cost, income etc.
Another issue of variance analysis method is that managers can manipulate the data
which are used in this approach. If presented financial data are wrong, then this may
become difficult for companies to find out correct variance of different kinds of activities
and operations. Due to this issue, the actual evaluation of performance of managers can
be wrong and organization will not be able to make effective policies to gain higher
profitability.
So these some key benefits and drawbacks of using above mentioned technique of variance
analysis. This is essential for companies that how well they are applying it for assessing
performance of their managers and employees. The efficiency and accuracy of produced
outcome under this method highly depends on provided financial data for comparison. If
provided data are correct then variances will also be right (Ferdous, Adams and Boyce, 2019). In
addition, this method cannot be applied for managers because they have right to manipulate
actual data and due to which actual evaluation of their performance cannot be done.
Part B:
As in the above part, this has been explained that if XLG company imports the fama Q product
from Brazil then their cost of acquiring this product is increasing. Before lockdown the price of
this product was around 2.50 pounds for each unit but after lockdown price raised and it became
of 3.70 pounds per unit for XLG. Due to this company increase their mark-up price till 4.50
pounds for each unit of fama Q. Along with, this company has patent of this product which
indicates that only they have right to sell this in all around the United Kingdom. In this critical
condition, above company has two alternatives which is to produce this product at home or
import product from Brazil which they were doing earlier. In both alternatives, there are some
issues now company has to choose only one which is suitable and less costly. In the below part,
analysis of both alternatives is done in such manner:
Alternative one:
The option one is related to making production of fama Q in United Kingdom till cost of
import reduces in Brazil. The main issue under this alternative is that it will be against rules and
regulation of patent. As per the law, this is essential for an entity who has patent on a product to
import or make production under certain guidelines. For XLG plc, this can become difficult to do
production as per the rulebook of patent. This is so because they do not have enough knowledge
about manufacturing of Fama Q because they were importing it from Brazil so there is a risk that
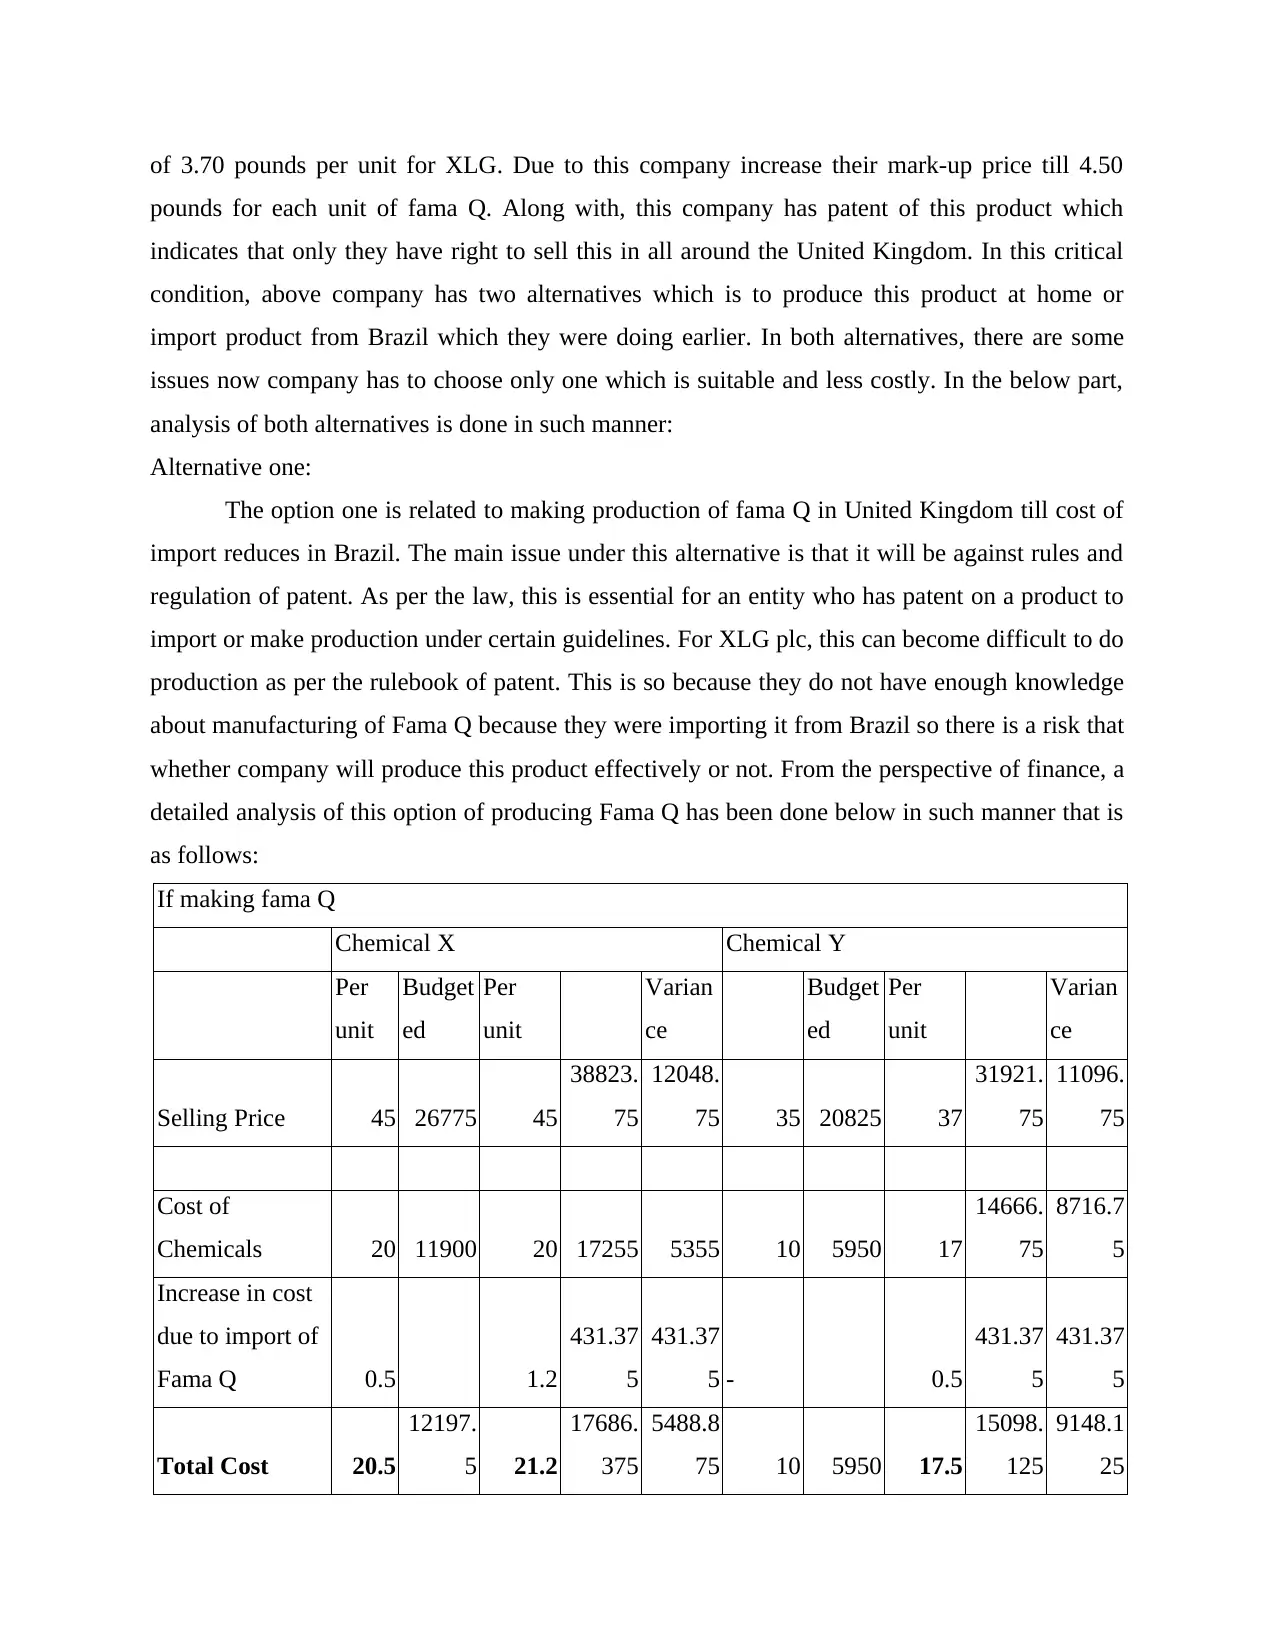
whether company will produce this product effectively or not. From the perspective of finance, a
detailed analysis of this option of producing Fama Q has been done below in such manner that is
as follows:
If making fama Q
Chemical X Chemical Y
Per
unit
Budget
ed
Per
unit
Varian
ce
Budget
ed
Per
unit
Varian
ce
Selling Price 45 26775 45
38823.
75
12048.
75 35 20825 37
31921.
75
11096.
75
Cost of
Chemicals 20 11900 20 17255 5355 10 5950 17
14666.
75
8716.7
5
Increase in cost
due to import of
Fama Q 0.5 1.2
431.37
5
431.37
5 - 0.5
431.37
5
431.37
5
Total Cost 20.5
12197.
5 21.2
17686.
375
5488.8
75 10 5950 17.5
15098.
125
9148.1
25
pounds for each unit of fama Q. Along with, this company has patent of this product which
indicates that only they have right to sell this in all around the United Kingdom. In this critical
condition, above company has two alternatives which is to produce this product at home or
import product from Brazil which they were doing earlier. In both alternatives, there are some
issues now company has to choose only one which is suitable and less costly. In the below part,
analysis of both alternatives is done in such manner:
Alternative one:
The option one is related to making production of fama Q in United Kingdom till cost of
import reduces in Brazil. The main issue under this alternative is that it will be against rules and
regulation of patent. As per the law, this is essential for an entity who has patent on a product to
import or make production under certain guidelines. For XLG plc, this can become difficult to do
production as per the rulebook of patent. This is so because they do not have enough knowledge
about manufacturing of Fama Q because they were importing it from Brazil so there is a risk that
whether company will produce this product effectively or not. From the perspective of finance, a
detailed analysis of this option of producing Fama Q has been done below in such manner that is
as follows:
If making fama Q
Chemical X Chemical Y
Per
unit
Budget
ed
Per
unit
Varian
ce
Budget
ed
Per
unit
Varian
ce
Selling Price 45 26775 45
38823.
75
12048.
75 35 20825 37
31921.
75
11096.
75
Cost of
Chemicals 20 11900 20 17255 5355 10 5950 17
14666.
75
8716.7
5
Increase in cost
due to import of
Fama Q 0.5 1.2
431.37
5
431.37
5 - 0.5
431.37
5
431.37
5
Total Cost 20.5
12197.
5 21.2
17686.
375
5488.8
75 10 5950 17.5
15098.
125
9148.1
25
⊘ This is a preview!⊘
Do you want full access?
Subscribe today to unlock all pages.
Trusted by 1+ million students worldwide
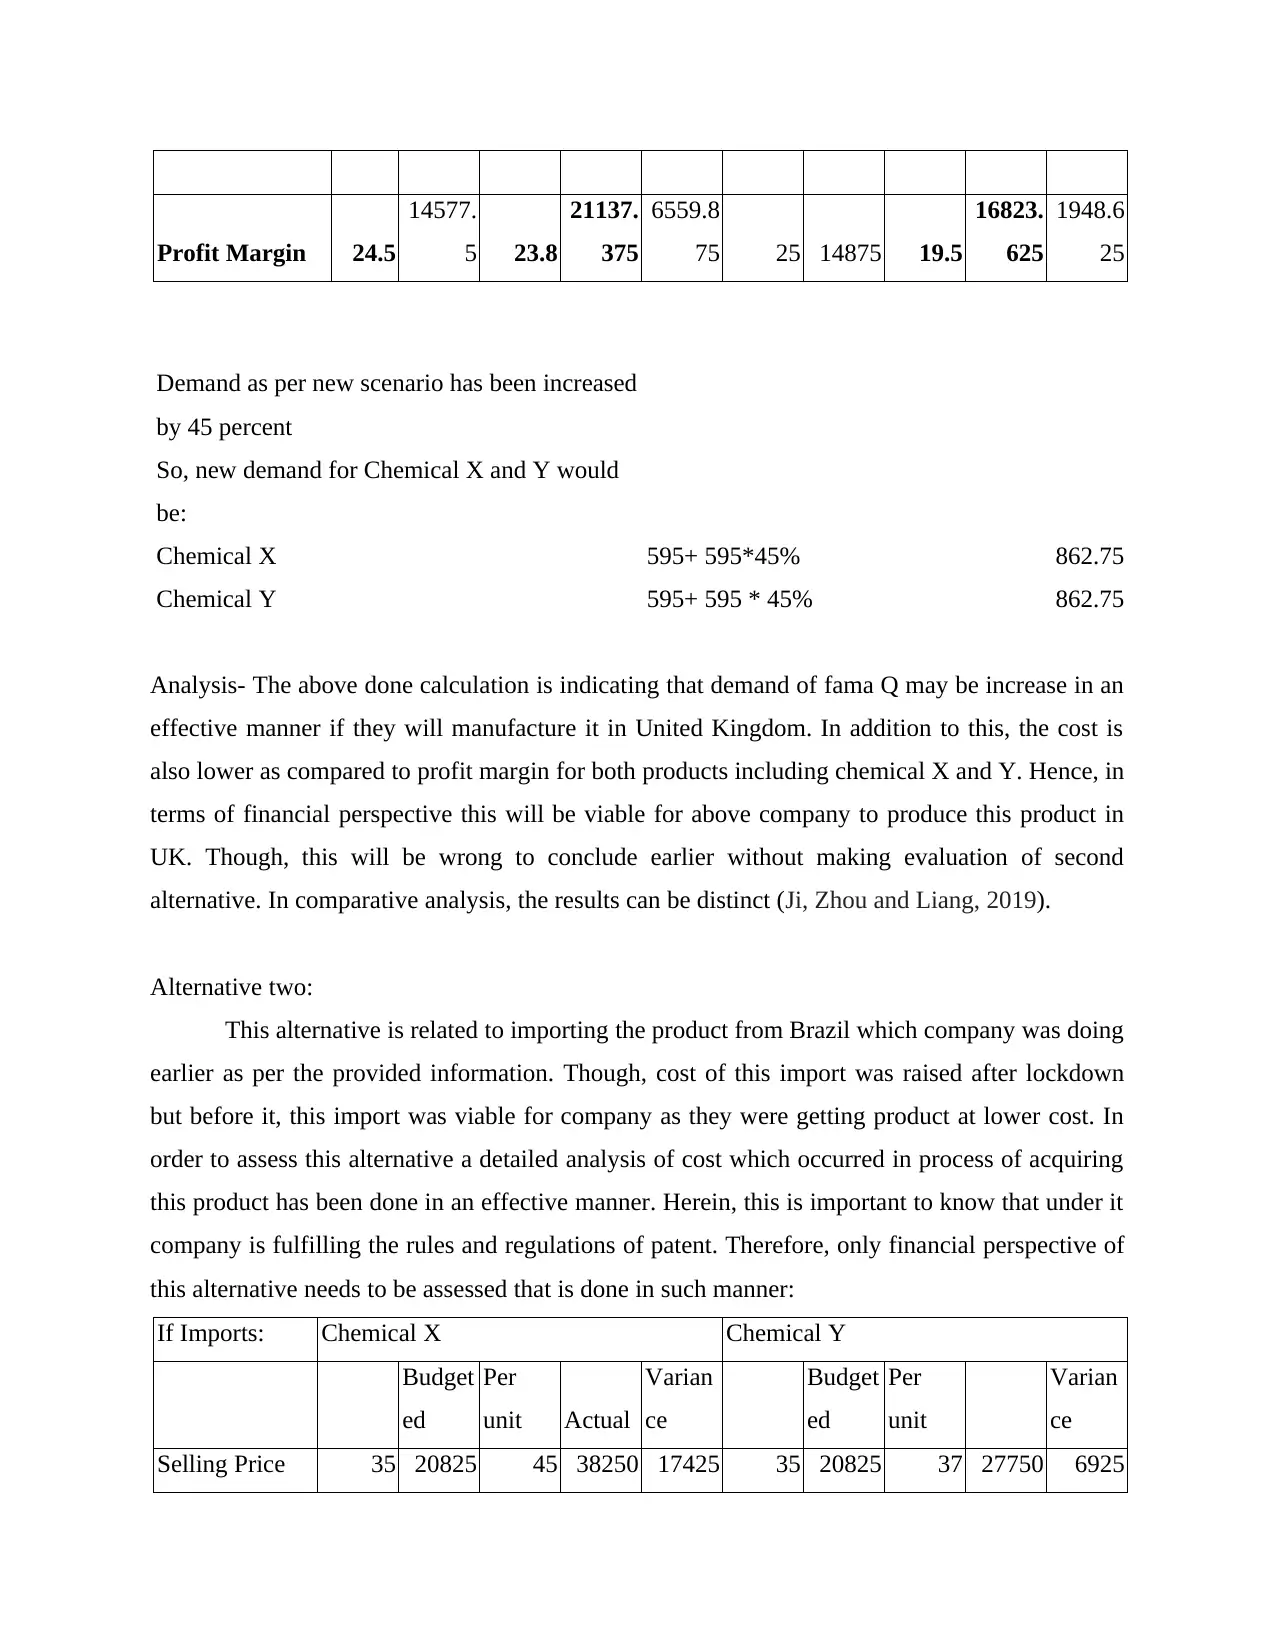
Profit Margin 24.5
14577.
5 23.8
21137.
375
6559.8
75 25 14875 19.5
16823.
625
1948.6
25
Demand as per new scenario has been increased
by 45 percent
So, new demand for Chemical X and Y would
be:
Chemical X 595+ 595*45% 862.75
Chemical Y 595+ 595 * 45% 862.75
Analysis- The above done calculation is indicating that demand of fama Q may be increase in an
effective manner if they will manufacture it in United Kingdom. In addition to this, the cost is
also lower as compared to profit margin for both products including chemical X and Y. Hence, in
terms of financial perspective this will be viable for above company to produce this product in
UK. Though, this will be wrong to conclude earlier without making evaluation of second
alternative. In comparative analysis, the results can be distinct (Ji, Zhou and Liang, 2019).
Alternative two:
This alternative is related to importing the product from Brazil which company was doing
earlier as per the provided information. Though, cost of this import was raised after lockdown
but before it, this import was viable for company as they were getting product at lower cost. In
order to assess this alternative a detailed analysis of cost which occurred in process of acquiring
this product has been done in an effective manner. Herein, this is important to know that under it
company is fulfilling the rules and regulations of patent. Therefore, only financial perspective of
this alternative needs to be assessed that is done in such manner:
If Imports: Chemical X Chemical Y
Budget
ed
Per
unit Actual
Varian
ce
Budget
ed
Per
unit
Varian
ce
Selling Price 35 20825 45 38250 17425 35 20825 37 27750 6925
Paraphrase This Document
Need a fresh take? Get an instant paraphrase of this document with our AI Paraphraser
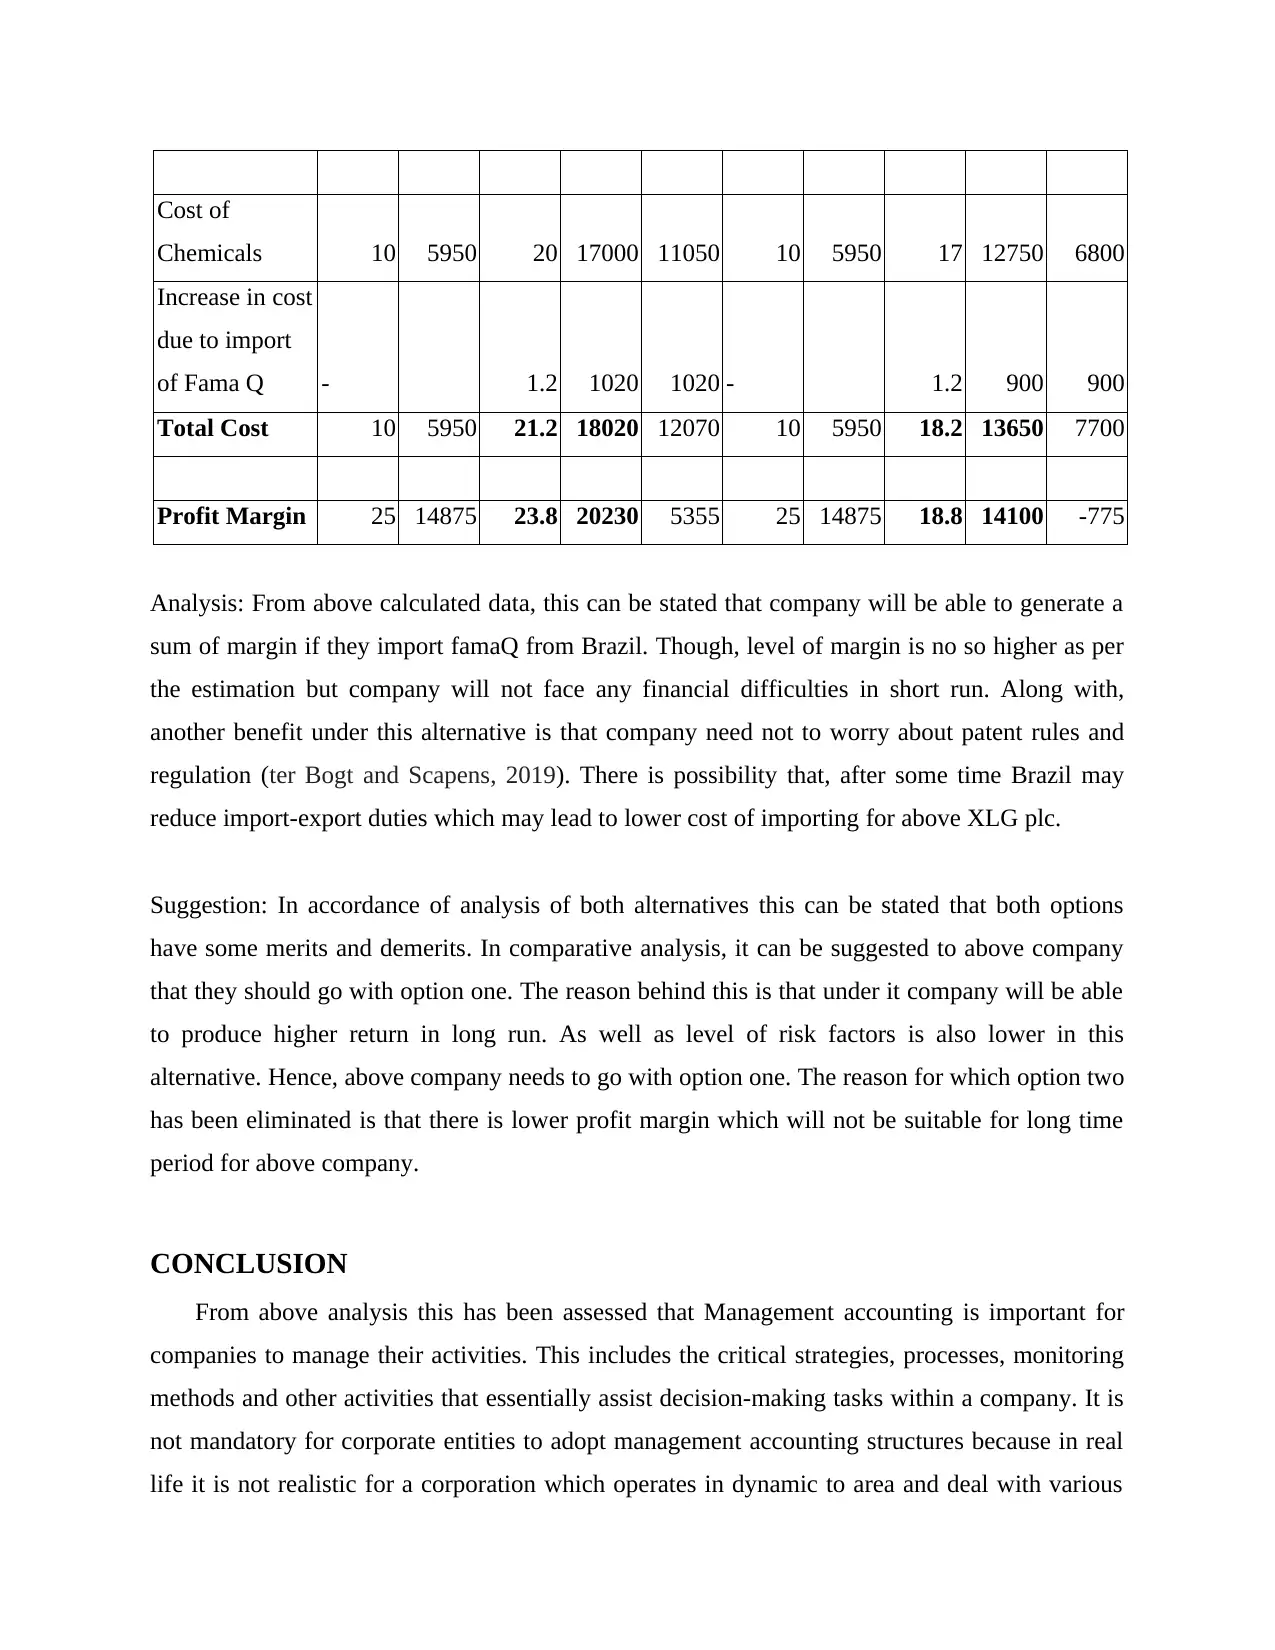
Cost of
Chemicals 10 5950 20 17000 11050 10 5950 17 12750 6800
Increase in cost
due to import
of Fama Q - 1.2 1020 1020 - 1.2 900 900
Total Cost 10 5950 21.2 18020 12070 10 5950 18.2 13650 7700
Profit Margin 25 14875 23.8 20230 5355 25 14875 18.8 14100 -775
Analysis: From above calculated data, this can be stated that company will be able to generate a
sum of margin if they import famaQ from Brazil. Though, level of margin is no so higher as per
the estimation but company will not face any financial difficulties in short run. Along with,
another benefit under this alternative is that company need not to worry about patent rules and
regulation (ter Bogt and Scapens, 2019). There is possibility that, after some time Brazil may
reduce import-export duties which may lead to lower cost of importing for above XLG plc.
Suggestion: In accordance of analysis of both alternatives this can be stated that both options
have some merits and demerits. In comparative analysis, it can be suggested to above company
that they should go with option one. The reason behind this is that under it company will be able
to produce higher return in long run. As well as level of risk factors is also lower in this
alternative. Hence, above company needs to go with option one. The reason for which option two
has been eliminated is that there is lower profit margin which will not be suitable for long time
period for above company.
CONCLUSION
From above analysis this has been assessed that Management accounting is important for
companies to manage their activities. This includes the critical strategies, processes, monitoring
methods and other activities that essentially assist decision-making tasks within a company. It is
not mandatory for corporate entities to adopt management accounting structures because in real
life it is not realistic for a corporation which operates in dynamic to area and deal with various

issues. Furthermore, it recommends many strategies that not only help key decisions of
developing employees but also provide an assistive system for creation of policies.
developing employees but also provide an assistive system for creation of policies.
⊘ This is a preview!⊘
Do you want full access?
Subscribe today to unlock all pages.
Trusted by 1+ million students worldwide
1 out of 13
Related Documents


Your All-in-One AI-Powered Toolkit for Academic Success.
+13062052269
info@desklib.com
Available 24*7 on WhatsApp / Email
![[object Object]](/_next/static/media/star-bottom.7253800d.svg)
Unlock your academic potential
Copyright © 2020–2026 A2Z Services. All Rights Reserved. Developed and managed by ZUCOL.