FEB 2021 - XS4006 Business Statistics: Probability and Regression

Verified

Added on  2023/06/18

|12
|1227
|472
Homework Assignment
AI Summary
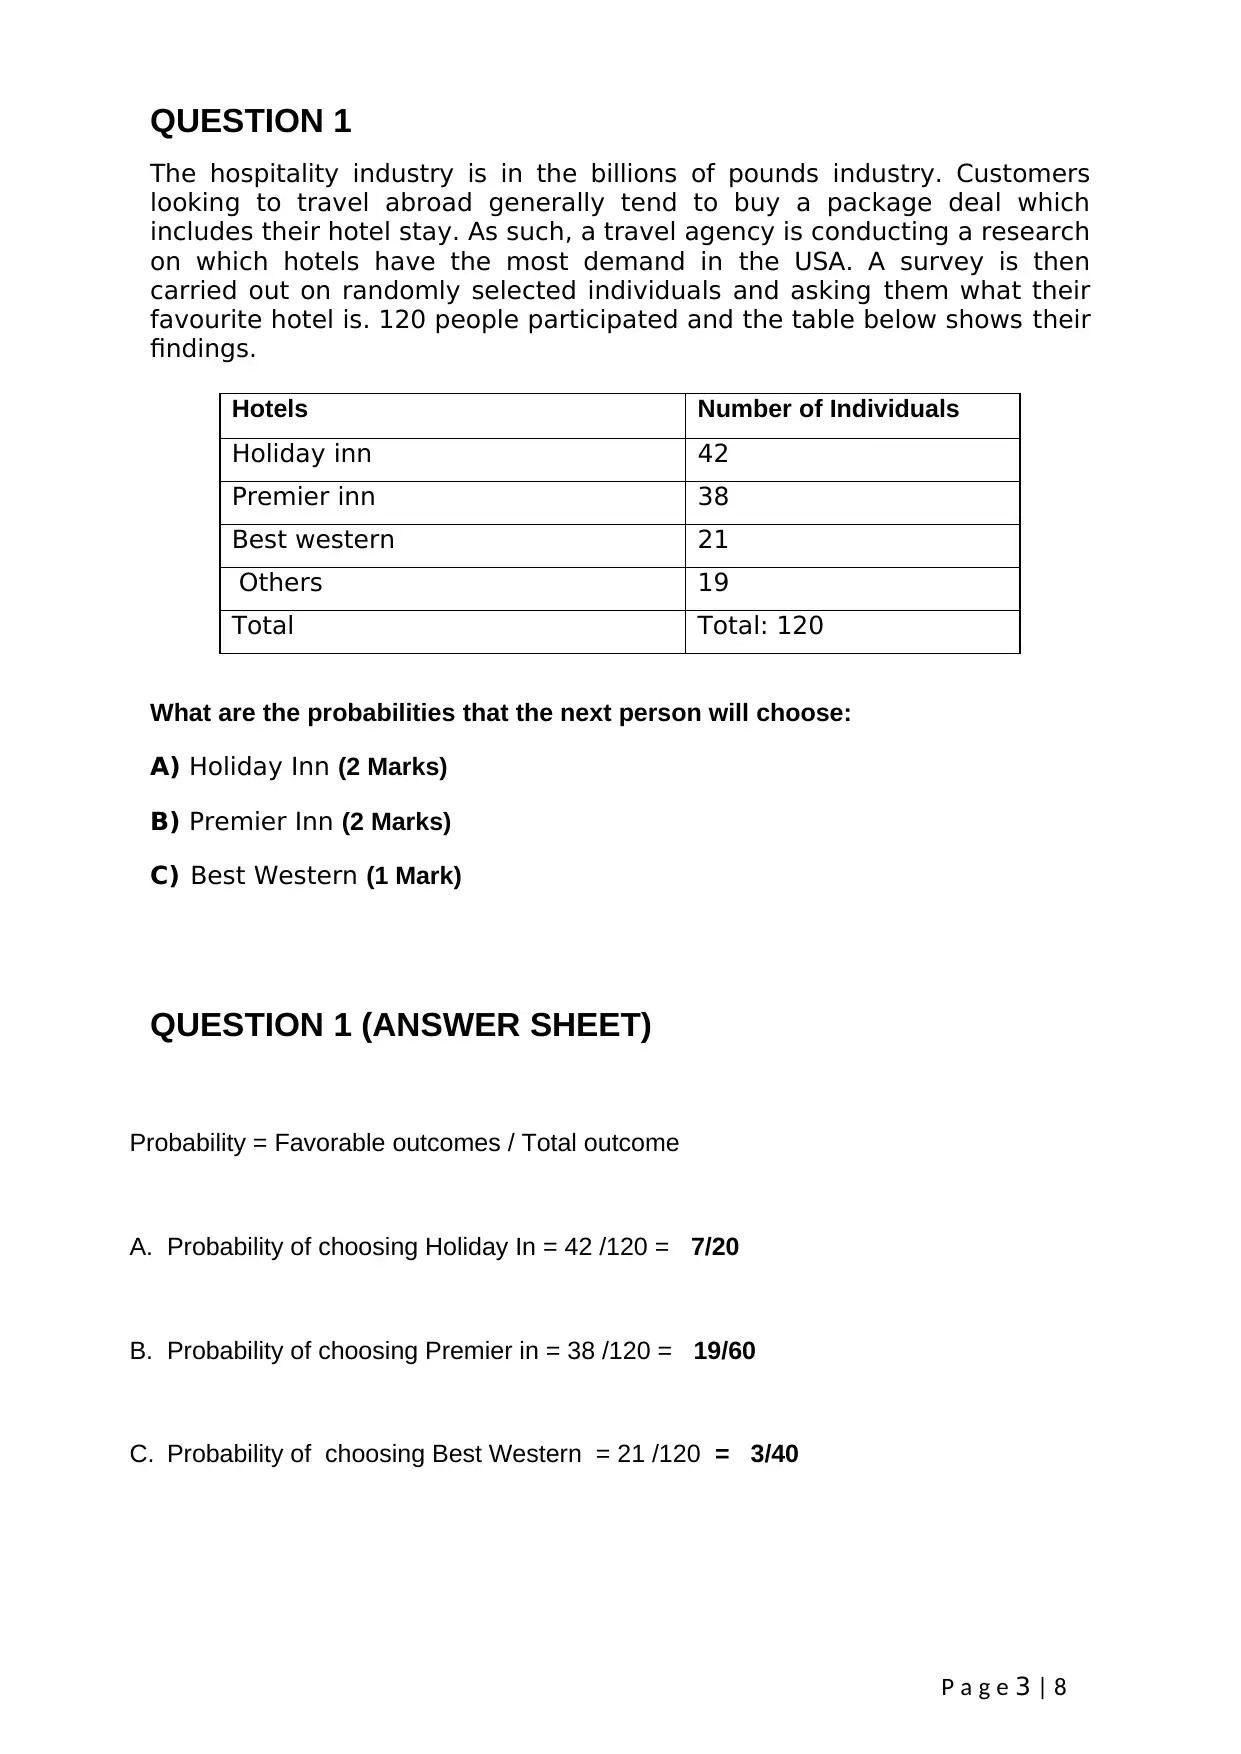
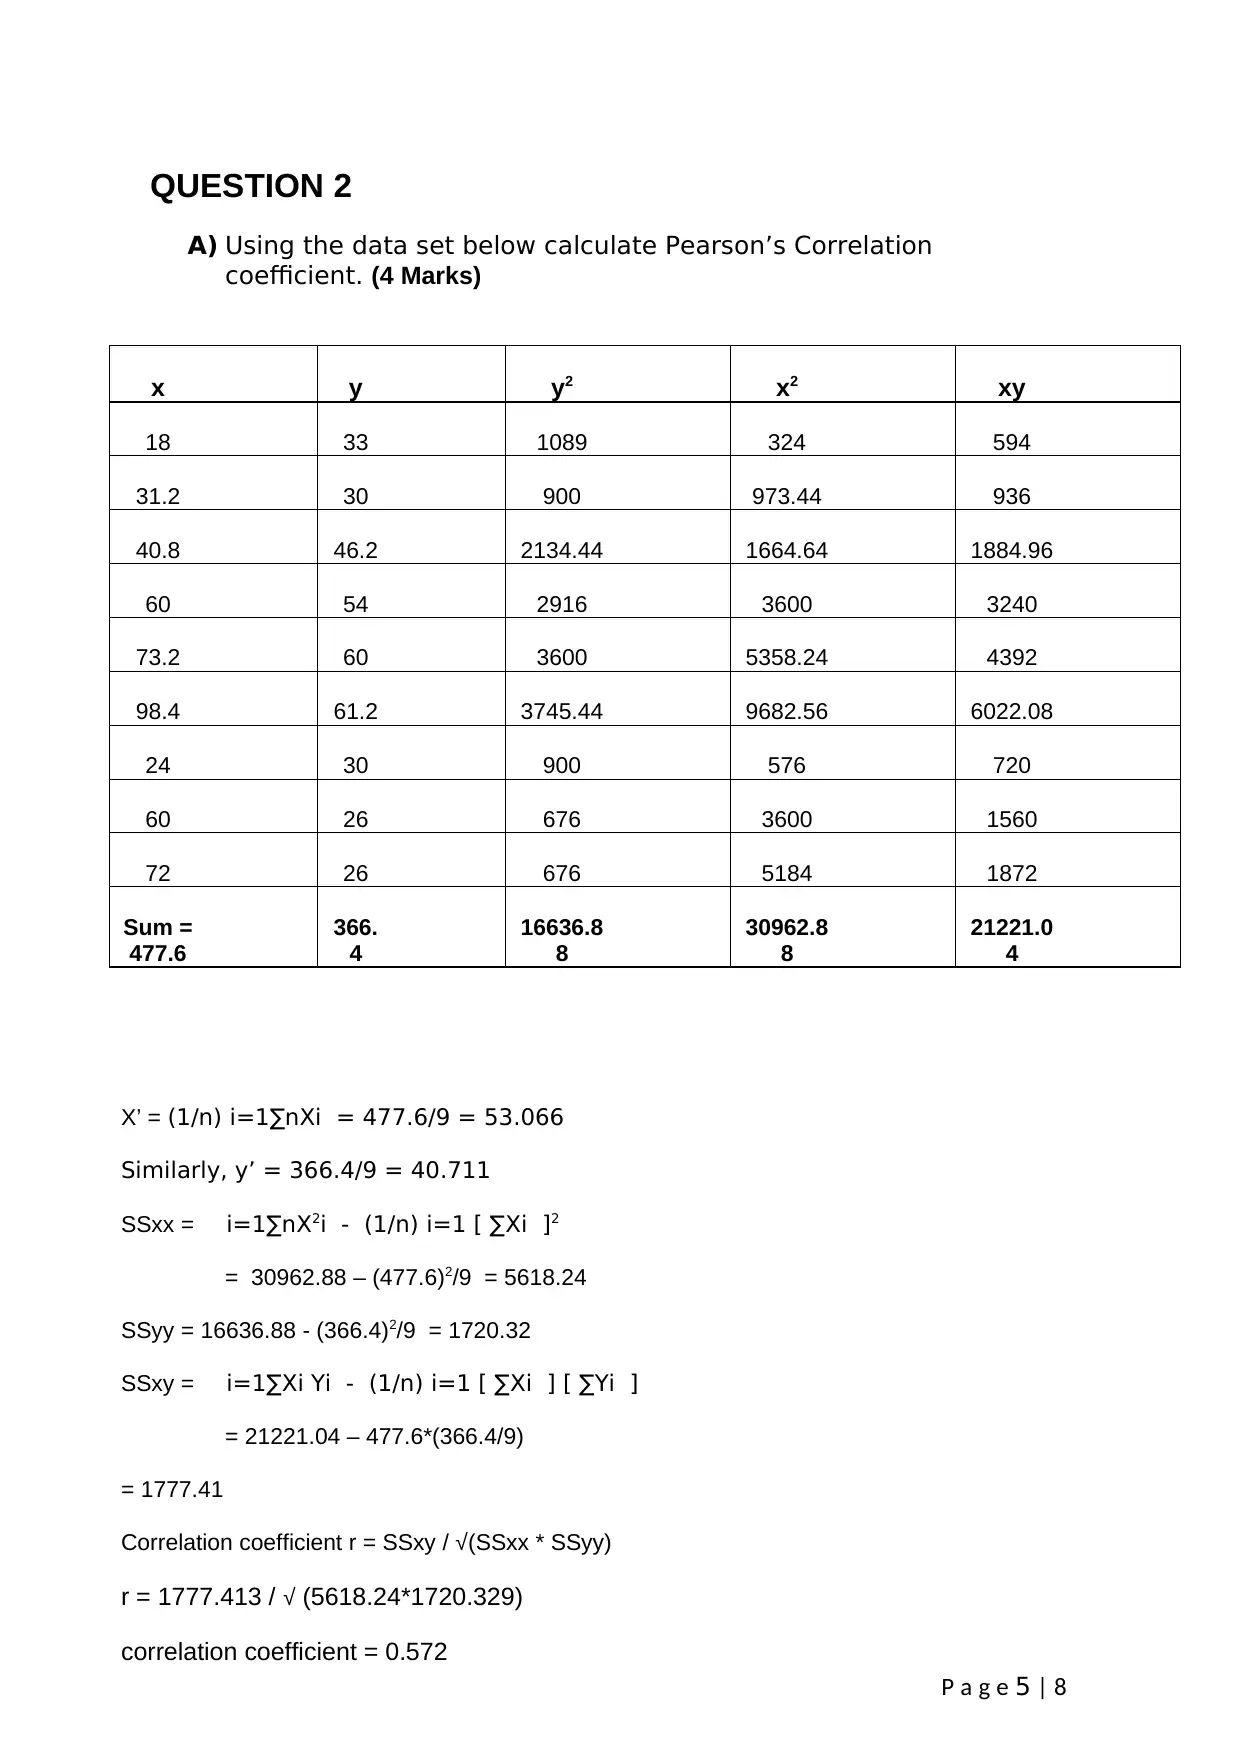
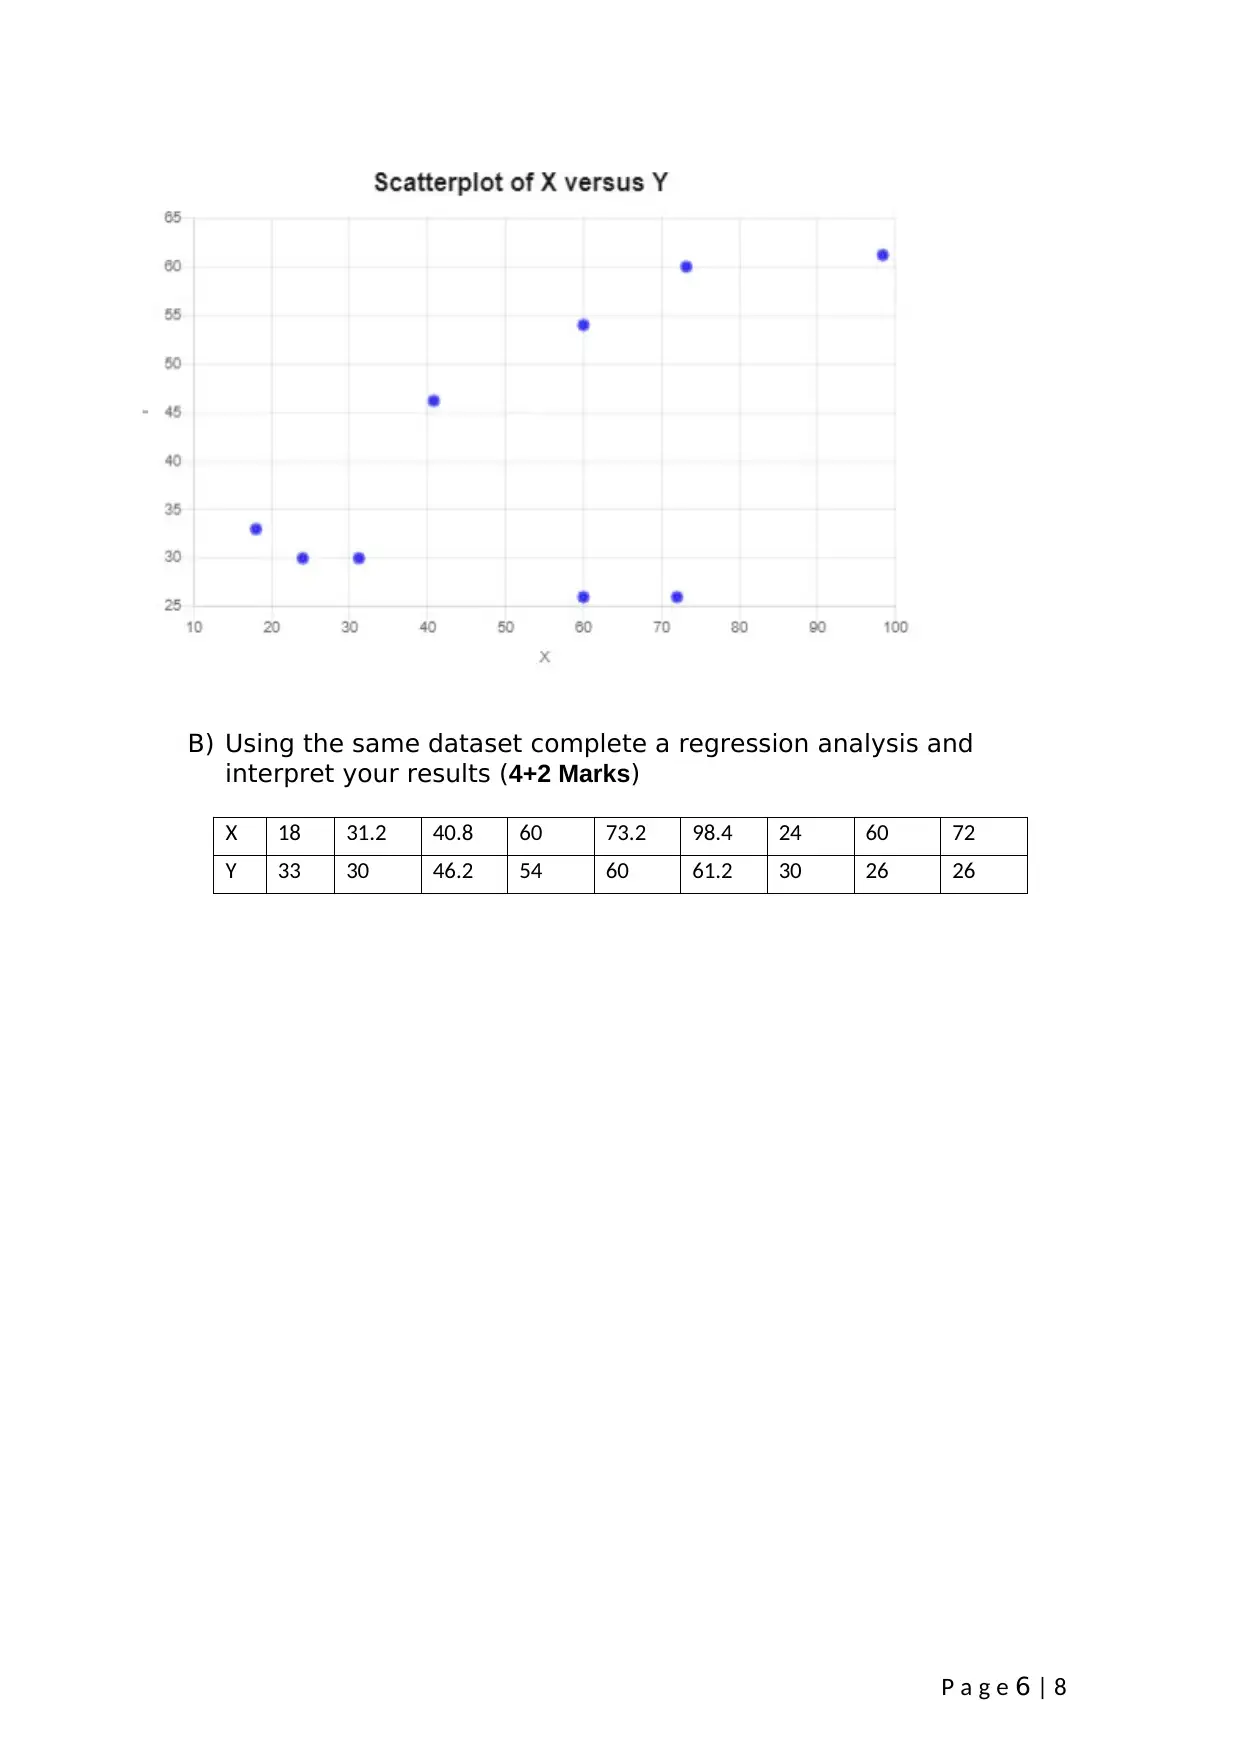
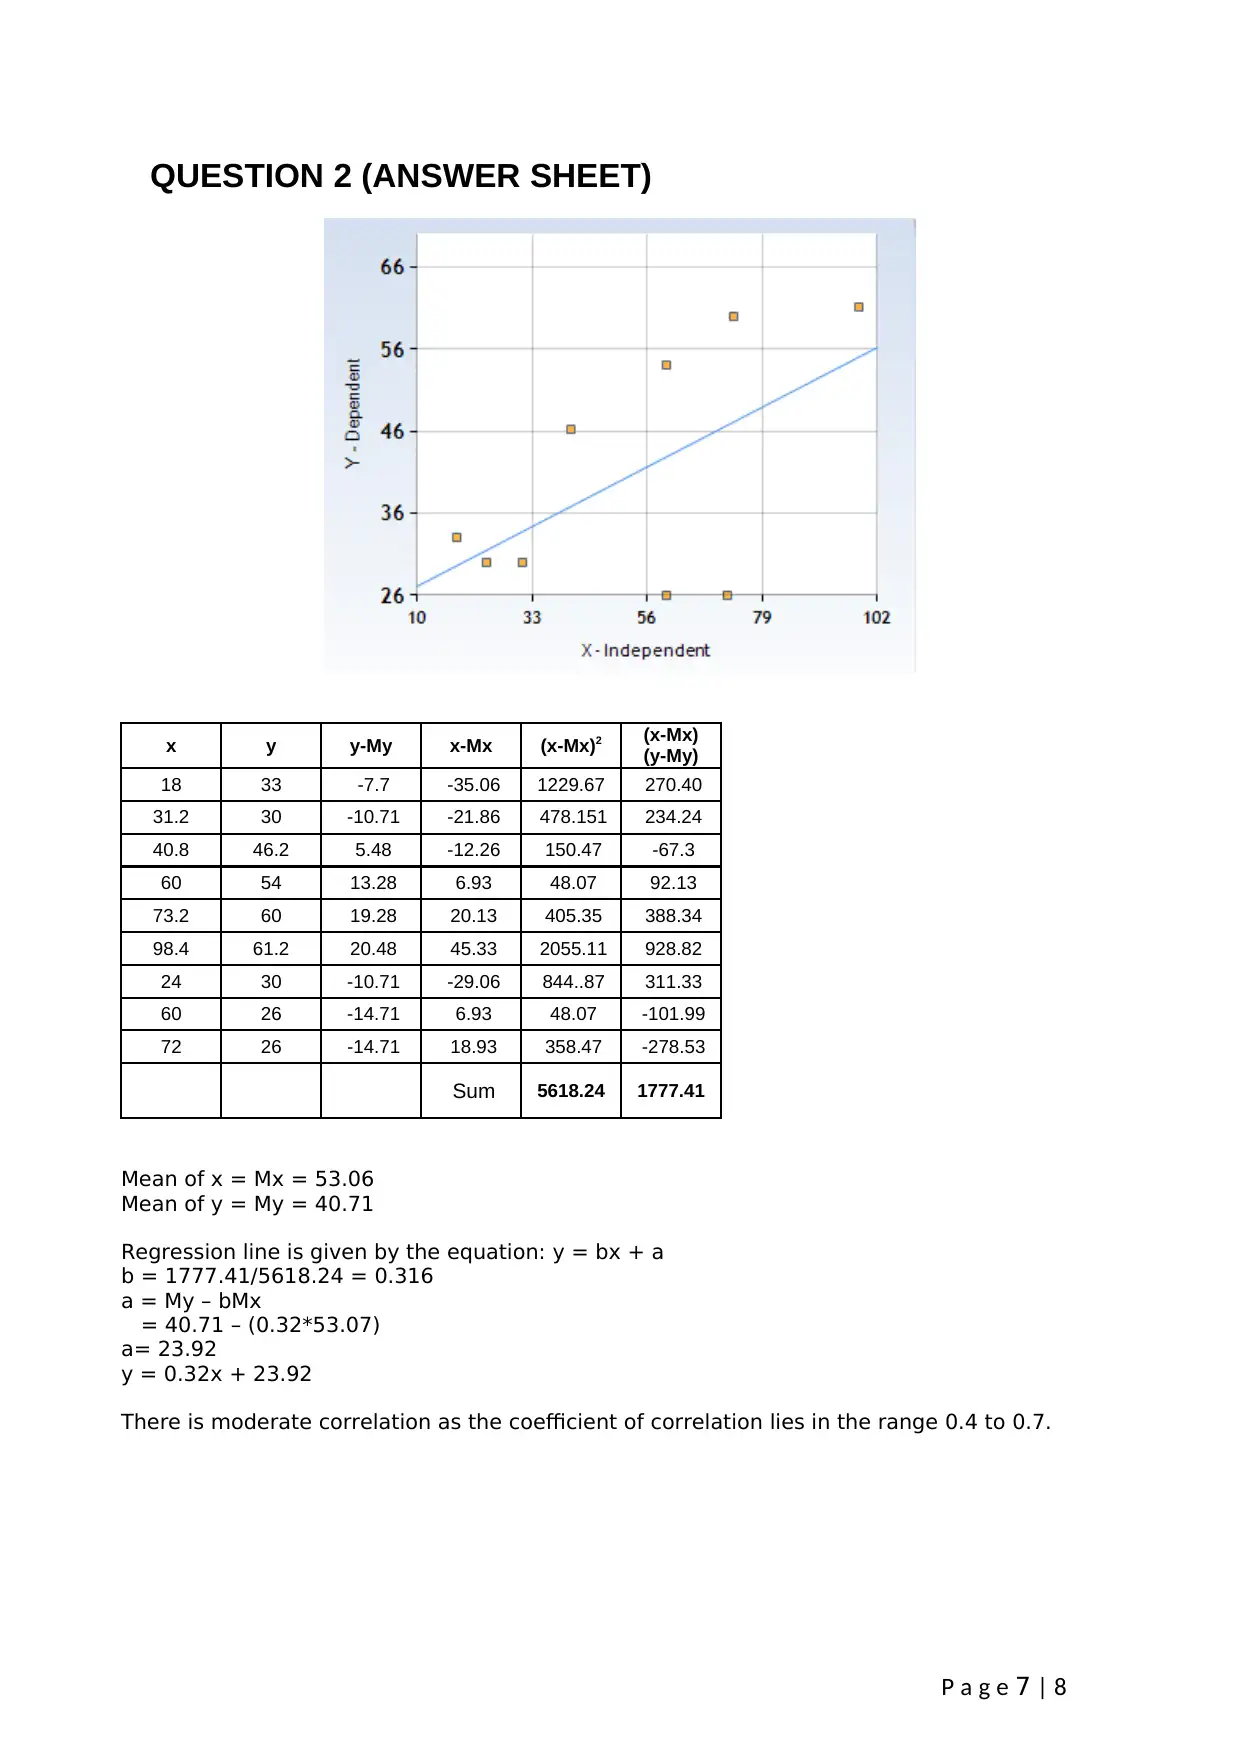
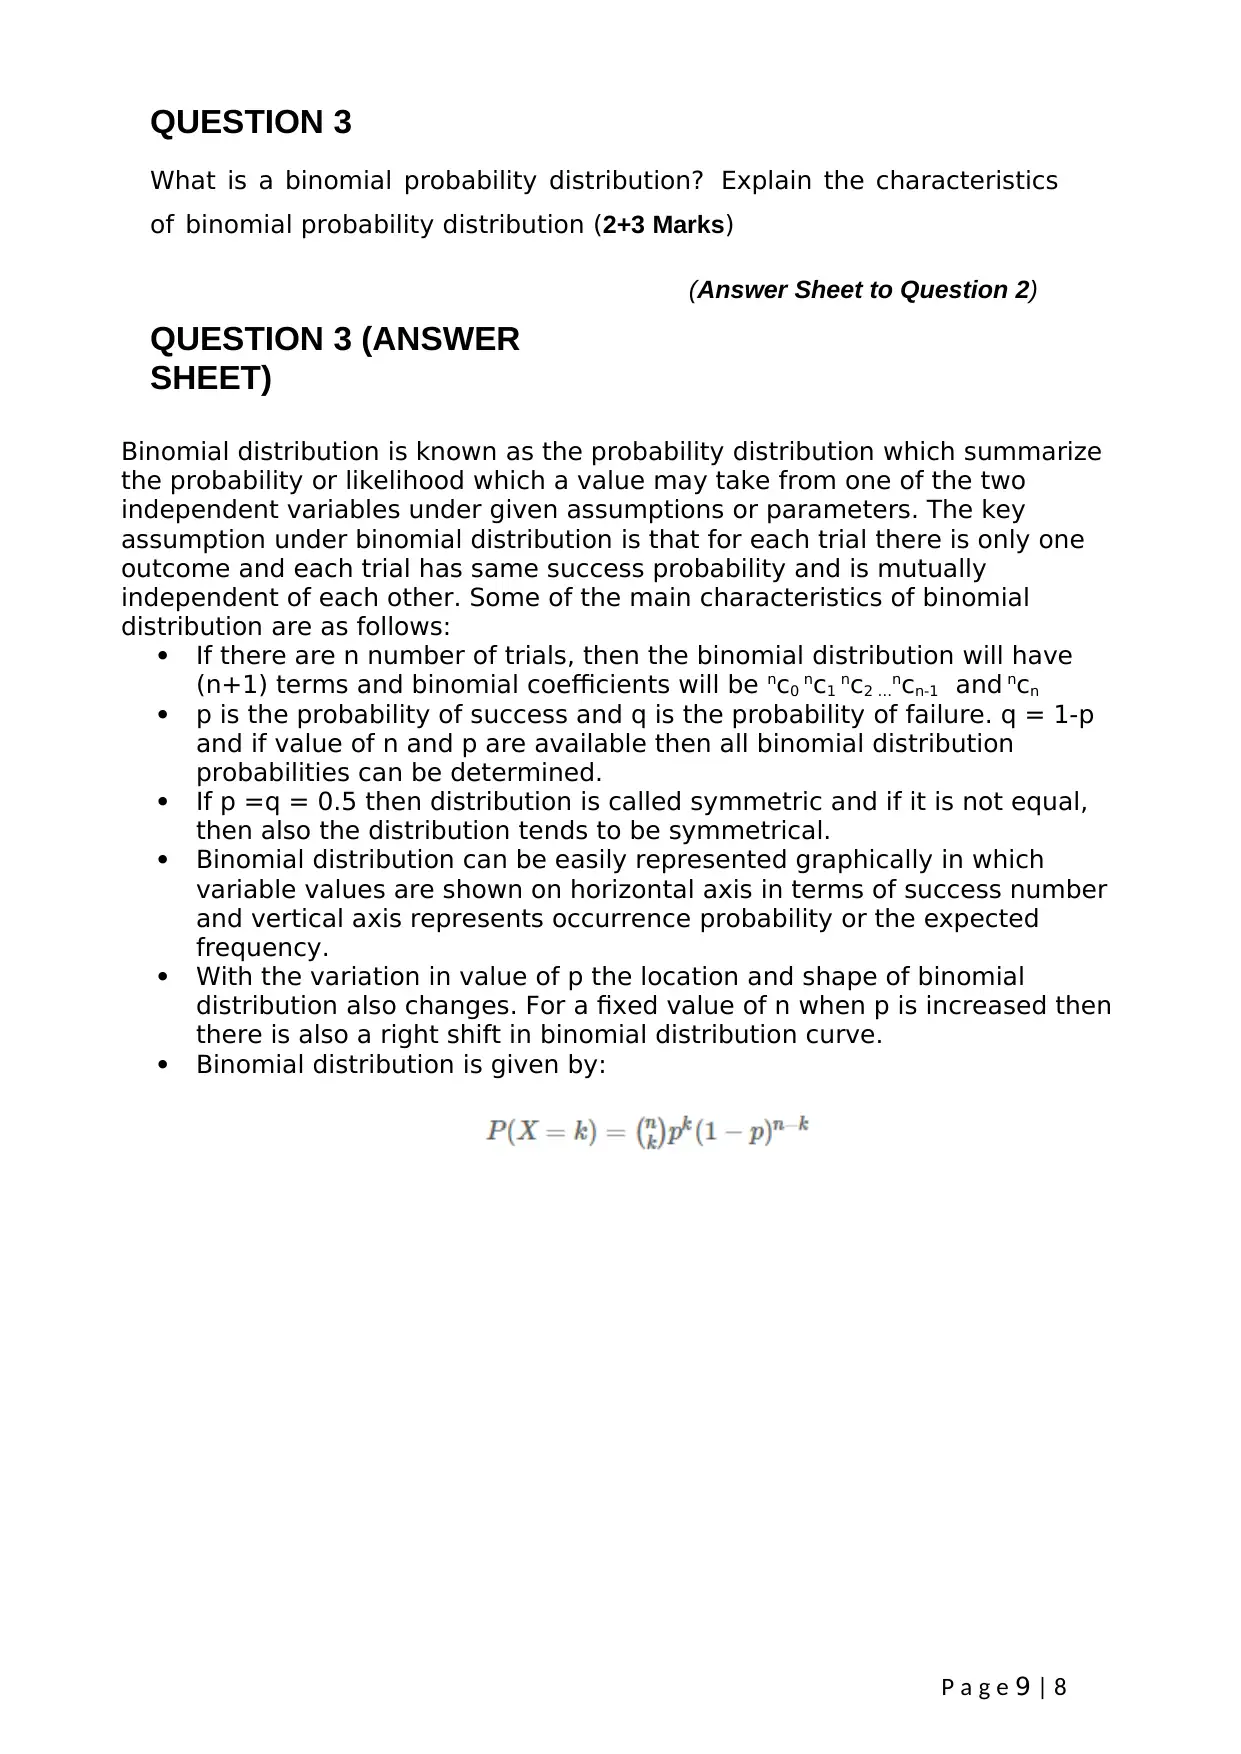
This assignment focuses on key concepts in business statistics, including probability, regression analysis, and binomial distributions. It begins by calculating probabilities related to hotel preferences based on survey data. The assignment then delves into calculating Pearson's correlation coefficient and performing regression analysis on a given dataset, including interpretation of the results. Further, it requires an explanation of the binomial probability distribution and its characteristics. Finally, the assignment defines probability with an example and discusses the concept of the complement of a probability. Desklib provides a platform to access this and many other solved assignments.
Document Page
P a g e 1 | 8
FIRST MARKER
Question Marks
Q1
Q2
Q3
Q4
TOTAL
SECOND MARKER
Question Marks
Q1
Q2
Q3
Q4
TOTAL
International Study Centre
Examination Question and Answer
Book Level: 4
Cohort: FEB 2021
Business Statistics and IT (Statistics)
Instructions to Candidates
This paper contains FOUR questions. Answer ALL questions
Marks: This Paper worth 25 marks. The marks distributions are next to each
question.
TYPE YOUR STUDENT ID NUMBER ON THE TOP-LEFT CORNER OF THIS PAGE.
TYPE YOUR ANSWERS IN THE BOX PROVIDED AFTER EACH QUESTION AND USE THE
HARVARD SYSTEM OF REFERENCING
SOME SECTIONS HAVE BEEN PRE-FORMATTED FOR YOUR CONVENIENCE AND YOU
tabler-icon-diamond-filled.svg

Paraphrase This Document

Need a fresh take? Get an instant paraphrase of this document with our AI Paraphraser
Document Page
P a g e 2 | 8
SHOULD ONLY TYPE WHERE YOU SEE THE PROMPTS
OR Type your answer below...
SHOW YOUR WORKINGS IN ALL CALCULATIONS
YOU SHOULD SUBMIT THIS DOCUMENT, WITH YOUR COMPLETED
ANSWERS ON CANVAS USING THE LINK
Document Page
P a g e 3 | 8
QUESTION 1
The hospitality industry is in the billions of pounds industry. Customers
looking to travel abroad generally tend to buy a package deal which
includes their hotel stay. As such, a travel agency is conducting a research
on which hotels have the most demand in the USA. A survey is then
carried out on randomly selected individuals and asking them what their
favourite hotel is. 120 people participated and the table below shows their
findings.
Hotels Number of Individuals
Holiday inn 42
Premier inn 38
Best western 21
Others 19
Total Total: 120
What are the probabilities that the next person will choose:
A) Holiday Inn (2 Marks)
B) Premier Inn (2 Marks)
C) Best Western (1 Mark)
QUESTION 1 (ANSWER SHEET)
Probability = Favorable outcomes / Total outcome
A. Probability of choosing Holiday In = 42 /120 = 7/20
B. Probability of choosing Premier in = 38 /120 = 19/60
C. Probability of choosing Best Western = 21 /120 = 3/40
Document Page
P a g e 4 | 8
Next page is Question 2
tabler-icon-diamond-filled.svg

Paraphrase This Document

Need a fresh take? Get an instant paraphrase of this document with our AI Paraphraser
Document Page
P a g e 5 | 8
QUESTION 2
A) Using the data set below calculate Pearson’s Correlation
coefficient. (4 Marks)
x y y2 x2 xy
18 33 1089 324 594
31.2 30 900 973.44 936
40.8 46.2 2134.44 1664.64 1884.96
60 54 2916 3600 3240
73.2 60 3600 5358.24 4392
98.4 61.2 3745.44 9682.56 6022.08
24 30 900 576 720
60 26 676 3600 1560
72 26 676 5184 1872
Sum =
477.6
366.
4
16636.8
8
30962.8
8
21221.0
4
X’ = (1/n) i=1∑nXi = 477.6/9 = 53.066
Similarly, y’ = 366.4/9 = 40.711
SSxx = i=1∑nX2i - (1/n) i=1 [ ∑Xi ]2
= 30962.88 – (477.6)2/9 = 5618.24
SSyy = 16636.88 - (366.4)2/9 = 1720.32
SSxy = i=1∑Xi Yi - (1/n) i=1 [ ∑Xi ] [ ∑Yi ]
= 21221.04 – 477.6*(366.4/9)
= 1777.41
Correlation coefficient r = SSxy / (SSxx * SSyy)
r = 1777.413 / (5618.24*1720.329)
correlation coefficient = 0.572
Document Page
P a g e 6 | 8
B) Using the same dataset complete a regression analysis and
interpret your results (4+2 Marks)
X 18 31.2 40.8 60 73.2 98.4 24 60 72
Y 33 30 46.2 54 60 61.2 30 26 26
Document Page
P a g e 7 | 8
QUESTION 2 (ANSWER SHEET)
x y y-My x-Mx (x-Mx)2 (x-Mx)
(y-My)
18 33 -7.7 -35.06 1229.67 270.40
31.2 30 -10.71 -21.86 478.151 234.24
40.8 46.2 5.48 -12.26 150.47 -67.3
60 54 13.28 6.93 48.07 92.13
73.2 60 19.28 20.13 405.35 388.34
98.4 61.2 20.48 45.33 2055.11 928.82
24 30 -10.71 -29.06 844..87 311.33
60 26 -14.71 6.93 48.07 -101.99
72 26 -14.71 18.93 358.47 -278.53
Sum 5618.24 1777.41
Mean of x = Mx = 53.06
Mean of y = My = 40.71
Regression line is given by the equation: y = bx + a
b = 1777.41/5618.24 = 0.316
a = My – bMx
= 40.71 – (0.32*53.07)
a= 23.92
y = 0.32x + 23.92
There is moderate correlation as the coefficient of correlation lies in the range 0.4 to 0.7.
tabler-icon-diamond-filled.svg

Paraphrase This Document

Need a fresh take? Get an instant paraphrase of this document with our AI Paraphraser
Document Page
P a g e 8 | 8
(Next page for Question 3)
Document Page
P a g e 9 | 8
QUESTION 3
What is a binomial probability distribution? Explain the characteristics
of binomial probability distribution (2+3 Marks)
QUESTION 3 (ANSWER
SHEET)
(Answer Sheet to Question 2)
Binomial distribution is known as the probability distribution which summarize
the probability or likelihood which a value may take from one of the two
independent variables under given assumptions or parameters. The key
assumption under binomial distribution is that for each trial there is only one
outcome and each trial has same success probability and is mutually
independent of each other. Some of the main characteristics of binomial
distribution are as follows:
If there are n number of trials, then the binomial distribution will have
(n+1) terms and binomial coefficients will be nc0 nc1 nc2 …ncn-1 and ncn
p is the probability of success and q is the probability of failure. q = 1-p
and if value of n and p are available then all binomial distribution
probabilities can be determined.
If p =q = 0.5 then distribution is called symmetric and if it is not equal,
then also the distribution tends to be symmetrical.
Binomial distribution can be easily represented graphically in which
variable values are shown on horizontal axis in terms of success number
and vertical axis represents occurrence probability or the expected
frequency.
With the variation in value of p the location and shape of binomial
distribution also changes. For a fixed value of n when p is increased then
there is also a right shift in binomial distribution curve.
Binomial distribution is given by:
Document Page
P a g e 10 |
8
(Next page for Question 4)
tabler-icon-diamond-filled.svg

Paraphrase This Document

Need a fresh take? Get an instant paraphrase of this document with our AI Paraphraser
Document Page
P a g e 11 |
8
QUESTION 4
Explain what is a probability using an example? Discuss what is meant by
complement of a probability? (2+3 Marks)
QUESTION 4 (ANSWER SHEET)
(Answer Sheet to Question 4)
Probability is defined as the extent up to which there is possibility for an event
to occur which can be measured by the ratio of favorable conditions to total
number of conditions. It gives prediction that what are the likelihoods for
occurrence of any event. For instance, when tossing a coin either a head or a
tail can come. Thus there are two possible cases. The probability of getting a
head on tossing coin is ½.
The compliment of probability or any event is known as all other outcomes
which are not desired or considered. For instance, if one wants to determine
the probability of getting a head on tossing a coin then the other case
(probability of getting a tail) is known as the compliment of probability. The
sum of all probabilities and its associated compliments is always equals to
zero.
END OF PAPER
Document Page
P a g e 12 |
8
Graph Paper
chevron_up_icon
1 out of 12
circle_padding
hide_on_mobile
zoom_out_icon
[object Object]