XYZ Company Case Study: Financial Analysis, Growth & WACC (2016-2019)
VerifiedAdded on 2023/04/04
|11
|1882
|321
Case Study
AI Summary
This case study analyzes XYZ Company's financial performance and growth strategies from 2016 to 2019. It calculates the sources and uses of funds, operating funds needed (OFN), and working capital (WK) for the period. It also projects these metrics for 2019 and determines the bank loan required to finance the company's anticipated growth. Further, the study calculates the weighted average cost of capital (WACC) for a project in Germany, detailing the rationale behind the inputs used in the WACC calculation, such as the risk-free rate, equity risk premium, and beta. The analysis incorporates various financial statements, growth assumptions, and market data to provide a comprehensive assessment of the company's financial health and investment viability.
Running Head: Financial Management
Financial Management
University Name
Student Name
Financial Management
University Name
Student Name
Paraphrase This Document
Need a fresh take? Get an instant paraphrase of this document with our AI Paraphraser
Financial Management
Contents
Question 1: Calculate the uses and sources of funds for the 2016 - 2018 periods.....................1
Question 2: Calculate the OFN and the WK for 2016-2018 periods and the expected levels
for 2019......................................................................................................................................3
Question 3: Calculate the BANK LOAN that will be required to finance the company growth
during 2019................................................................................................................................5
Question 4: Calculate the WACC of the Project in Germany. Also, explain why you use
particular inputs in the equation.................................................................................................8
Running Head: Financial Management
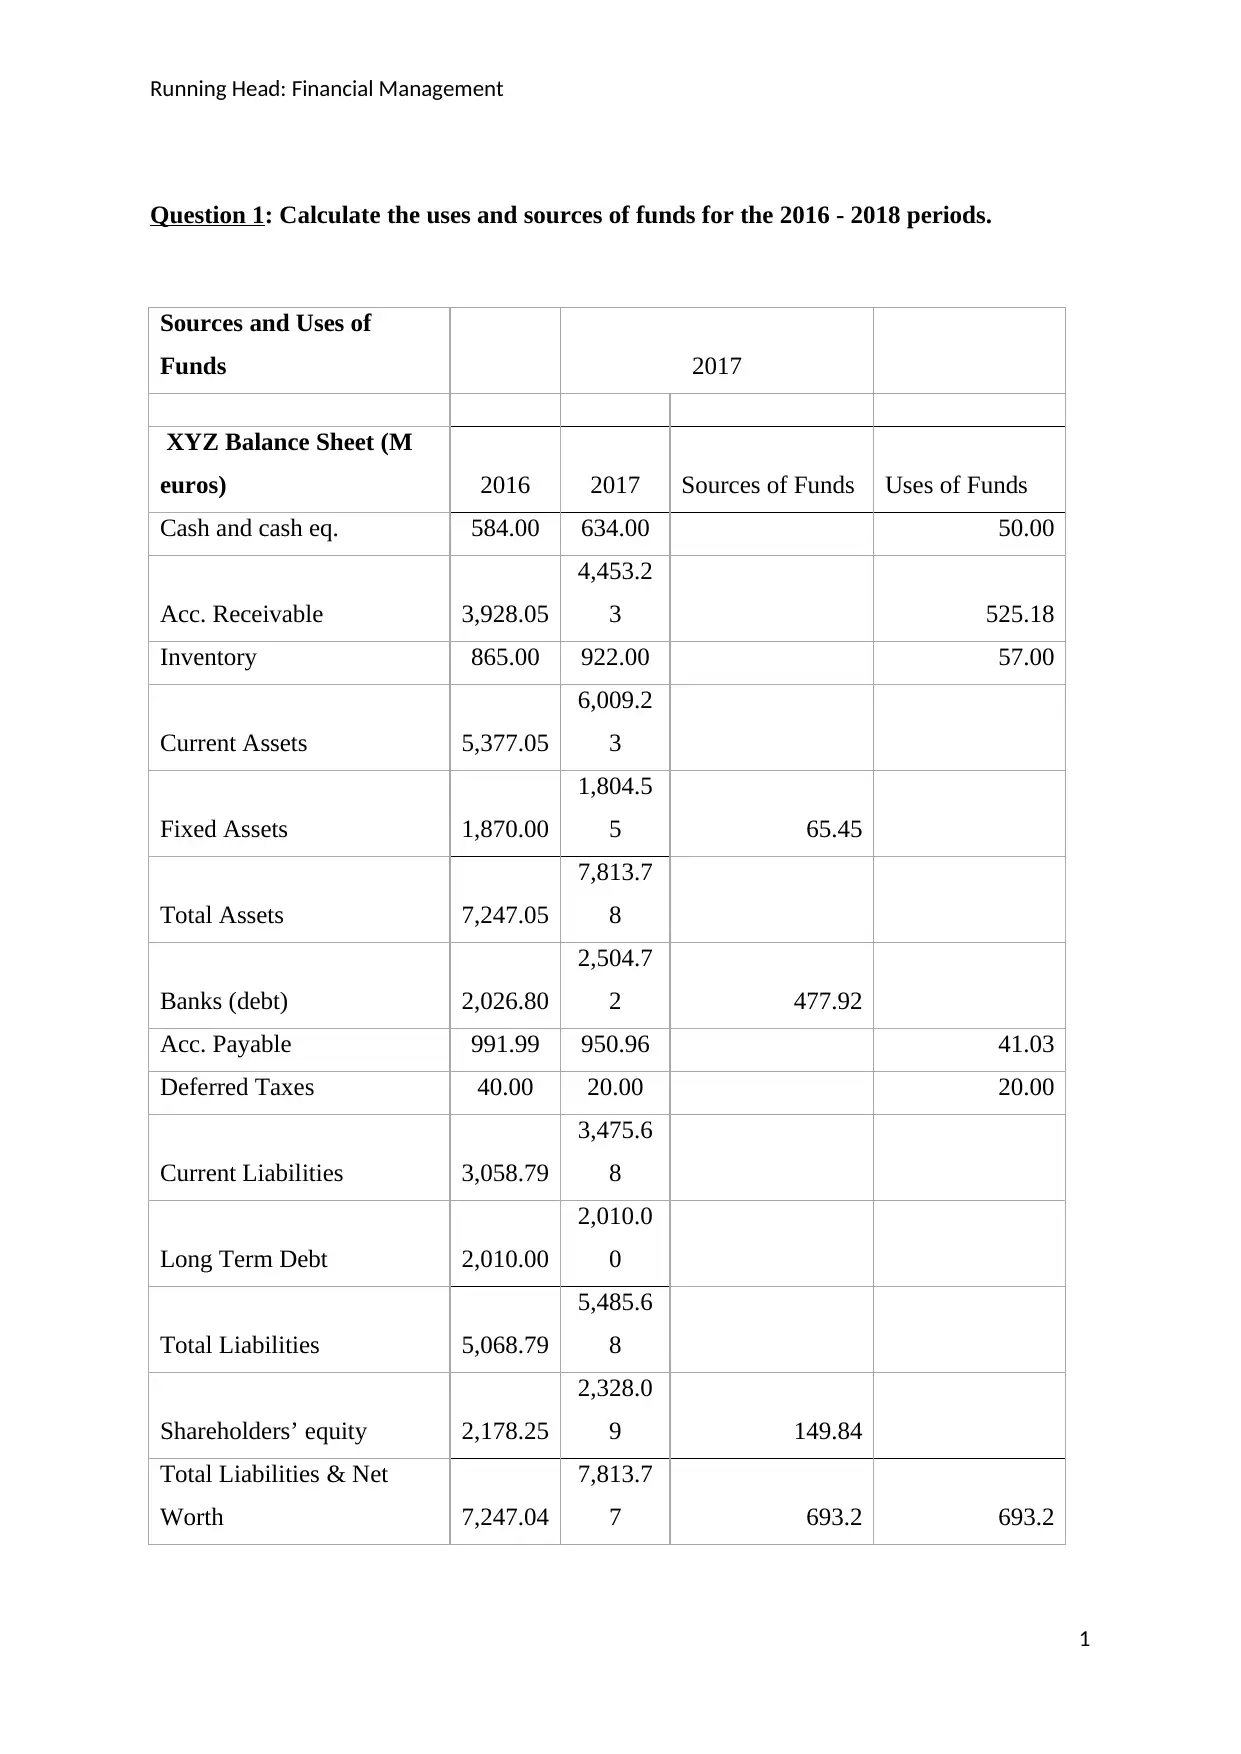
Question 1: Calculate the uses and sources of funds for the 2016 - 2018 periods.
Sources and Uses of
Funds 2017
XYZ Balance Sheet (M
euros) 2016 2017 Sources of Funds Uses of Funds
Cash and cash eq. 584.00 634.00 50.00
Acc. Receivable 3,928.05
4,453.2
3 525.18
Inventory 865.00 922.00 57.00
Current Assets 5,377.05
6,009.2
3
Fixed Assets 1,870.00
1,804.5
5 65.45
Total Assets 7,247.05
7,813.7
8
Banks (debt) 2,026.80
2,504.7
2 477.92
Acc. Payable 991.99 950.96 41.03
Deferred Taxes 40.00 20.00 20.00
Current Liabilities 3,058.79
3,475.6
8
Long Term Debt 2,010.00
2,010.0
0
Total Liabilities 5,068.79
5,485.6
8
Shareholders’ equity 2,178.25
2,328.0
9 149.84
Total Liabilities & Net
Worth 7,247.04
7,813.7
7 693.2 693.2
1
⊘ This is a preview!⊘
Do you want full access?
Subscribe today to unlock all pages.
Trusted by 1+ million students worldwide
Financial Management
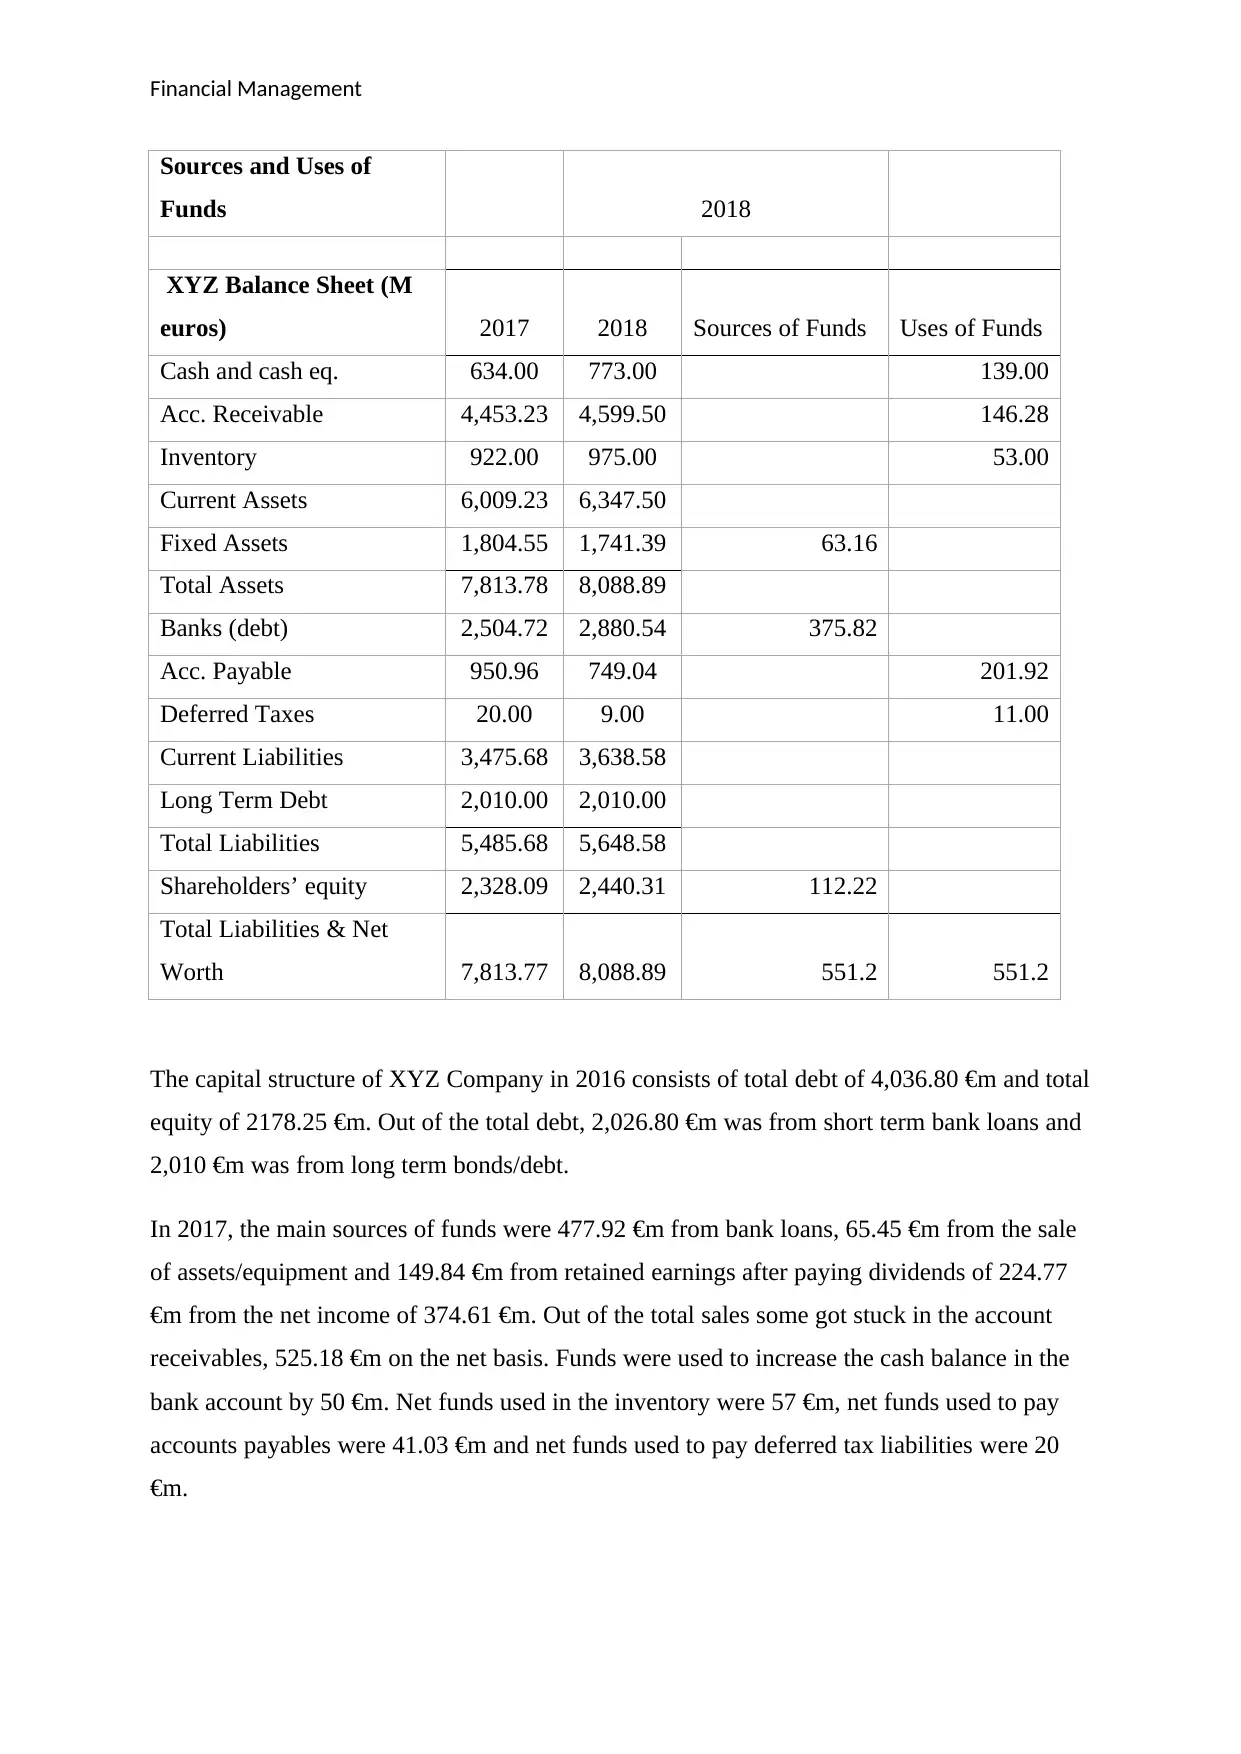
Sources and Uses of
Funds 2018
XYZ Balance Sheet (M
euros) 2017 2018 Sources of Funds Uses of Funds
Cash and cash eq. 634.00 773.00 139.00
Acc. Receivable 4,453.23 4,599.50 146.28
Inventory 922.00 975.00 53.00
Current Assets 6,009.23 6,347.50
Fixed Assets 1,804.55 1,741.39 63.16
Total Assets 7,813.78 8,088.89
Banks (debt) 2,504.72 2,880.54 375.82
Acc. Payable 950.96 749.04 201.92
Deferred Taxes 20.00 9.00 11.00
Current Liabilities 3,475.68 3,638.58
Long Term Debt 2,010.00 2,010.00
Total Liabilities 5,485.68 5,648.58
Shareholders’ equity 2,328.09 2,440.31 112.22
Total Liabilities & Net
Worth 7,813.77 8,088.89 551.2 551.2
The capital structure of XYZ Company in 2016 consists of total debt of 4,036.80 €m and total
equity of 2178.25 €m. Out of the total debt, 2,026.80 €m was from short term bank loans and
2,010 €m was from long term bonds/debt.
In 2017, the main sources of funds were 477.92 €m from bank loans, 65.45 €m from the sale
of assets/equipment and 149.84 €m from retained earnings after paying dividends of 224.77
€m from the net income of 374.61 €m. Out of the total sales some got stuck in the account
receivables, 525.18 €m on the net basis. Funds were used to increase the cash balance in the
bank account by 50 €m. Net funds used in the inventory were 57 €m, net funds used to pay
accounts payables were 41.03 €m and net funds used to pay deferred tax liabilities were 20
€m.
Paraphrase This Document
Need a fresh take? Get an instant paraphrase of this document with our AI Paraphraser
Financial Management
In 2018, the main sources of funds were 375.82 €m from bank loans, 63.16 €m from the sale
of assets/equipment and 112.22 €m from retained earnings after paying dividends of $168.32
€m from the net income of $280.54 €m. Out of the total sales some got stuck in the account
receivables, 146.28 €m on the net basis. Funds were used to increase the cash balance in the
bank account by 139 €m. Net funds used in the inventory were 53 €m, net funds used to pay
accounts payables were 201.92 €m and net funds used to pay deferred tax liabilities were 11
€m.
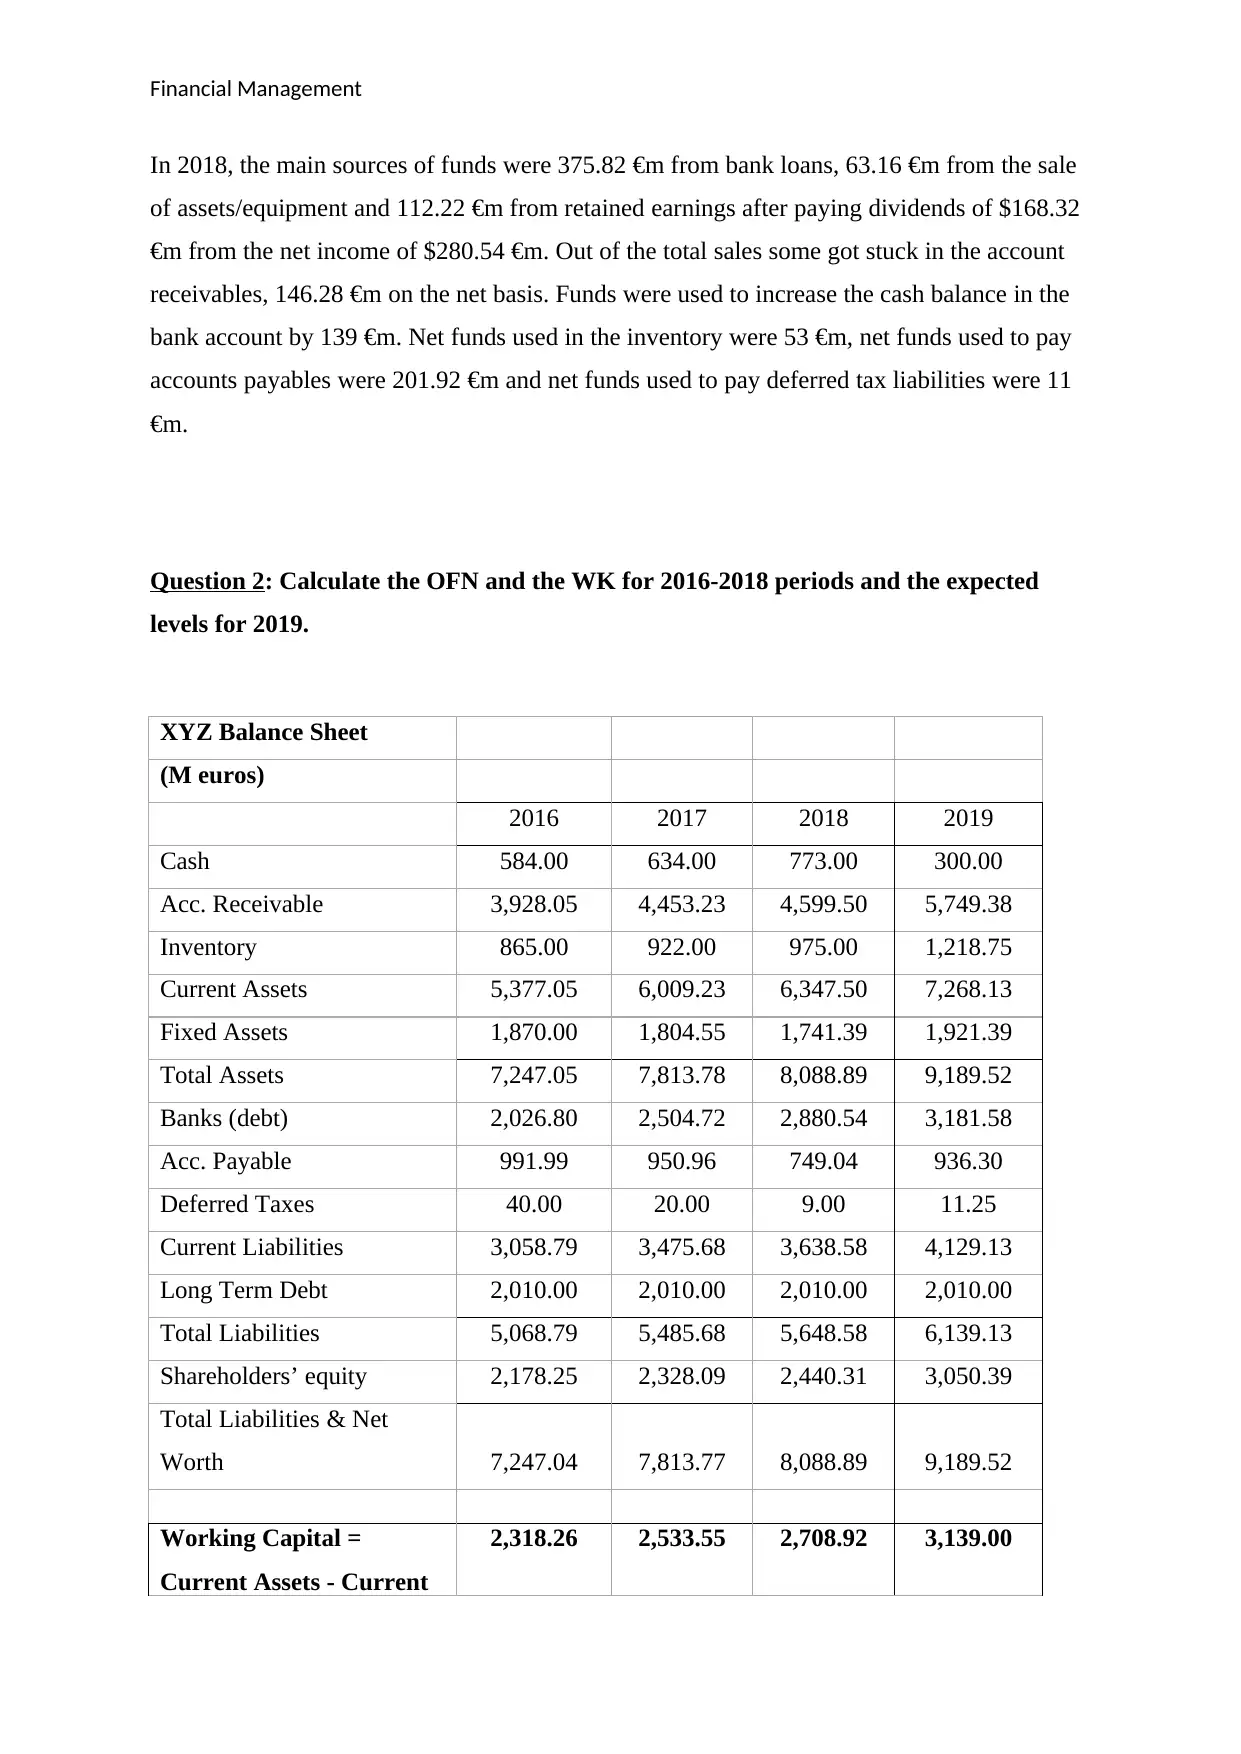
Question 2: Calculate the OFN and the WK for 2016-2018 periods and the expected
levels for 2019.
XYZ Balance Sheet
(M euros)
2016 2017 2018 2019
Cash 584.00 634.00 773.00 300.00
Acc. Receivable 3,928.05 4,453.23 4,599.50 5,749.38
Inventory 865.00 922.00 975.00 1,218.75
Current Assets 5,377.05 6,009.23 6,347.50 7,268.13
Fixed Assets 1,870.00 1,804.55 1,741.39 1,921.39
Total Assets 7,247.05 7,813.78 8,088.89 9,189.52
Banks (debt) 2,026.80 2,504.72 2,880.54 3,181.58
Acc. Payable 991.99 950.96 749.04 936.30
Deferred Taxes 40.00 20.00 9.00 11.25
Current Liabilities 3,058.79 3,475.68 3,638.58 4,129.13
Long Term Debt 2,010.00 2,010.00 2,010.00 2,010.00
Total Liabilities 5,068.79 5,485.68 5,648.58 6,139.13
Shareholders’ equity 2,178.25 2,328.09 2,440.31 3,050.39
Total Liabilities & Net
Worth 7,247.04 7,813.77 8,088.89 9,189.52
Working Capital =
Current Assets - Current
2,318.26 2,533.55 2,708.92 3,139.00
In 2018, the main sources of funds were 375.82 €m from bank loans, 63.16 €m from the sale
of assets/equipment and 112.22 €m from retained earnings after paying dividends of $168.32
€m from the net income of $280.54 €m. Out of the total sales some got stuck in the account
receivables, 146.28 €m on the net basis. Funds were used to increase the cash balance in the
bank account by 139 €m. Net funds used in the inventory were 53 €m, net funds used to pay
accounts payables were 201.92 €m and net funds used to pay deferred tax liabilities were 11
€m.
Question 2: Calculate the OFN and the WK for 2016-2018 periods and the expected
levels for 2019.
XYZ Balance Sheet
(M euros)
2016 2017 2018 2019
Cash 584.00 634.00 773.00 300.00
Acc. Receivable 3,928.05 4,453.23 4,599.50 5,749.38
Inventory 865.00 922.00 975.00 1,218.75
Current Assets 5,377.05 6,009.23 6,347.50 7,268.13
Fixed Assets 1,870.00 1,804.55 1,741.39 1,921.39
Total Assets 7,247.05 7,813.78 8,088.89 9,189.52
Banks (debt) 2,026.80 2,504.72 2,880.54 3,181.58
Acc. Payable 991.99 950.96 749.04 936.30
Deferred Taxes 40.00 20.00 9.00 11.25
Current Liabilities 3,058.79 3,475.68 3,638.58 4,129.13
Long Term Debt 2,010.00 2,010.00 2,010.00 2,010.00
Total Liabilities 5,068.79 5,485.68 5,648.58 6,139.13
Shareholders’ equity 2,178.25 2,328.09 2,440.31 3,050.39
Total Liabilities & Net
Worth 7,247.04 7,813.77 8,088.89 9,189.52
Working Capital =
Current Assets - Current
2,318.26 2,533.55 2,708.92 3,139.00
Financial Management
Liabilities
OFN = Inventory + Acc.
Receivable - Acc. Payables
- Deferred Taxes 3,761.06 4,404.26 4,816.46 6,020.57
Working Capital = (Cash -
Short term financial
liabilities) + OFN 2,318.26 2,533.55 2,708.92 3,139.00
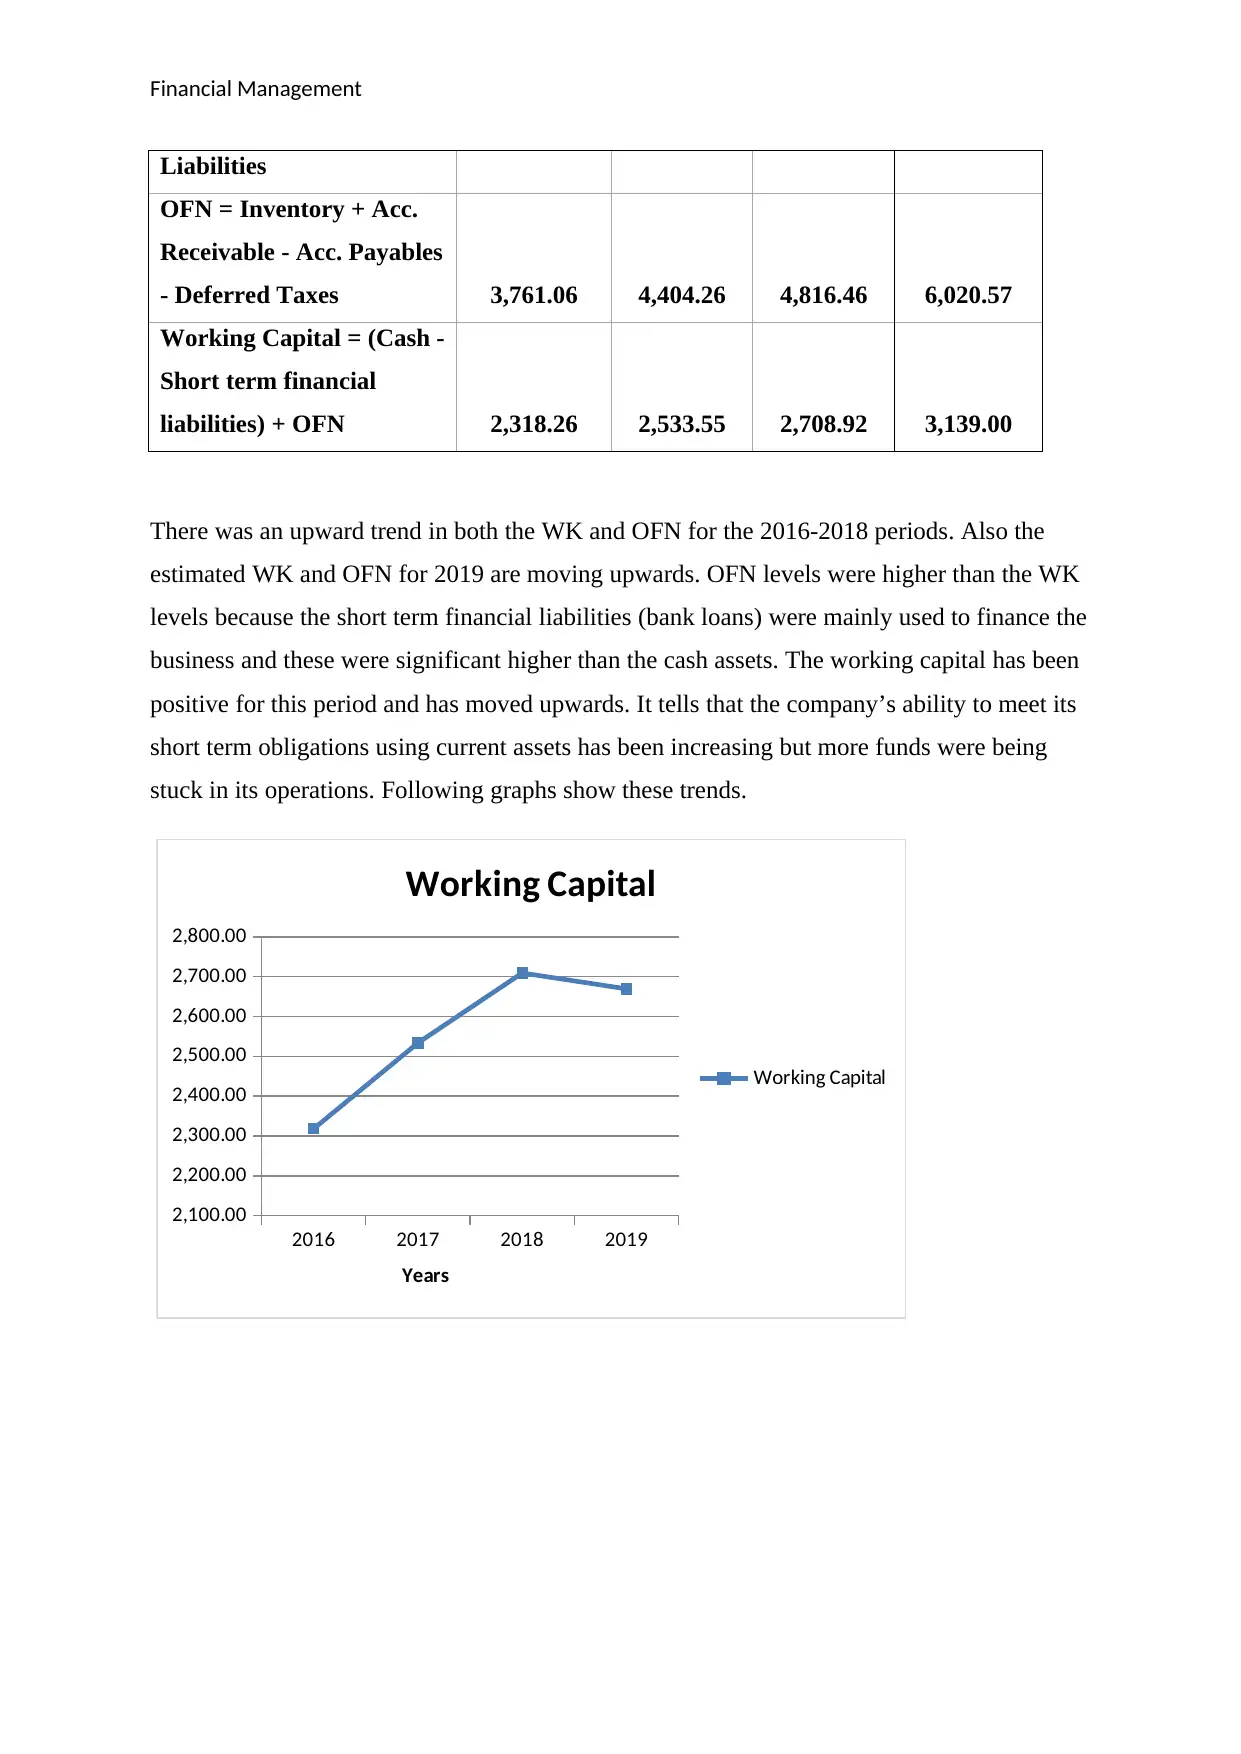
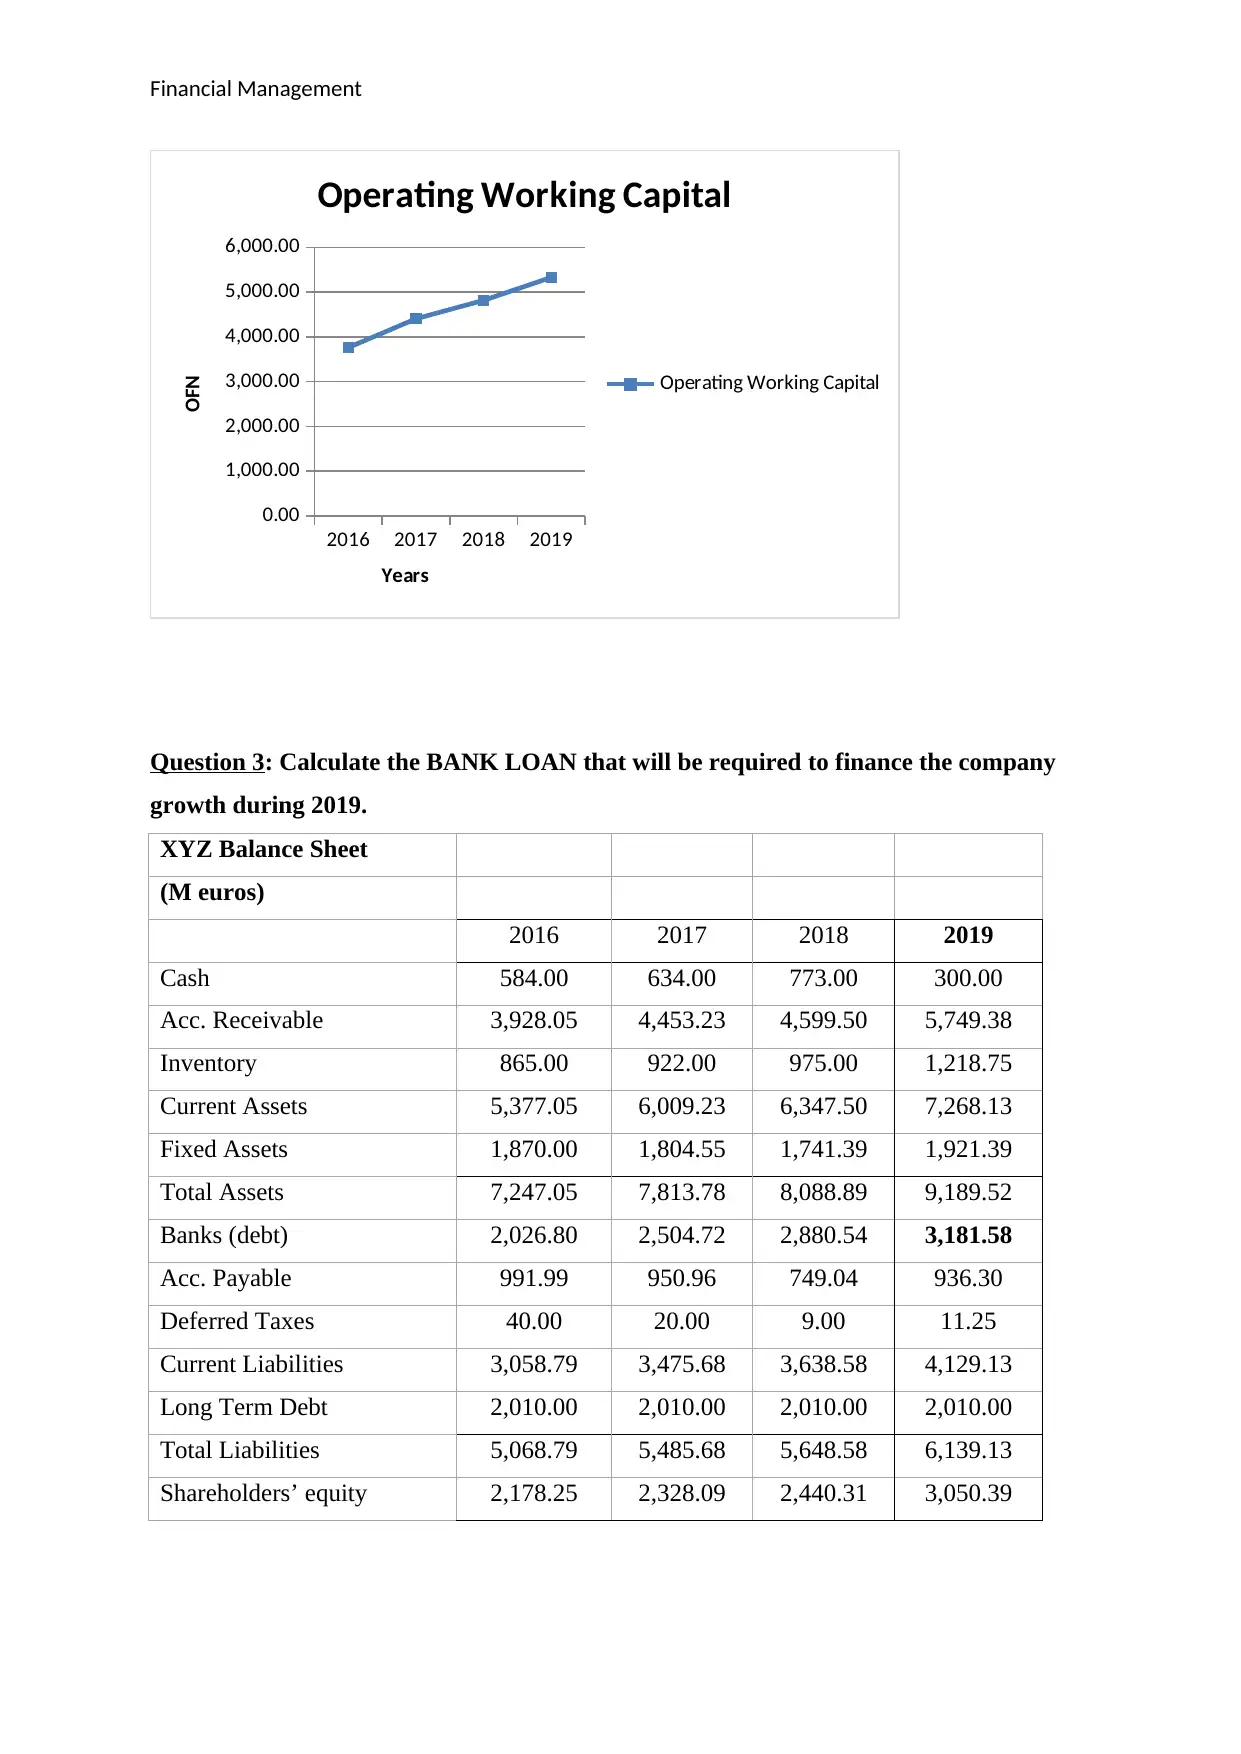
There was an upward trend in both the WK and OFN for the 2016-2018 periods. Also the
estimated WK and OFN for 2019 are moving upwards. OFN levels were higher than the WK
levels because the short term financial liabilities (bank loans) were mainly used to finance the
business and these were significant higher than the cash assets. The working capital has been
positive for this period and has moved upwards. It tells that the company’s ability to meet its
short term obligations using current assets has been increasing but more funds were being
stuck in its operations. Following graphs show these trends.
2016 2017 2018 2019
2,100.00
2,200.00
2,300.00
2,400.00
2,500.00
2,600.00
2,700.00
2,800.00
Working Capital
Working Capital
Years
Liabilities
OFN = Inventory + Acc.
Receivable - Acc. Payables
- Deferred Taxes 3,761.06 4,404.26 4,816.46 6,020.57
Working Capital = (Cash -
Short term financial
liabilities) + OFN 2,318.26 2,533.55 2,708.92 3,139.00
There was an upward trend in both the WK and OFN for the 2016-2018 periods. Also the
estimated WK and OFN for 2019 are moving upwards. OFN levels were higher than the WK
levels because the short term financial liabilities (bank loans) were mainly used to finance the
business and these were significant higher than the cash assets. The working capital has been
positive for this period and has moved upwards. It tells that the company’s ability to meet its
short term obligations using current assets has been increasing but more funds were being
stuck in its operations. Following graphs show these trends.
2016 2017 2018 2019
2,100.00
2,200.00
2,300.00
2,400.00
2,500.00
2,600.00
2,700.00
2,800.00
Working Capital
Working Capital
Years
⊘ This is a preview!⊘
Do you want full access?
Subscribe today to unlock all pages.
Trusted by 1+ million students worldwide
Financial Management
2016 2017 2018 2019
0.00
1,000.00
2,000.00
3,000.00
4,000.00
5,000.00
6,000.00
Operating Working Capital
Operating Working Capital
Years
OFN
Question 3: Calculate the BANK LOAN that will be required to finance the company
growth during 2019.
XYZ Balance Sheet
(M euros)
2016 2017 2018 2019
Cash 584.00 634.00 773.00 300.00
Acc. Receivable 3,928.05 4,453.23 4,599.50 5,749.38
Inventory 865.00 922.00 975.00 1,218.75
Current Assets 5,377.05 6,009.23 6,347.50 7,268.13
Fixed Assets 1,870.00 1,804.55 1,741.39 1,921.39
Total Assets 7,247.05 7,813.78 8,088.89 9,189.52
Banks (debt) 2,026.80 2,504.72 2,880.54 3,181.58
Acc. Payable 991.99 950.96 749.04 936.30
Deferred Taxes 40.00 20.00 9.00 11.25
Current Liabilities 3,058.79 3,475.68 3,638.58 4,129.13
Long Term Debt 2,010.00 2,010.00 2,010.00 2,010.00
Total Liabilities 5,068.79 5,485.68 5,648.58 6,139.13
Shareholders’ equity 2,178.25 2,328.09 2,440.31 3,050.39
2016 2017 2018 2019
0.00
1,000.00
2,000.00
3,000.00
4,000.00
5,000.00
6,000.00
Operating Working Capital
Operating Working Capital
Years
OFN
Question 3: Calculate the BANK LOAN that will be required to finance the company
growth during 2019.
XYZ Balance Sheet
(M euros)
2016 2017 2018 2019
Cash 584.00 634.00 773.00 300.00
Acc. Receivable 3,928.05 4,453.23 4,599.50 5,749.38
Inventory 865.00 922.00 975.00 1,218.75
Current Assets 5,377.05 6,009.23 6,347.50 7,268.13
Fixed Assets 1,870.00 1,804.55 1,741.39 1,921.39
Total Assets 7,247.05 7,813.78 8,088.89 9,189.52
Banks (debt) 2,026.80 2,504.72 2,880.54 3,181.58
Acc. Payable 991.99 950.96 749.04 936.30
Deferred Taxes 40.00 20.00 9.00 11.25
Current Liabilities 3,058.79 3,475.68 3,638.58 4,129.13
Long Term Debt 2,010.00 2,010.00 2,010.00 2,010.00
Total Liabilities 5,068.79 5,485.68 5,648.58 6,139.13
Shareholders’ equity 2,178.25 2,328.09 2,440.31 3,050.39
Paraphrase This Document
Need a fresh take? Get an instant paraphrase of this document with our AI Paraphraser
Financial Management
Total Liabilities & Net
Worth 7,247.04 7,813.77 8,088.89 9,189.52
XYZ P&L Statement
(million euros)
2016 2017 2018 2019
Sales 6,545.00 6,728.00 7,001.00 8,751.25
Initial Inventory 850.00 865.00 922.00 975.00
Purchases 3,337.95 3,431.28 3,570.51 4,640.64
Final Inventory 865.00 922.00 975.00 1,218.75
COGS 3,322.95 3,374.28 3,517.51 4,396.89
Gross Margin 3,222.05 3,353.72 3,483.49 4,354.36
Operating Expenses 2,305.75 2,550.00 2,801.00 3,501.25
EBIT 916.30 803.72 682.49 853.11
Interest Paid 251.84 268.57 281.72 292.26
PBT 664.46 535.15 400.77 560.86
Tax 199.34 160.55 120.23 168.26
Net Income 465.12 374.61 280.54 392.60
Dividends Paid 279.07 224.77 168.32 235.56
Retained Earnings 186.05 149.84 112.22 157.04
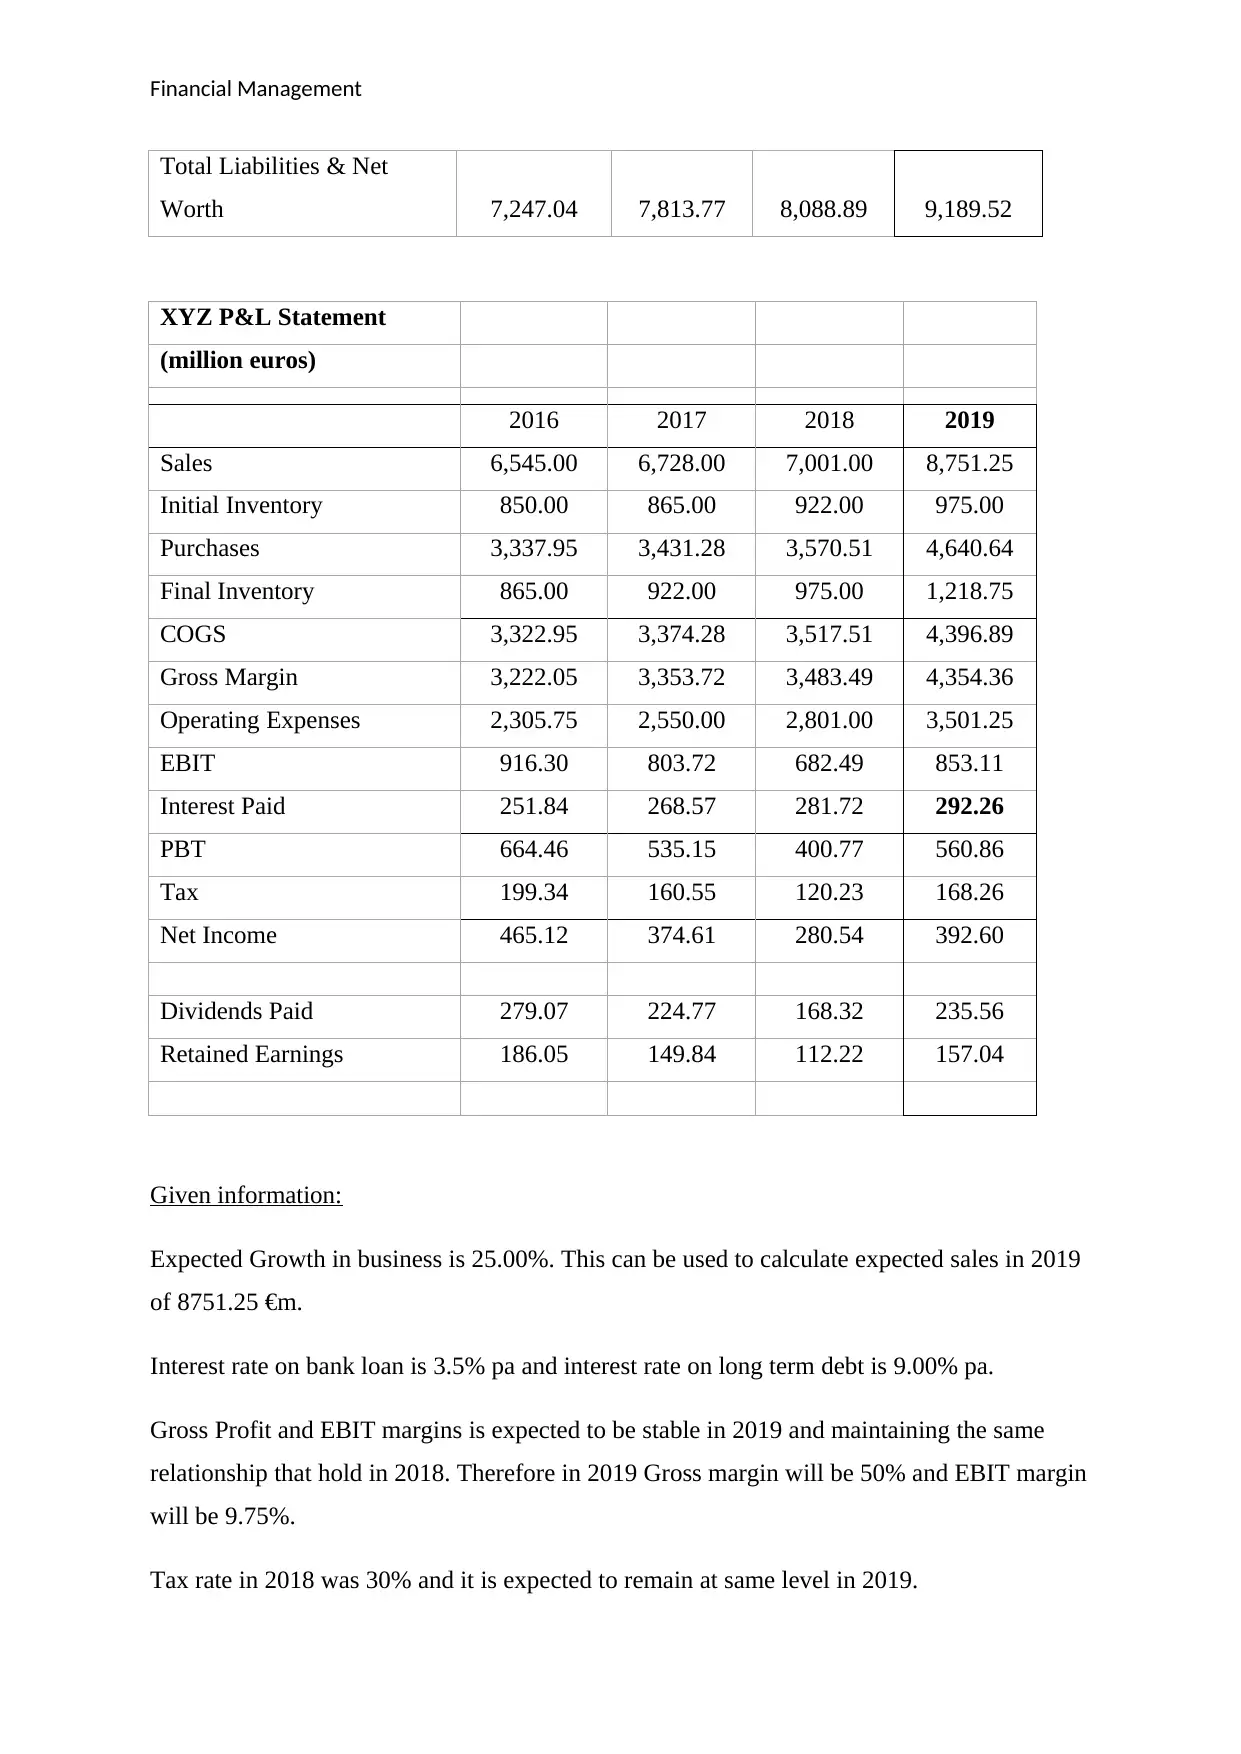
Given information:
Expected Growth in business is 25.00%. This can be used to calculate expected sales in 2019
of 8751.25 €m.
Interest rate on bank loan is 3.5% pa and interest rate on long term debt is 9.00% pa.
Gross Profit and EBIT margins is expected to be stable in 2019 and maintaining the same
relationship that hold in 2018. Therefore in 2019 Gross margin will be 50% and EBIT margin
will be 9.75%.
Tax rate in 2018 was 30% and it is expected to remain at same level in 2019.
Total Liabilities & Net
Worth 7,247.04 7,813.77 8,088.89 9,189.52
XYZ P&L Statement
(million euros)
2016 2017 2018 2019
Sales 6,545.00 6,728.00 7,001.00 8,751.25
Initial Inventory 850.00 865.00 922.00 975.00
Purchases 3,337.95 3,431.28 3,570.51 4,640.64
Final Inventory 865.00 922.00 975.00 1,218.75
COGS 3,322.95 3,374.28 3,517.51 4,396.89
Gross Margin 3,222.05 3,353.72 3,483.49 4,354.36
Operating Expenses 2,305.75 2,550.00 2,801.00 3,501.25
EBIT 916.30 803.72 682.49 853.11
Interest Paid 251.84 268.57 281.72 292.26
PBT 664.46 535.15 400.77 560.86
Tax 199.34 160.55 120.23 168.26
Net Income 465.12 374.61 280.54 392.60
Dividends Paid 279.07 224.77 168.32 235.56
Retained Earnings 186.05 149.84 112.22 157.04
Given information:
Expected Growth in business is 25.00%. This can be used to calculate expected sales in 2019
of 8751.25 €m.
Interest rate on bank loan is 3.5% pa and interest rate on long term debt is 9.00% pa.
Gross Profit and EBIT margins is expected to be stable in 2019 and maintaining the same
relationship that hold in 2018. Therefore in 2019 Gross margin will be 50% and EBIT margin
will be 9.75%.
Tax rate in 2018 was 30% and it is expected to remain at same level in 2019.
Financial Management
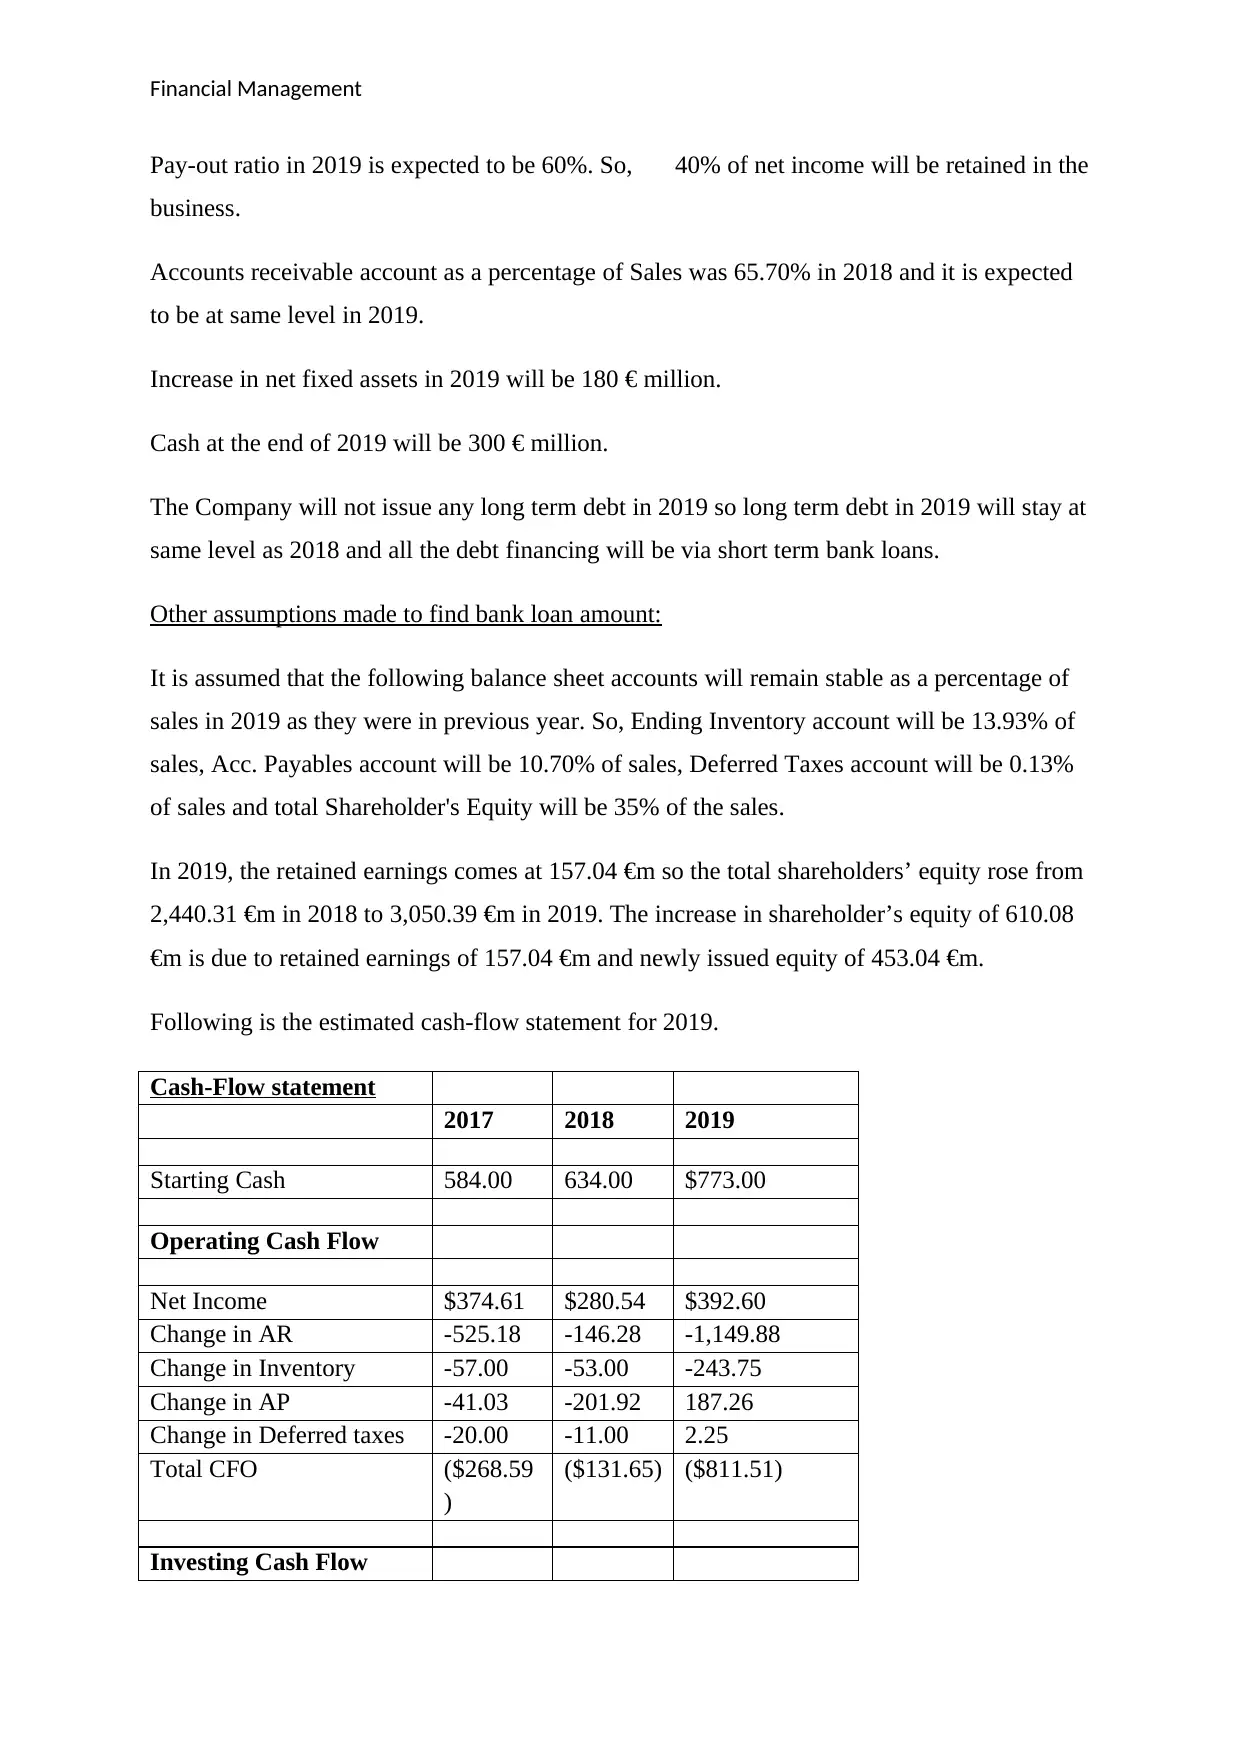
Pay-out ratio in 2019 is expected to be 60%. So, 40% of net income will be retained in the
business.
Accounts receivable account as a percentage of Sales was 65.70% in 2018 and it is expected
to be at same level in 2019.
Increase in net fixed assets in 2019 will be 180 € million.
Cash at the end of 2019 will be 300 € million.
The Company will not issue any long term debt in 2019 so long term debt in 2019 will stay at
same level as 2018 and all the debt financing will be via short term bank loans.
Other assumptions made to find bank loan amount:
It is assumed that the following balance sheet accounts will remain stable as a percentage of
sales in 2019 as they were in previous year. So, Ending Inventory account will be 13.93% of
sales, Acc. Payables account will be 10.70% of sales, Deferred Taxes account will be 0.13%
of sales and total Shareholder's Equity will be 35% of the sales.
In 2019, the retained earnings comes at 157.04 €m so the total shareholders’ equity rose from
2,440.31 €m in 2018 to 3,050.39 €m in 2019. The increase in shareholder’s equity of 610.08
€m is due to retained earnings of 157.04 €m and newly issued equity of 453.04 €m.
Following is the estimated cash-flow statement for 2019.
Cash-Flow statement
2017 2018 2019
Starting Cash 584.00 634.00 $773.00
Operating Cash Flow
Net Income $374.61 $280.54 $392.60
Change in AR -525.18 -146.28 -1,149.88
Change in Inventory -57.00 -53.00 -243.75
Change in AP -41.03 -201.92 187.26
Change in Deferred taxes -20.00 -11.00 2.25
Total CFO ($268.59
)
($131.65) ($811.51)
Investing Cash Flow
⊘ This is a preview!⊘
Do you want full access?
Subscribe today to unlock all pages.
Trusted by 1+ million students worldwide
Financial Management
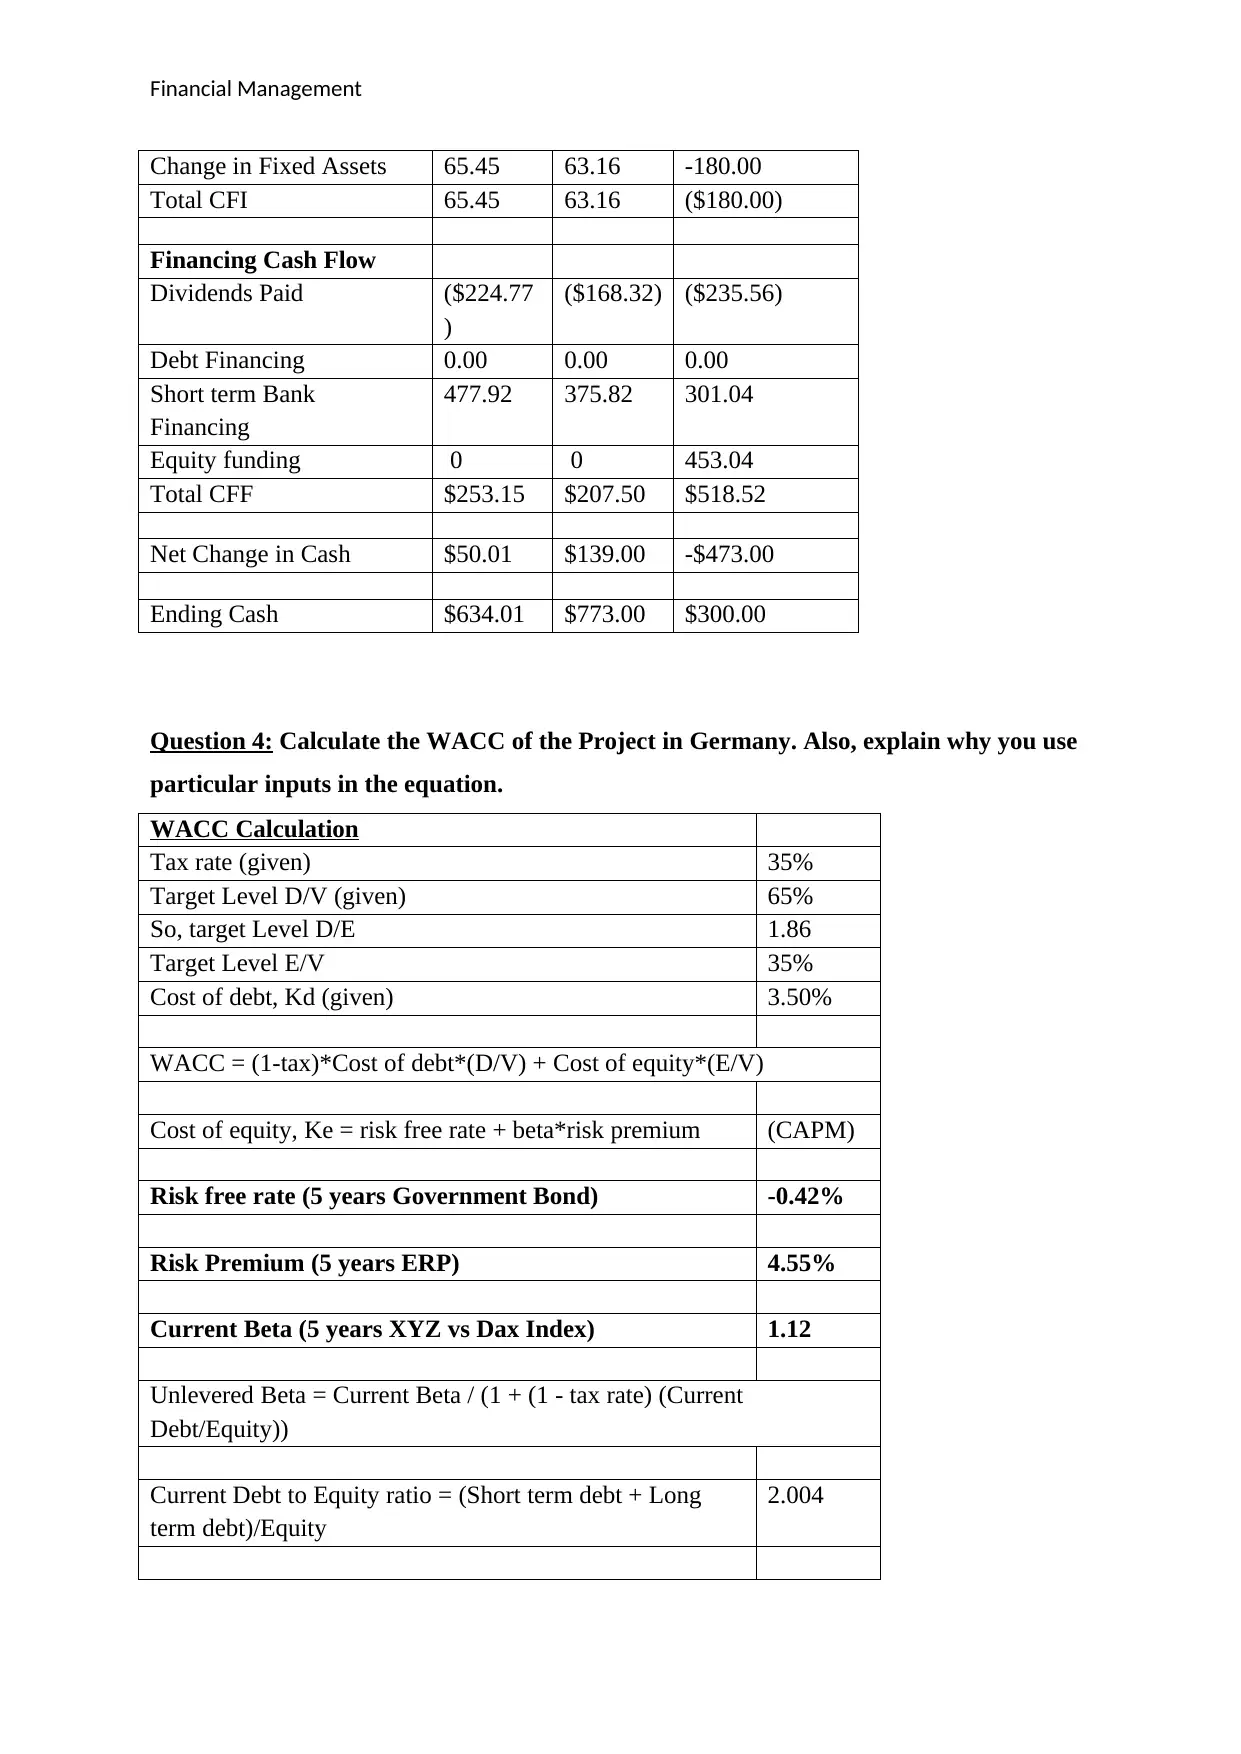
Change in Fixed Assets 65.45 63.16 -180.00
Total CFI 65.45 63.16 ($180.00)
Financing Cash Flow
Dividends Paid ($224.77
)
($168.32) ($235.56)
Debt Financing 0.00 0.00 0.00
Short term Bank
Financing
477.92 375.82 301.04
Equity funding 0 0 453.04
Total CFF $253.15 $207.50 $518.52
Net Change in Cash $50.01 $139.00 -$473.00
Ending Cash $634.01 $773.00 $300.00
Question 4: Calculate the WACC of the Project in Germany. Also, explain why you use
particular inputs in the equation.
WACC Calculation
Tax rate (given) 35%
Target Level D/V (given) 65%
So, target Level D/E 1.86
Target Level E/V 35%
Cost of debt, Kd (given) 3.50%
WACC = (1-tax)*Cost of debt*(D/V) + Cost of equity*(E/V)
Cost of equity, Ke = risk free rate + beta*risk premium (CAPM)
Risk free rate (5 years Government Bond) -0.42%
Risk Premium (5 years ERP) 4.55%
Current Beta (5 years XYZ vs Dax Index) 1.12
Unlevered Beta = Current Beta / (1 + (1 - tax rate) (Current
Debt/Equity))
Current Debt to Equity ratio = (Short term debt + Long
term debt)/Equity
2.004
Paraphrase This Document
Need a fresh take? Get an instant paraphrase of this document with our AI Paraphraser
Financial Management
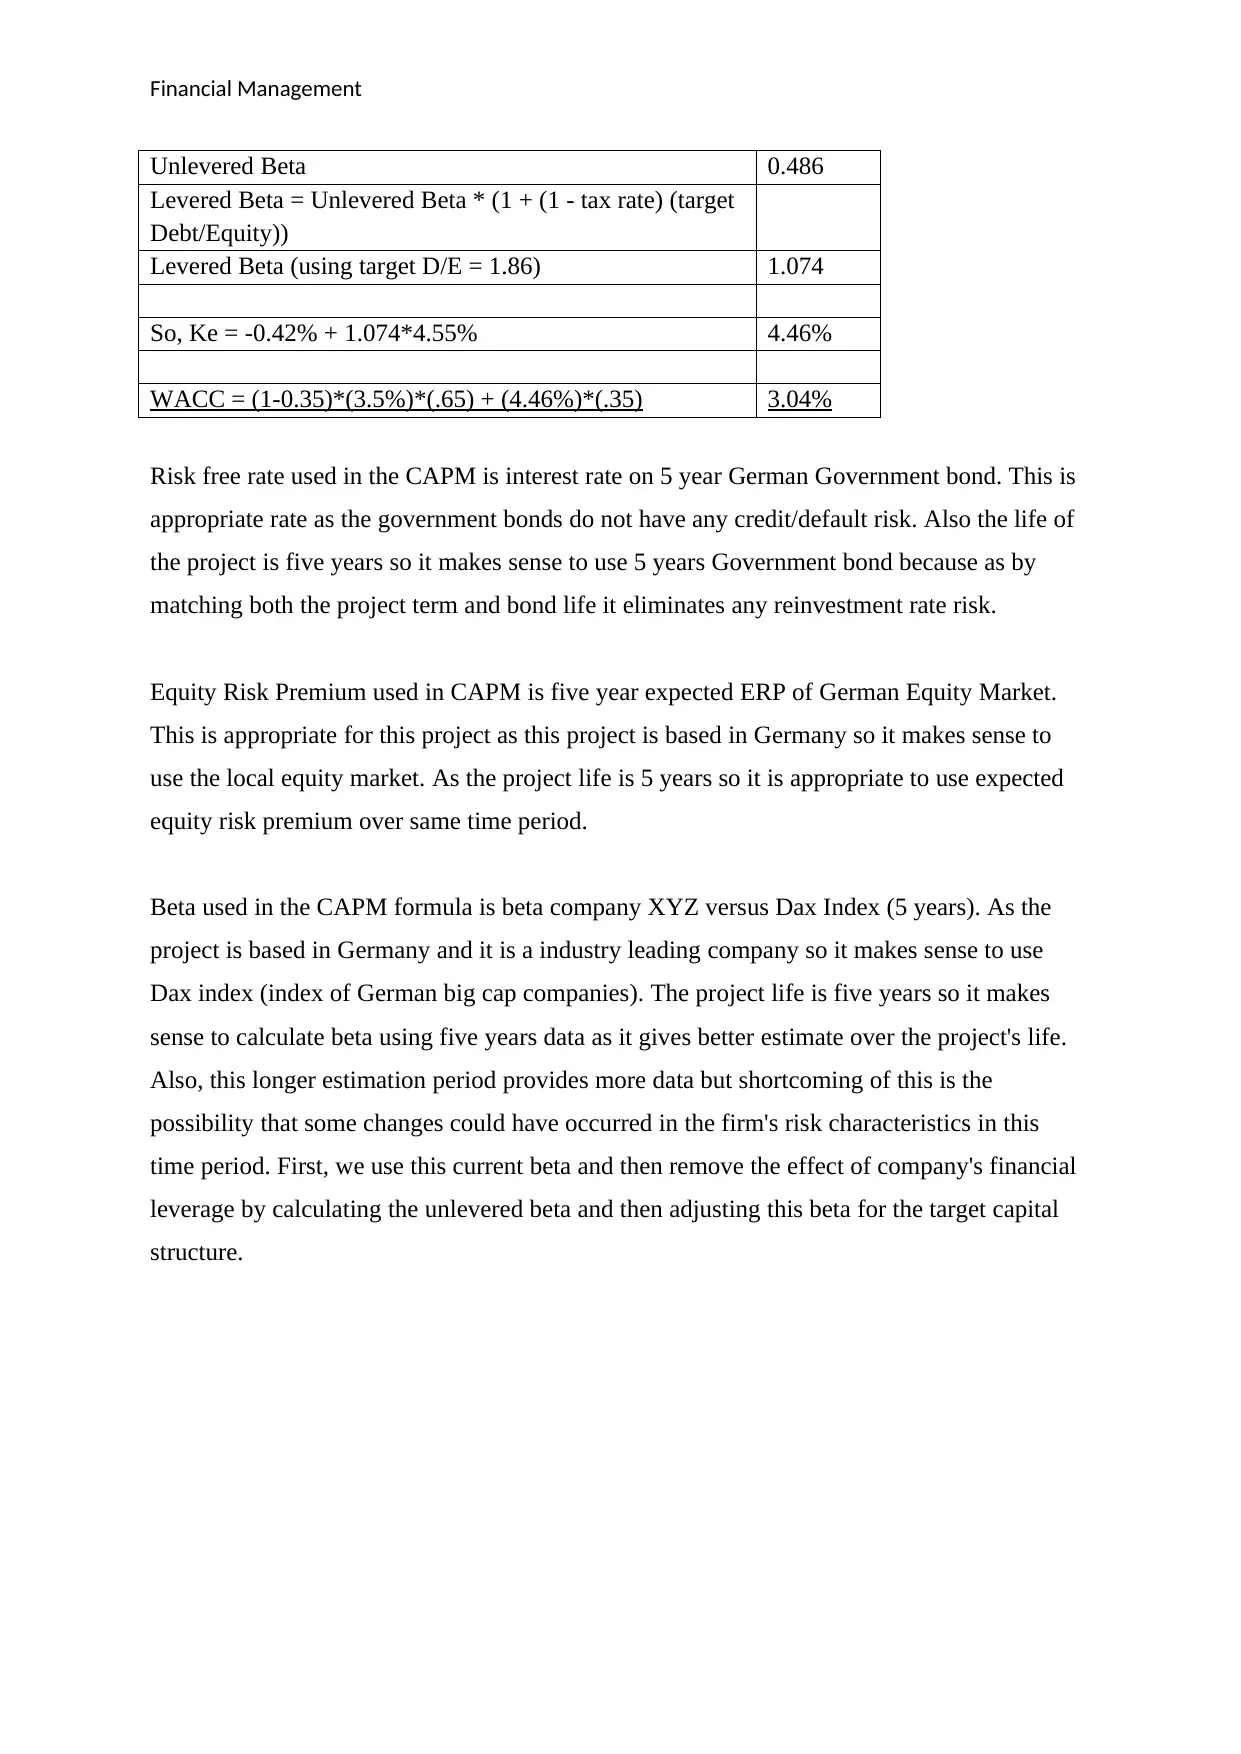
Unlevered Beta 0.486
Levered Beta = Unlevered Beta * (1 + (1 - tax rate) (target
Debt/Equity))
Levered Beta (using target D/E = 1.86) 1.074
So, Ke = -0.42% + 1.074*4.55% 4.46%
WACC = (1-0.35)*(3.5%)*(.65) + (4.46%)*(.35) 3.04%
Risk free rate used in the CAPM is interest rate on 5 year German Government bond. This is
appropriate rate as the government bonds do not have any credit/default risk. Also the life of
the project is five years so it makes sense to use 5 years Government bond because as by
matching both the project term and bond life it eliminates any reinvestment rate risk.
Equity Risk Premium used in CAPM is five year expected ERP of German Equity Market.
This is appropriate for this project as this project is based in Germany so it makes sense to
use the local equity market. As the project life is 5 years so it is appropriate to use expected
equity risk premium over same time period.
Beta used in the CAPM formula is beta company XYZ versus Dax Index (5 years). As the
project is based in Germany and it is a industry leading company so it makes sense to use
Dax index (index of German big cap companies). The project life is five years so it makes
sense to calculate beta using five years data as it gives better estimate over the project's life.
Also, this longer estimation period provides more data but shortcoming of this is the
possibility that some changes could have occurred in the firm's risk characteristics in this
time period. First, we use this current beta and then remove the effect of company's financial
leverage by calculating the unlevered beta and then adjusting this beta for the target capital
structure.
1 out of 11
Related Documents


Your All-in-One AI-Powered Toolkit for Academic Success.
+13062052269
info@desklib.com
Available 24*7 on WhatsApp / Email
![[object Object]](/_next/static/media/star-bottom.7253800d.svg)
Unlock your academic potential
Copyright © 2020–2026 A2Z Services. All Rights Reserved. Developed and managed by ZUCOL.